Resources and Energy 9 (1987) 55-73. North-Holland
EXERGY CONVERSION IN THE SWEDISH SOCIETY
Goran WALL*
Chalmers Unioersity of Technology, S-412 96 Giiteborg, Sweden Received April 1986
The exergy concept is reviewed as a tool for resource accounting. Conversions of energy and material resources in the Swedish society are described in terms of exergy. The necessary concepts and conventions are introduced. Exergy losses in transformations of material resources and in conversions of various forms of energy into heat are described in some detail.
1. A classification of resources
Natural resources, such as energy and material resources, appear partly as flows partly as stocks (fig. 1). We regard constantly flowing solar energy, wind energy and water flows as natural flows. A natural flow has a limited size but usually lasts for a very long time. An ecosystem, such as a forest, forms a valuable stock. It is built up of natural flows of sunlight, water, carbon dioxide, and mineral substances. It gives rise to a flow of new biological matter and part of this flow (the yield) can be taken out of the system
RESOURCES
>L FLOWS
STOCKS currents, etc Sunlight, winds, ocean /\
DEPOSITS (dead stocks) FUNDS (living stocks) oils, minerals, metals, etc Forests, fields, etc Adepositwnonlygivea
flow while diminishing The “yield” of a fund is a flow e.g. forest crops and agricultural crops Fig. 1. A classification of resources.
*I wish to thank Eva Ekehorn for contributing to the part on forestry and agriculture and Karl-Erik Eriksson, Bjiirn Eriksson, and Sten Karlsson for reading the manuscript and giving constructive criticism.
56 G. Wall, Exergy conversion in Swedish society
without decreasing the stock, Other stocks, such as oil deposits, have quite different qualities. A deposit can only yield a fiow if it is gradually depleted.
Among stocks we therefore differentiate dead stocks or deposits from living stocks or funds [Georgescu-Roegen (1971,1975)]. This is a time based classification because the time of reproduction is the physical concept that is of interest here. Deposits and funds are defined with regard to the difference in the time of reproduction. Natural flows and flows from funds are often called renewable flows.
2. Energy and exergy
Energy cannot be created or destroyed. Energy appears in many forms and different qualities and the quality of energy can increase locally or be destroyed. In table 1 some energy forms are listed in decreasing order of quality. (We shall return to the quality factor used in the table.) It must be noted that this factor is only approximate. When using energy we utilize the energy conversions along its way towards heat at environmental temperature.
The necessity to determine the available part of the energy, or - which is the same - the amount of mechanical work that could be extracted from it, has long been recognized [Carnot (1824), Gibbs (1873), Darrieus (1930), Keenan (1932,1941)].
In 1953 Rant (1956) suggested that the term exergy should be used to denote ‘technische Ar~its~higkeit’. A clear, and completely general, de&- nition was given by Baehr (1965):
‘Die Exergie ist der unbeschrankt, d.h. in jede andere Energieform umwandelbare Teil der Energie.’ (Exergy is the totally convertible part of the energy i.e., that part which may be converted into any other energy form.)
Evans (1969) has shown that exergy (which he prefers to call ‘essergy’) in itself incorporates the concepts of free energy used by Helmholtz and by Gibbs and ‘availability’ introduced by Keenan (1932). Another - quite adequate - name for the same thing ‘available work’ was used by a working group within the American Physical Society (APS) in 1975 [Berman et al. (1975)]. Sorensen (1976) has shown that exergy is a useful concept in Bronstedian Energetics. A comparison of different heating systems based on the theory of exergy has been made by Bore1 (1975). The exergy concept is
also being used in groups working with systems analysis nhoma
(1977), Voigt (1978)]. A workshop on Second Law Analysis of Energy Devices and Processes was held in August 1979 [Cambel et al. (1980)].
Exergy is a measure of how far a certain system deviates from equilibrium with its environment. The exergy E for a system in a large en~ronment is
G. Wall, Exergy conversion in Swedish society 57
[Wall (1977)]
E=%(S,,-S), (1)
where TO is the temperature of the environment and S,,-S is the deviation from equilibrium of the negentropy (=minus the entropy) of the system and its environment. (‘eq’ denotes equilibrium with the environment.)
Another expression for the exergy is
E=U+peV-T,S-_Cpi&, (2)
where U, v S, and ni denote extensive parameters of the system (energy, volume, entropy, and the number of moles of different chemical components) and pO, TO, and pi0 are intensive parameters of the environment (pressure, temperature, and chemical potential which also may include gravitational and electromagnetic potentials etc.).
A very useful formula for determining the exergy was given by group [Berman et al. (1975)-J,
the APS-
(3) where on the right side easily determined quantities appear. It is thus an easy task to determine the exergy content of a given system in a given environment.
For a substance which has an exergy content deriving only from its concentration the following relation holds:
E = nRT, - In (c/c,), where n =number of moles of the substance, R =gas constant,
(4)
TO = temperature of the environment,
c =concentration of the substance in the material in question, and co =concentration of the substance in the environment.
For materials like inert gases or other not chemically active materials this concept of exergy is applicable. Materials which react chemically get an additional exergy contribution from the change in the chemical potential.
The exergy content in a material can thus be summarized in the formula
E = n. (p - p. + RT, * In (c/c,)), where (5)
po=chemical potential for the material in its reference state, i.e., in equilib- rium with the environment.
58 G. Wall, Exergy conversion in Swedish society
The chemical potential for most materials is to be found in a tabular form [Handbook of Chemistry and Physics].
Let us illustrate the meaning of exergy by some very simple examples: (1) A system in complete equilibrium with its environment does not have
any exergy. There is no difference in temperature, pressure, or concen- tration etc. that can drive any processes.
(2) A system carries more exergy the more it deviates from the environment. Hot water has a higher content of exergy during the winter than it has on a hot summer day. A block of ice carries hardly any exergy in winter but in summer it does.
(3) When the energy loses its quality this means that exergy is destroyed. The exergy is the part of the energy which is useful in the society and therefore it has an economic value and is worthy of being taken care of. (4) Almost all energy, converted in the thin layer on the earth’s surface,
where life can be found, derives from the sun. Sunlight, rich in exergy, reaches the earth. A lot of it is reflected but the energy absorbed on the earth is converted and finally leaves the earth as heat radiation without any exergy relatively to the earth. The net exergy absorbed by the earth is consequently gradually destroyed but during this destruction it manages to drive the water/wind system and the life on earth. The green plants absorb exergy from the sunlight and convert it via the photo- synthesis into chemical exergy. The chemical exergy then passes through different food chains in the ecosystems. On every trophic level exergy is consumed and microorganisms live on the last level in this food chain. There exist no waste.
(5) A concentrated deposit of mineral ‘contrasts’ to the environment and this contrast increases with the concentration of the mineral. The mineral is thus a carrier of exergy. When the mineral is mined the exergy content of the mineral is kept constant and if it is being enriched the exergy content increases. A poor deposit of mineral contains less exergy and can accordingly be utilized only through a larger input of external exergy. Today this substitution of exergy often comes from exergy forms such as coal and oil. When a concentrated mineral is dispersed the exergy content is decreased (point 3).
(6) An obvious difficulty in the definition of exergy is that it depends on the environment. This difficulty could, however, be solved through conven- tions; one could define a ‘standard environment’ with a given chemical composition at a certain temperature and pressure. A possible standard environment for global use could for instance be a standard atmosphere, a standard sea and a standard bed-rock. One principal problem is, however, that these systems are not in equilibrium with each other. Some- times one should in addition to this use local standards depending on the seasons (point 2).
G. Wall, Exergy conversion in Swedish society 59 3. Exergy as a general resource concept
Exergy is the ‘fuel’ for dissipative systems i.e., systems that are sustained by converting energy and materials; e.g., a living cell, an organism, an eco- system, the earth’s surface with its material cycles, or a society. The exergy concept could therefore in this sense be used systematically to describe such systems scientifically.
The exergy concept has mostly been used within heat and power tech- nology, where one works with heat of varying qualities. The field of application can be extended to the totality of energy and material conver- sions in the society. This yields a uniform description of the use of physical resources and the environmental impacts in connection with this use.
Natural resources are traditionally divided into energy resources and other resources. This separation often can be only approximate. Oil, for example, is usually looked upon as an energy resource and wood is regarded as a material resource. This distinction is not very meaningful, however, because oil can also be used for producing useful materials and wood can be used as a fuel. It would be more appropriate to consider these resources together. The exergy concept is in this connection an adequate resource measure. The exergy content of the energy resources may be given by their energy content multiplied by a quality factor that applies to the energy form in question (table 1). Energy resources are usually measured in energy units i.e., the same unit as exergy. Other resources are usually measured in purely quantitative units as weight, volume, or number.
In principle, a material can be quantified in exergy units just by multi- plying its quantity with a transformation factor for the material. The unit of such a transformation factor could then be e.g., J per m3 or J per kilogram. This would be the beginning of an expanded resource budgeting and a first step towards an integration with the traditional energy budgeting.
Table 1
The quality of some common energy forms.
Energy form Quality factor
Mechanical energy Electrical energy
Chemical energy approx. 1.W
Nuclear energy 0.95
Sunlight 0.9
Hot steam (600°C) 0.6
District heat (90°C) 0.2-0.3b
Heat at room temperature (20°C) 0-0.2b Thermal radiation from earth 0
‘May even exceed 1, due to definition of system boundaries and final states.
60 G. Wall, Exergy conversion in Swedish society
Exergy per unit quantity is in fact the physical value of a resource relative to the environment. This can be compared to a price which is also partly defined by the environment through for instance demand.
Exergy can only denote one extensive physical quality of goods. The exergy content does not imply anything about intensive physical or biological qualities like electric conductivity, nutritive value, toxicity, or the like. However, when a material is used as an exergy converter the efficiency is then related to the quality of interest of the material. A material with bad electric conductivity gives a greater exergy loss than a material with good electric conductivity gives when being used as an electric conductor.
4. Resource conversions in the Swedish society
The main conversions of energy and materials in the Swedish society in 1980 is shown in fig. 2. The flows of resources go from left to right in the diagram. The width of the flows is defined by their exergy content and the unit of the flows is J/year. (Since the flows vary very much during the year I prefer to use the unit J/year instead of W.) The inaccuracy of the flows vary from 5% for electricity to about 20% for the heat flow to houses and other premises. In order not to make the diagram too complicated only exergy flows exceeding 5 PJ/year are included. The inflows are ordered according to their origins. Sunlight is thus a renewable natural flow. Harvested forests, agricultural crops, and hydro power are renewable exergy flows deriving from funds. Iron ore, nuclear fuels, and fossil fuels are non-renewable exergy flows from deposits. Exergy conversions are represented by the untilled boxes. The resources actually demanded in the society appear as outflows on the right side of the diagram.
4.1. Solar heating
The inflow of sunlight, about 2OPJ, is converted into heat. (The total inflow of sunlight over the area of Sweden is approx. 1000000 PJ/year.) The converted flow of solar heat is about 1 PJ which supplies about 5% of the use of heat for space-heating, that can be seen at the very bottom on the right in the diagram, during the heating season. The exergy content in heat is treated in section 4.8. A window towards the south lets in about 7 MJ/m2 and day during the heating season in Stockholm. With an adequate regulation by shutters a window towards the south can be equivalent to a small heat radiator.
4.2. Forestry and industry based on forests
In Statistical yearbook of forestry (1980) the stocks of timber and the raw materials derived from the forests are generally quantified in m3 wood
I L hvdro-electic Dower ~hts LIGHTING, ETC
transmission losses etc
II M U refmeries
X#
I industry I shippingu
homes and public premises 1100 PJ/yr Is
c
Ic
I C I P IFig. 2. The exergy conversion system in Swedish society in 1980. Total conversion 2539PJ or 305 GJ/capita; net output 500 PJ or 6OGJ/capita.
without bark. Wood is here used as a unifying name of many different kinds of wood.
The exergy of wood is about 18 MJ/kilogram dry solid [Wall (1983)]. The natural water content of wood is about 25%. With an average value of the density of 450 kilograms of dry solid per m3 we get an exergy of 8 GJ/m3.
The exergy content of wood is given by the total change of chemical and ‘structural’ exergy. The chemical exergy is the exergy stored in the material as lack of binding exergy between the atoms in a molecule. The structural exergy is the exergy or information stored in the structure of a material. This part is of great value for certain materials such as proteins or cellulose tibres. The structural exergy is well utilized when wood is used as building material or as raw material for the production of paper. By burning useful wood this part is utilized very badly. We optimize the utility of exergy better if we only
62 G. Wall, Exergy conversion in Swedish society
Table 2
The conversion of forest products within Swedish forestry and industry based on forests in 1980,
measured in PJ. Timber-cutting
Timber from stores Waste paper Imports 394 23 14 73 - Total consumption 504
Input to the saw mill industry 178 Input to the pulp and paper industry 266 Use of wood based fuels (lignin) 120 Production of timber ware 133 Production of market pulp 64
Production of paper 114
Firewood 19
Total production 330
burn structurally useless wood or paper. The structural exergy is, however, often a very small part of the total exergy content of a material but nevertheless very useful.
In 1980 the forest crops were used according to table 2. Swedish timber- cutting were 49.2 Mm3 or 394PJ. (The annual growth of forests is about 60 Mm3 or 480 PJ.) The change of storages adds 23 PJ. 178 PJ of the forest products were used by the saw milling industry. Their production was mainly timber, 114PJ. Parings and chips to the pulp industry amounted to 74PJ and 15 PJ from edgings were used for producing wallboard, particle board, and plywood. 266PJ were used by the pulp and paper industry. The paper industry also used 14PJ of waste paper. The production was: 43 PJ from mechanical, chemical and dissolving wood pulp, 16 from sulphite pulp, and 96 PJ from sulphate pulp. Of this production 64 PJ were market pulp and the rest were used in the paper production. The main products were Kraft paper, 54PJ, and newsprint paper, 29 PJ. Writing paper and board amounted to 31 PJ.
The export of products from the forest industry were 194PJ, mainly paper, pulp, and planed boards. The total imports were 73 PJ, mainly paper wood, 20 PJ, and saw timber, 29 PJ.
From private forests 19 PJ were used as firewood. Chips and bark from saw mills were also used as fuels, 8 PJ.
In the pulp production there was a great loss of exergy depending on the conversion of chemical exergy into heat at the boiling of pulp. 120PJ of the forest crops (lignin) together with 63 PJ of other fuels (see section 4.7) gave
G. Wall, Exergy conversion in Swedish society 63
less than 60PJ of heat (see section 4.8). Within the wood and pulp industry also 57 PJ of electricity were consumed. The exergy content of the outputs, consisting of timber, pulp and paper, were 331 PJ.
4.3. Agriculture and food production
Harvested crops are converted into food. The input in agriculture and food industry is not only solar radiation but also fertilizers, fuels, and electricity. The food consists partly of plant substances such as vegetables and bread partly of animal substances such as milk and meat. We see that the outflow of food is very small mainly due to losses in the production of animal substances.
The agricultural land of Sweden covers at present about 3 million hectares. The yield is very stable from an international point of view. It varies only a few percent per year and this is compensated by trade exchanges. In table 3 the exergy contents [Wall (1983)] of the most common Swedish crops are to be found [The Statistical yearbook of agriculture (1980)].
The total exergy content of the vegetation products was 190PJ. In addition to this there were residues such as straw and harvesting losses, 138 PJ. The amount of residues that was brought back to cultivation was estimated to 31 PJ. The exergy from fossil fuels, mainly diesel fuel and fuel oil, and electricity used in agriculture and in greenhouses was 25 PJ. Another 24PJ was used in the food industry. The export and import of agricultural
products were approximately equal in exergy terms. Mostly cereals were exported and feeding-stuff for animals were imported. The indirect use of exergy mainly in the form of fertilizers amounted to approx. 24PJ. This is not included here. The output from this sector is food.
The food consumption in Sweden 1980, with approximately 8.3 million inhabitants, can be estimated in different ways. According to the re- commended daily intake the people in Sweden should consume 29PJ with considerations taken to the age-distribution. In the statistical yearbook there is stated an average of 2862 kcal/day and person. This adds up to 36PJ for the Swedish consumption. If the statistics of the total consumption of food, distributed from stores, is trusted the Swedes consumed 42PJ in 1980. The waste could be not-digestible food like peels and bones. About 70% is eaten which correspond to other estimates of 30% waste [Eriksson (1978)].
4.4. Electricity from hydro-power and thermal power
Electricity was used within the forest industry, 57 PJ, and in the food production, 19 PJ. Furthermore electricity was used for lighting, electrical domestic appliances etc., 114PJ. Within the manufacturing industry much of the electricity, 27 PJ, was used for driving machines i.e., mechanical work.
64 G. Wall, Exergy conversion in Swedish society
Table 3
Vegetable and animal yield in Sweden 1980. MJ/kilogram Kton PJ Vegetable yield
For humans: Bread grain
Sugarbeets, potatoes etc.
15.5 1416 22 4.2’ 3186 13 Total For animals: Coarse grain Oliferous plants Legumnous plants Hay Pasture 35 15.8 3896 61.6 19.1 323 6.2 16.7 24 0.4 15.3 4132 63 23 Total Residues: Straw
Harvesting loss etc.
15.7 approx. 155 6720 106 32 Total Animal yield Meat, eggs Milk
Wool, blood, skin etc.
138 Total vegetable yield 328
575 12 3338 11 1 Total animal yield 24 ‘There is a large uncertainty in the precise composition of the materials especially concerning the water content.
The rest of the electricity went mainly into the mining industry and iron and steel industry, 34 PJ, chemical industry, 20 PJ, transports, 8PJ, and electric heating, 33 PJ.
In 1980 production of electricity from hydro power was 209 PJ. If we include conversion losses of potential energy in the dam into electricity supplied by the power plant and transformer losses at the power stations and pumping in pumping stations the gross exergy supply becomes 248 PJ as hydro power.
Nuclear fuel (U-235) and fossil fuel like oil and coal are also used to produce electricity. These conversions occur in condensing power plants and for oil also in combined power and heating plants. A combined power and heating plant furnishes not only electricity, but also district heating by a so- called back-pressure process. We can see from the diagram how this flow of
G. Wall, Exergy conversion in Swedish society 65
district heating, lOPJ, goes into the heating outflow for housing and other premises.
The production of electricity was 91 PJ and 38 PJ respectively from nuclear and fossil fuels. The total production of electricity was then 340PJ of which 2PJ was net imported electricity. Of this production 307 PJ was used. The rest, 33 PJ, was lost along its way to the consumer due to electric resistance and imperfect adaptation between production and consumption.
4.5. Iron ore
The Swedish mining industry is totally dominated by iron ore. The Swedish iron ore has an average iron content of about 60% (weight percentage) and it usually consists of magnetite in which the iron ore has the chemical composition Fe,O,. The molecular weight for iron is 558grams, which implies that 1 kilogram (kg) of iron ore consists of 600/X8 = 10.7 moles of iron.
Let us assume that Fe and 0 are represented as Fe,O, (hematite) in solid form at the mole fraction of 2.7. 10e4 and O2 in gaseous form at the partial pressure of 20.40 kPa in the standard environment [Szargut (1980)].
The chemical potential for iron in hematite and magnitite then becomes
AFe
magnc,i,c) = (l/3) * ( - 1014.2 + 2 * 3.84) kJ/mole = - 335.5 kJ/mole, pO(Fehcmati,e) =( l/2). (- 741.0 + 1.5.3.84) kJ/mole = - 367.6 kJ/mole, where 3.84 kJ is the amount of exergy released when the partial pressure of one mole of oxygen decreases from 101.325 kPa to 20.40 kPa at 15°C.The exergy content of magnetite iron ore then becomes:
E(iron ore)= 10.7. (367.6-335.5). 103+8.31 *288aln
= 0.5 1 MJ/kilogram,
E(iron) = 17.9. 367.6. lo3 +8.31*288.ln
(2.2.7: 10-4)] = 6.90 MJ/kilogram,
since 1 kilogram of Fe is equivalent to 17.9moles.
These figures are well in correspondence with usually used values of iron [McGannon (1971), Gyftopoulos et al. (1974)].
The Swedish production of iron ore was in 1980 approximately 26.9Mton.
66 G. Wall, Exergy conversion in Swedish society
If we assume all this ore to be magnetite iron ore, since most of the Swedish iron ore is, then the ore represents a total exergy quantity of 14 PJ.
The production of iron was roughly 3.5 Mton, representing an approxi- mate quantity of 24PJ. To produce this iron about 57Mtons of ore was needed, corresponding to 3 PJ together with 34 PJ of electrical exergy and 77 PJ of coal. coke and other fuels.
4.6. Nuclear fuel
The exergy content of nuclear fuel (enriched uranium) is estimated on the basis of how much energy that is released as heat in a thermal reactor for a certain amount of produced electricity. At an efficiency of 32% this becomes 284 PJ.
4.7. Chemical fuels
Chemical fuels or, shorter, fuels are oil and oil products, like kerosine and petrol, coal and coal products, like coke and urban gas, natural gas, and peat.
The most common fuels in Sweden are crude oil, oil products, pit coal and coke. The exergy content of these are 42.3, 41.2-43.2, 27.4 and 28.1 GJ/ton respectively [Wall (1983)]. The total import of these goods was in 1980 equal to 1140PJ.
Within the chemical industry fuels are also used as raw materials. This means that a large fraction of the exergy remains in the products, i.e., the relative conversion losses are moderate. 18 PJ of oil and 20 PJ of electricity were converted into 30PJ of rubber, plastics, fertilizers etc. The chemical industry is thus an example of how a traditional energy resource like oil is used as material. The used material can then be used as an energy resource. (We have, however, to consider the problem with special pollutant emis- sions.) This is of course also true for many other used materials like wood and paper.
As we see from the diagram the transportation system takes a great deal of the fuel inflow, 237PJ. Petrol and oil are converted into transport work in cars, buses, trucks, etc. About 10% of the exergy content of the fuel is used to run a vehicle.
33 PJ were used in the oil refineries, 36 PJ for bunkering for foreign shipping, 419 PJ for direct conversion into heat for housing and other premises, 167 PJ for the production of electricity and heat in combined power and heating plants and in oil-based condensing power plants, and 60PJ for heat production within the industry.
G. Wall, Exergy conversion in Swedish society 67
4.8. Exergy losses at the conversions into heat
At the bottom of the diagram we then have the largest aggregate of conversions which is that of fuels, electricity, solar heat and hot water (district heating) into heat at room temperature (space-heating). This conver- sion is shared between apartment houses, family houses, and other premises. As we see, heavy losses appear here.
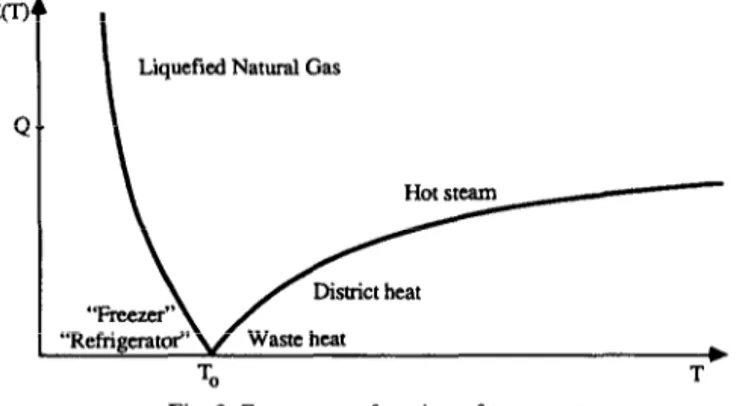
The exergy content of heat is
E=
where Q is the quantity of heat and T its absolute temperature (Kelvin). TO is the absolute temperature of the environment. The ratio (T - T,)/T is also known as the Carnot efficiency.
In fig. 3 we can see how the exergy content depends on the temperature. Exergy becomes almost equivalent to energy at very large values of the temperature.
In fig. 3 are marked some different forms of heat. The temperature of the environment is 15°C.
Let us now look upon two common exergy converting processes, fuels converted into heat in industrial processes and fuels or electricity converted into heat in space-heating.
In the tirst case we have a constant need of heat independent of small variations in the ambient temperature. This means that the exergy content of the produced heat is fairly well defined.
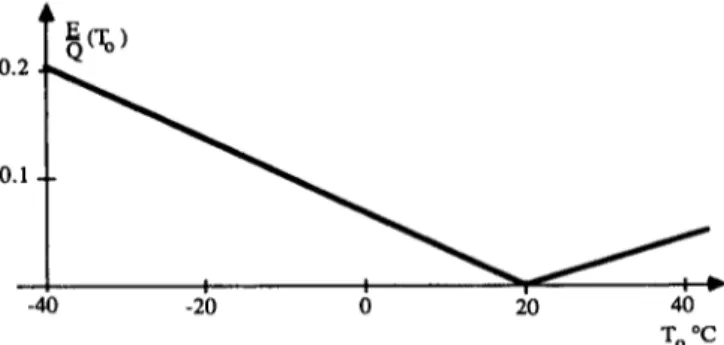
In space-heating the situation is more complicated as the need for heating is entirely depending on the ambient temperature. We now consider the indoor temperature, 20°C or 293K, as constant. The exergy content of the indoor heat then varies with the outdoor temperature according to fig. 4.
68 G. Wall, Exergy conversion in Swedish society
20 i0 40
To -2
Fig. 4. The exergy content of the indoor heat as a function of the outdoor temperature.
In order to apply this to space-heating we must take into consideration the variations of the ambient temperature.
Assume that the ambient temperature varies harmonically during the year and during the day, then the average exergy content is
E (aZ+b2/2+c2/2)~d+(b/o)~[(b/2)~sin(wd)-4~(a-c)~sin(od/2)]
-_= (7)
Q T . [ad - (2b/w) * sin (od/2)] where
E =exergy, Q = heat (energy),
T = the indoor temperature (in Kelvin),
a = T - To, where To is the annual average outdoor temperature, b = To - Tmin, where Tmin is the minimal five-day mean temperature, c =(Ly- T,&/2, the diurnal amplitude,
d = the length of the heating season (in days), o =2x/365 per day.
In table 4 meteorological data, relative population X, exergy value E/Q, and relative exergy value X. E/Q for different areas in Sweden are shown. Sweden is here divided into seven different areas. The meteorological data for an area is defined by the meteorological data for a representative town in that area. The diurnal temperature variations are set to 4°C for all areas during the heating season [Sundell (1980)].
The exergy value E/Q, decreases when we move towards the south from Umel to Malmii. This is also reflected in the decreasing heating needs. By summing up relative exergy values of the areas we get the total amount of exergy in space-heating for the whole country. The result can be stated: 5.0% of the supplied heating energy represents exergy. (In addition to this there
G. Wall, Exergy conversion in Swedish society 69 Table 4
The average temperature T,, the minimal five-day mean temperature T,,,, number of heating days d, exergy value E/Q, relative population X and relative exergy value X. E/Q
in 1975. Representative
town’ T,“C Li”“C d days E/Q%b X% X . E/Q%
UmeH 4.0 -11.0 277’ 6.12 9.4 0.632 Gstersund 4.2 -9.2 283 6.27 8.5 0.533 Karlstad 7.7 -4.4 235 5.00 9.9 0.495 Stockholm 8.4 -3.2 230 4.84 24.0 1.160 Jijnkiiping 7.9 -3.6 237 4.82 17.3 0.834 Goteborg 9.3 0.3 226 4.00 16.6 0.664 Malmij 9.1 -1.6 225 4.54 14.3 0.649 Total 100.0% 4.97% ‘The country is divided into areas according to (the letters represent counties): UmeB - BD, AC, Y, Gstersund - X, Z, W; Karlstad - S, T, U, Stockholm - A, B, C, D, Jijnkijping - E, F, G, H, I, R; Gijteborg - N, 0, P; Malmii - K, L, M.
Valculated with an indoor temperature of 20°C and a diurnal temperature variation of 4°C.
‘The value is estimated for Lulea.
are of course furnace losses etc.) This estimate of the exergy content in heat for space-heating could also, of course, have been estimated from a diagram over the cumulative annual heat load variation.
As estimate of the exergy content in heat for space-heating is also made from data over the number of hours during the year that the outdoor temperature is below the temperatures: -29.5, -24.5, - 19.5, - 16.5, - 13.5,
-9.5, -4.5, and -O.S”C, and above the temperatures: 14.5, 9.5, 4.5 and -0.4”C. When the temperature reaches 11°C the heating needs are assumed to vanish. From this estimation we get that the total amount of exergy in the space-heating is 6.3%, table 5. The earlier estimated exergy value, 5.0%, was lower mainly because the estimation did not include the irregular tempera- ture fluctuations which are included here. However, these fluctuations are often very short and are then in practice washed out because of the heat load capacity in the buildings. Five percent is therefore assumed to be a reasonably good exergy value of the indoor heat during the heating season.
The flow of exergy for the Swedish house heating is thus obtained by multiplying the supplied heating quantity (the energy) by 0.05. This results in the figures: 1 PJ solar heat, 1 PJ from fire wood, 2 PJ of district heat, 2 PJ of electric heat, and 15 PJ of heat from fuels. The figure for heat from fuels also includes other losses, approx. 35%, such as hot exhaust gases. The minimal physical need of exergy for space-heating is thus only 19 PJ. The total exergy supply is, however, more than 500 PJ.
G. Wall, Exergy conversion in Swedish society
The
Table 5
annual mean temperature T,, exergy value E/Q and relative exergy value X. E/Q in 1975.
Representative town’ Luled 3.1 8.29 0.780 Gstersund 4.2 7.23 0.615 Karlstad 7.7 6.18 0.612 Stockholm 8.4 6.02 1.445 Norrkoping 7.9 6.22 1.076 Gijteborg 9.3 5.59 0.928 Malmij 9.1 5.83 0.834 Total 6.29% ‘The country is divided into areas according to (the letters represent countries): Lulel-BD, AC, Y; &tersund - X, Z, W; Karlstad - S, T, U; Stockholm - A, B, C, D; Norrkijping - E, F, G, H, I, R; Gijteborg - N, 0, P; Malmo - K, L, M.
bCalculated with an indoor temperature of 20°C.
4.9. Chains of resource conversions
Let us now look at the following chain of resources: nuclear fuel to electricity to heat in the diagram of fig. 2. In the conversion of nuclear fuel to electricity 32% of the exergy in the nuclear fuel is utilized. Then if we follow the electricity flow down to the electric heating only 5% of the electricity is converted into heat. The total conversion into heat utilizes thus only 1.6% of the exergy in the nuclear fuel. In todays Light Water Reactors (LWR) only a minor part of the nuclear exergy in the fuel is utilized. A breeder reactor is more efficient. If we also include this imperfection the overall efficiency of converting nuclear exergy (LWR) to space-heating becomes extremely low. In the future this misuse of resources must be avoided. The conversion of fossil fuel (oil) via electricity to heat is somewhat better, 2.0%. Instead of resistance heating (short-circuiting device) we should use heat pumps and in the near future improve the conversion of electricity to heat to over 30%. Today there exist, for this purpose, commercially available heat pump systems with an exergy efficiency of 20%. There are many other chains of conversions in the diagram that could be discussed but this is one with especially small overall efficiency. (Still it is becoming increasingly common, In 1975 the use of electricity for this purpose was 22 PJ.)
22 PJ.)
Of the total inflow of energy and material resources into the Swedish society of about 2500 PJ in 1980 only 20% or 500 PJ reached final use. Heavy losses could be considerably reduced by an active resource budgeting and
G. Wall, Exergy conversion in Swedish society 71
economizing on all levels in the society. If we had looked only at the use of commercial energy resources (hydro-power, nuclear fuel, and fossil fuels) the efficiency would have been even somewhat worse, namely approx. 14%.
In the long run exergy needs of a society must be supplied almost entirely from renewable resources. As we can clearly see from the diagram over the exergy conversion in the Swedish society in 1980 this was not at all the case.
Analyses of this nature provide us with knowledge as to how effective and how balanced a society is in the matter of conserving natural resources. This type of knowledge can identify areas in which technical and other improve- ments should be undertaken and indicate the priorities which should be assigned to conservation measures. Making comparisons of this type between various societies throughout the world and studying the international system should also be of fundamental interest if we are serious in our efforts to work towards an equitable distribution of resources.
Appendix
Suppose we want to maintain a constant temperature T in a house in an environment at a lower temperature T,(t) depending on time, t. To do this we must add a certain power 0 (see fig. A.l) because of the heat losses of the house.
The necessary power Q(t) depends on the overall heat coefficient U of the system, its limited area A and the difference between the temperature inside and outside the house according to
&t)=U.A.(T-T,(t)).
The total amount of heat required during a year is Q=@W,
where d is the number of days of the heating season.
(A4
64.2)
O-mall heat cceffiicnt: U
12 G. Wall, Exergy conversion in Swedish society The exergy flow B(t) corresponding to the heat flow Q(t) is
B(t) =
T-2(t) .
Q(Q.We assume that the temperature of the environment during the year according to
T,(t)=T,+(T,-Tm,,).cos
Gay
- Tight
2 * cos (2at) *
(A.3)
varies harmonically
(A-4)
From (A.l), (A.2), (A.3) and (A.4) we then get the total exergy needed:
E=j@t)dt
0
= Q. (a2 + b2/2 +c2/2). d+ b/o. [(b/2) *sin (od) -4*(a-c) . sin (wd/2)]
T * [ad - 2b/w * sin (od/2)] 9
(A.3 where a =T-To, b = To - T,i”, C = ( Gay - T,ig,J/2, o = 2x1365 x0.0172. References
Baehr, H.D., 1965, Energie und Exergie (VDI-Verlag, Diisseldorf).
Berman, S.M. et al., 1975, eds., Efficient use of energy, American Institute of Physics Conference Proceedings no. 25.
Borel, L., 1975, Energy economics and exergy - Comparison of different heating systems based on the theory of exergy, heat pumps and their contribution to energy conservation (Noordhoff International Publishing, Leyden, Holland).
Cambel, A.B. et al., eds., 1980, Energy, Vol. 5, 665-1012.
Carnot, S., 1824, Reflections on the motive power of heat (American Society of Mechanical Engineers, 1943).
Darrieus, G., 1930, Engineering 130,283.
Eriksson, B., 1978, Niirproduktion av livsmedel (Local production of food) (Centre for Interdisciplinary Studies of Human Conditions, Giiteborg) (in Swedish).
Evans, R.B., 1969, A proof that essergy is the only consistent measure of potential work, Ph.D. thesis (Dartmouth College, Hanover, NH).
Georgescu-Roegen, N., 1971, The entropy law and the economic process (Harvard University Press, Cambridge, MA).
G. Wall, Exergy conversion in Swedish society 13 Gibbs, J.W., 1873, A method of geometrical representation of the thermodynamic properties of
substances by means of surface. The collected works (Yale University Press, New Haven, CT - Vol. 1 published 1943).
Gyftopoulos, E.P., L. Lazaridis and T. Widmer, 1974, Potential fuel effectiveness in industry (Ballinger, Cambridge, MA).
Handbook of Chemistry and Physics, CRC, 49, page D-42. Keenan, J.H., 1932, Mechanical Engineering 54, 199. Keenan, J.H., 1941, Thermodynamics (Wiley, New York).
McGannon, H.E., 1971, The making, shaping and treating of steel, Ninth edition (U.S. Steel). Rant, Z., 1956, Forschung Ing.-Wesens 22, 36.
Sorensen, T.S., 1976, Acta Chem. Stand. A 30, 555.
Statistical Abstract of Sweden, 1984 (Offtcial statistics of Sweden, National Central Bureau of Statistics, Stockholm).
Statistical yearbook of agriculture, 1980 (Offtcial statistics of Sweden, National Central Bureau of Statistics, Stockholm).
Statistical yearbook of forestry, 1980 (Official statistics of Sweden, National Central Bureau of Statistics, Stockholm).
Sundell, J., 1980, Simulation model of heat pump system for single family dwellings (The Royal Institute of Technology, Stockholm).
Szargut, J., 1980, Energy, Vol. 5, 709718.
Thoma, J., 1977, Energy, entropy, and information, RM-77-32 (International Institute for Applied Systems Analysis (IIASA, Laxenburg).
Voigt, H., 1978, Evaluation of energy process through entropy and exergy, RM-78-60 (IIASA, Laxenberg).
Wall, G., 1977, Exergy - a useful concept within resource accounting, Report no. 77-42 (Institute of Theoretical Physics, Giiteborg).
Wall, G., 1983, Energy and exergy flows in industrial processes (Physical Resource Theory Group, Chalmers University of Technology and University of Giiteborg).