12
Kalmar ECO-TECH '05 andThe Second Baltic Symposium on Environmental Chemistry KALMAR, SWEDEN, November 28-30, 2005
HYDROLOGICAL ASPECTS OF AN
INDUSTRIAL LANDFILL
P"[[
t
e n.angsepp '
v··
Peter Dah/hlom
3 1University of Kalmar, Sweden
2 University of Tartu, Estonia.
3Kristianstad University, Sweden
ABSTRACT
A water balance for a landfill in the South-West of Sweden has been performed. The water balance is based on measured values of leachate and calculated values of potential evaporation using Penman's equation. The calculations include a period of 6 years (1995-200 I). During this period, the yearly precipitation was 6 I 0-1180 mm in the Halmstad area. It was concluded that the total storage of leachate in the landfill and in the ponds increased with time. If increasing tendency will proceed then the amount of leachate generated might be higher during the next years and similar to results found in the literature. There is a need for the more physical based model, the Hydrologic Evaluation of Landfill Performance (HELP) model, for calculation in order to take into account the top cover soils and vegetation influence.
KEYWORDS
Leachate; Water balance; Net precipitation; HELP model; Landfill; Industrial waste I INTRODUCTION
I.I Background
Although the policy of waste handling is changed towards more recycling, a large number of landfills will still exist in the future. Old landfills, used for disposal decades ago, contain a mix of different kinds of waste of different origin. The main objective in landfill hydrology is usually to predict leachate generation, but the presence and movement of water in a landfill also affect the degradation of the waste, the leaching of pollutants and the geotechnical stability of the fill [!]. Understanding landfill hydrology is important for handling of the generated leachate from the landfill.
Many of the old landfills were located in places less suitable and their design was not always made with concern of the generation of leachate. The main environmental problem is the potential risk of groundwater pollution and subsequent influence on surface water quality. The concentration and the composition of a contaminant in water are dependent on the composition of the waste contained in the landfill and the degradation of the waste. The total pollutant load to the environment is dependent on the quantity and the quality of the leachate.
Kalmar ECO-TECH '05 and
The Second Baltic Symposium on Environmental Chemistry KALMAR, SWEDEN, November 28-30, 2005
The insight of the problem with leachate has implicated a better and safer construction of landfills. In recent years landfills have commonly been provided with more or less water-tight materials in the bottom and a cover at the top when the deposition has been completed. Such measures aim at preventing water to reach the disposed waste and dissolve compounds contained in the waste or generated as a result of the degradation of the waste. As a complement to this insulation, dikes are often dug around the disposal either to control the groundwater surface in order prevent the groundwater to come into contact with the waste, or to collect and convey eventually contaminated water originating from the disposal. In many cases, a system of drainage conduits is installed at the bottom of the landfill in order to collect generated leachate. Collecting the contaminated water, the leachate, makes a treatment possible in order to avoid undesired impact on the environment and on the human health. Guidelines for the design of top covers on landfills under Swedish conditions are given [2], and principles for the collection of leachate are published [3].
l.2 Landfill hydrology
There are several methods and models for leachate production calculation available in the literature. Some models provide an estimation of landfill leachate production through the use of simple formulas that take into account only the main factors. e.g. water balance method as it has been represented [4). Other models, such as the Hydrologic Evaluation of Landfill Performance (HELP) (5) and the Hydrologic Simulation of Solid Waste Disposal Sites (HSSWDS) [6) are more detailed, aiming to account for the greater complexity within the system. The HELP program uses climatic, soil and design data to generate daily estimates of water movement across, into, through and out of landfills [8]. The HELP model is the most widely used tool for the prediction of leachate quantities in landfills, and for the design of leachate control and management infrastructure [I].
1.3 Objective
The main objective is to make a simple water balance for an industrial landfill and investigate the possibilities to use the HELP model. Another objective is to study the influence of climatic variables and the impact of storage in the landfill and in the ponds. The development in leachate production over a longer time period is also of interest.
These calculations are important since the leachate quantity is primarily governed by the rainfall and evaporation [7]. In addition, the necessity of installing a weather station in the landfill area, collection of daily and weekly data is discussed. The data needed for running of the HELP model are briefly discussed.
2 METHODOLOGY 2.1 Site description
The field measurements in this study were made at a landfill near the coast in the southern part of Sweden. The content of the landfill consist of non-recyclable parts from a scrapping industry recycling of old vehicles and household machines. It consists of cable scrap, rubber, foam, plastics and textiles. The land filling began in the 1970s, and today an area of about 170,000 m2 is occupied, of which 24,000 m2 is currently in use. This means that 146,000 m2
of the landfill is covered and 24,000 m2 is uncovered. The cover is vegetated by grass. A
newer part of the landfill has a bottom liner and a drainage system, but it does not exist at the older part of the landfill. The landfill is surrounded by ditches that collect runoff water. An external ditch has been dug around the landfill to prevent groundwater inflow to the disposal.
Kalmar ECO-TECH '05 and
The Second Baltic Symposium on Environmental Chemistry KALMAR, SWEDEN, November 28-30, 2005
Runoff water and leachate are collected in three ponds, From the third pond the leachate is conveyed to the treatment system,
2.2 Collection of data
In order to study a longer period, meteorological data published by the Swedish meteorological and hydrological institute have been used [9], For the calculations, monthly values of precipitation and monthly mean values for the temperature from the station
"Halmstad" were used,
A local recording meteorological station (Vantage Pro) is installed at the site, The data registered by the station encompasses a period from august 2004 until today. A local climatic weather station can provide data with far better time resolution than available from SMHI and with better a representativity,
2.3 Water balance for landfills
A comprehensive equation for the water balance of a landfill (see equation 1) was proposed
[10, 1 1],
P+Qs +Qc +Qw = L+LG +t,V + E +t,M
(1)
where
P = precipitation over the landfill;
Q_1- = surface water flowing in to the landfill; QG = groundwater flowing in lo 1he landfill; Qw = waler from was1e;
L = leachate to treatment;
LG = leachate to groundwater;
t,V = chage in water content of !he was/e; E = evapotranspiration;
t,M = change in s/orage (i e ponds, groundwater etc).
An assumption was made that parameters such as leachate to groundwater, surface water and groundwater flowing into the landfill, water from waste and change water content of waste are neglible in this case. In general, the generation of leachate balance for a landfill is affected by precipitation, evaporation and change in the water content of the disposed material, the cover material and the ponds. Consequently, it can be confirmed that the infiltrated precipitation over the landfill is the dominant factor for the generation of leachate.
Kalmar ECO-TECH '05 and
The Second Baltic Symposium on Environmental Chemistry KALMAR, SWEDEN, November 28-30, 2005
2.4 Potential evaporation
The potential evaporation was calculated according to Penman's method [ 12) (see Equation 3), Tables published by [13, 14, 15, 16) were used for the computations,
E = H ,t:;,/(t:;, +r) +E,,,,d, y/(1':,, +r) (3)
where
H = potential evaporation due to net incoming radiation;
L1 = slope of the curve of saturated vapour pressure plotted against temperature; Evind = evaporation due to air movement;
y = hygrometric constant 0,49 mmHg/0C,
The net precipitation, defined as the difference between the prec1p1tation and the potential evaporation, was calculated as long as the precipitation exceeded the potential evaporation,
3 RESULTS
The amount of leachate led to the treatment plant, has been measured during the last decade, The result from these measurements can be seen in Figure J, There is a tendency that the amount of leachate, which needs to be treated, increases every year, The total landfill area, where landfilling has finished and landfill has a final top cover has also increased during the last decade, Leachate 25000 20000
m
15000i
10000 5000 01---1995 1996 1997 1998 1999 2000 2001 Years Figure ], Amount of leachate led to treatment plant,Kalmar ECO-TECH 'OS and
The Second Baltic Symposium on Environmental Chemistry KALMAR, SWEDEN, November 28-30, 2005
200 -- -
- - -
---�----- ---1
::�
1
:.:-140-g
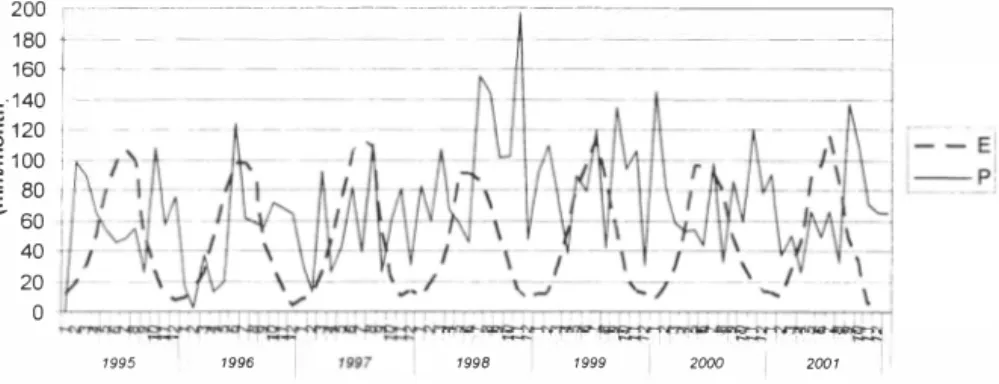
120 I E 100 ] 80 I - 60 40 20 0 1995 1996 199B 1999 2000 2001Figure 2. Precipilation (P) and calculated potential evaporation(£).
Figure 2 shows precipitation and evaporation calculated by Penman's equation for the period 1995-2001, It can be seen in Figure 2 that the precipitation exceeds the potential evaporation during the winters, especially in the year 1998.
The net precipitation, that is, the difference between measured precipitation and calculated potential evaporation has been regarded as the water available for percolation through the landfill, During periods when the potential evaporation exceeds the precipitation, the net precipitation has been set to zero, The net precipitation shall be compared to the amount of leachate generated. Figure 3 shows the principle illustrated by the situation in the year 1997, For the period 1995 - 200 I the net precipitation is shown in Figure 4.
120
100
:2 80
60
40
20
0
,�
'�p�-��
2
34
56 7
8
910
11
12
Months2001
Kalmar ECO-TECH ·05 and
The Second Baltic Symposium on Environmental Chemistry KALMAR. SWEDEN, November 28-30, 2005 :C- 180
g
160 +---� E 140 � 120 -; 100 80:§
·a.
60-�
40 Q. 20 0 1995 1996 1997 1998 1999 2000Figure 4. Net precipitation.
The net precipitation is zero in most years during one or several months in summer periods. Yearly values of precipitation and evaporation were calculated and put into simplified water balance equation (2). If net precipitation Pn=P-E is introduced into Equation 2, then this
becomes after re-arrangement
Pn = L + L1M. (4)
which is equal to
Pn-L = L1M (5)
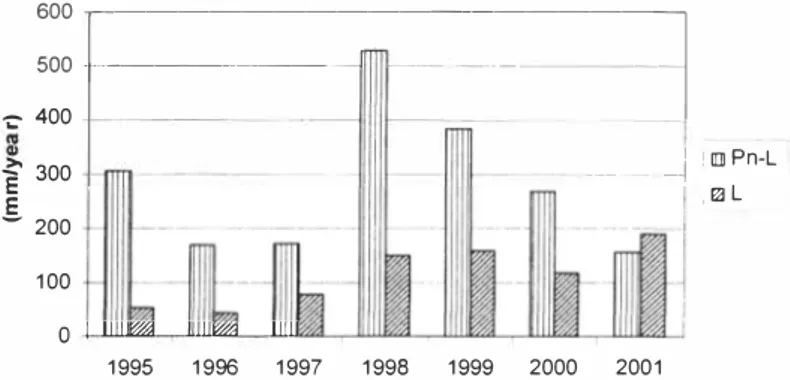
The comparison of storage per year (Pn - L) and the leachate directed to the treatment plant (L) is shown in Figure 5. The calculation shows (see Figure 5) that the total amount of water storage in the landfill and the ponds per year differs during the decade. The increment of the storage of water (f..M) in landfill and ponds decreases from 1998 to 200 1.
600 �--- �� -500
-·r---I
-- - ---j -;:- 400 -- � ! II] Pn-L-f
300 ,ml E - 200 100 0 I lllltw 11111w4 11111 1995 1996 1997 1998 1999 2000 2001Figure 5. Storage of leachate in the landfill and in the ponds (Pn -L = L1M), and the amount of leachate led to treatment (L) on a yearly basis.
Kalmar ECO-TECH '05 and
The Second Baltic Symposium on Environmental Chemistry KALMAR, S WEDEN, November 28-30, 2005 4 DISCUSSION AND CONCLUSIONS
The evaporation is affected by the thickness of the soil cover, the presence of vegetation [ 17] and heat generated from degrading waste [18]. In this work the impact of the storage capacity in the cover and in the waste on the evapotranspiration is not taken into account. In more physical based approach, this would be possible. Transpiration and interception can be at least twice as great as evaporation from the soil and in many cases the ratio is in excess of 1:3 [ 19], This implies that evapotranspiration will increase with time after the top cover of the landfill has been finished. Additionally, the type of vegetation on the top cover might influence the evapotranspiration rate.
During the period of 1995-200 I, the yearly precipitation was 610-1180 mm in the Halmstad area. This landfill area has a site in operation and a closed part with top cover and vegetatation. Yearly outflow from the ponds to treatment plant was between 40-190 mm. There is some flow equalisation in the ponds. Evaporation in the pond may be introduced a difference between the amounts of leachate produced and the measured amount leachate led to treatment. However, the importance of variation of flow is probably minor since yearly values have been used.
A literature review was made [20] and it was found that for sites in southern and middle Sweden annual leachate production is about 300 mm per year for a site in operation and about 200 mm per year for a closed site with cover and vegetation, In the south-west of England, a yearly precipitation is about 700 mm [21], It was found that 39 per cent of the precipitation generated leachate from landfills with vegetation and without vegetation the corresponding value was 55 per cent [21 ]. Covered landfills, 22 sites, located in different parts of Sweden were investigated [22]. It was found that between 5 and 80 per cent of the precipitation occurred as leachate. In the present study the measured leachate increesed from 7 to 25 % of the total precipitation from year 1995 to 2001. This is less than published by [21], but similar as presented in [22). However, if the increasing tendency will proceed then the amount of leachate generated might be higher during the next years and similar to results found in the literature. It was found that water may accumulate in landfills during at least ten years, so that the generation of leachate commonly is less than the difference between the precipitation and the evaporation {23].
In this study the monthly precipitations values from January to December were summarised in order to obtain yearly values. During cold periods the precipitation is accumulated as snow. This implies that the evaporation is low during these periods and the infiltration into top cover soil or landfill might not happen during the same year but following year when the snowmelt starts. This "error" could be avoided by using for example hydrologic years from October to September. Moreover, in this study the water balance was made on monthly bases. If daily or weekly values had been used then the storm events and their affects would be more visible. 5 FURTHER STUDIES
Several models exist to predict the quantity of leachate provided that data are available describing the physics of the landfill and preferably local meteorological data (7). One year of collected data from the local climatic station makes it possible to perform simulations on a daily bases. For example, this helps to evaluate the storm events and their affects on the amount of leachate generated and on the leachate treatment.
Kalmar ECO-TECH
·os
andThe Second Baltic Symposium on Environmental Chem istry
KALMAR, S WEDEN, November 28-30, 2005
An application of the HELP model was reported by among others, (24]. Recently, the HELP model was applied (25] to simulate leachate generation from uncovered landfill cells. The future intension is to use the physically based HELP model together with collected data with good time resolution in order to achieve a better understanding of the hydrological processes at the landfill site. In addition to weather (climatic) data there is a need to put in soil and design data. For example, soil moisture storage, unsaturated vertical drainage and various types of cover soils and vegetation can be taken into account, as well as waste with different properties.
ACKNOWLEDGEMENTS
The authors acknowledge the financial support of the Knowledge Foundation and Stena Gotthard AB in Sweden.
REFERENCES
[ I] Kjeldsen, P., Beaven, R., 2005. Landfilling: Hydrology. Solid Waste Technology and Management course handouts. Technical University of Denmarka. DTU 2005. 3 1 p. [2] Lundgren, T., 1995. Sluttackning av avfallsupplag, krav, material, utforande och
kontroll. Naturvardsverket Rapport 4474. 99 p.
[3] Lindmark, P., Elander, P., 1994. Lakvatten fran avfallsupplag, uppsamling och minimering. Naturvardsverket Rapport 4385. 70 p.
[4] Hogland, W., 1997 . Landfilling. AFR-kompendium 6. Stockholm. 202. p.
[5] Schroeder, P.R., Gibson, A. C.&Smolen, M.D., 1984. The Hydrologic Evaluation of Landfill Performance (HELP) Model. User's Guide for Version I, EPA/530-SW-84-009, I, Washington, D.C.U.S. EPA, Office of solid waste and emergency response. [6] Perrier, R.R., Gibson, A.C., 19 8 1. Hydrologic simulation on solid waste disposal sites.
Cincinnanati, Environmental Protection Agency. Report, EPA-530/SW-868.
[7] Christensen, T.H., Kjeldsen, P., 1995. Landfill emissions and environmental impact: an introduction . . In: T.H. Christensen, R. Cossu, and K. Stegmann (eds.): Sardinia 95. Proceedings of the Fifth International Landfill Symposium. CISA, Cagliari, Italy. [8] Schroeder, P.R., Dozier, T.S., Zappi, P.A., McEnroe, B.M., Sjostrom, J.W., Peyton.
R.L., I 994. The Hydro logic Evaluation of Landfill Performance (HELP) Model; Engineering Documentation for Version 3. US Environmental Protection Agency Risk Reduction Engineering Laboratory, Cincinnati, OHIO. 120 p.
[9] Swedish Meteorological Hydrological Institute, SMHI, 1995-2002. Vader och vatten. Norrkoping (in Swedish).
[I OJ RVF, 1996. Lokal lakvattenbehandling en vagledning for lakvatten fran kommunala avfallsupplag. RVF Rapport 96:4, Svenska renhallningsverksforeningen. 57 p.
[ 1 1) Hogland, W., Thomeby, L., Mathiasson, L., 2003. Water budget for a landfill leachate treatment system. In: Proceedings of the Ninth International Waste Management and Landfill Symposium, 6- 10 October 2003, Cagliari, Sardinia, Italy.
( 12] Penman, H.L., 1948. Natural evaporation from open water, bare soil and grass. ProcaRoy.Soc. A 193, 120- 145.
[ 13] McCulloch, J.S.G., 1965. Tables for the Rapid Computation of the Penman Estimate of Evaporation. East African Agricultural and Forestry Journal. Jan 1965, 286-295. [ 14] Shaw, E.M., I 994. Hydrology in Practice. Third edition. Chapman & Hall. London. 569
p.
[ I 5] United Nations (F AO), 1977. Crop Water Requirements. Food and Agriculture Organization, Irrigation and Drainage Paper 24. 144 p.
Kalmar ECO-TECH '05 and
The Second Baltic Symposium on Environmental Chemistry KAL MAR, SWEDEN, November 28-30, 2005
(1 6) Ministery of Agriculture, Fisheries and Food (MAFF), I 967. Potential Transpiration. Tech.Bull. 16., HMSO.
[1 7) Matti, E .. 1985. Okning av avdunstning pa avfallsupplag. Bahandling af perkolat fra lossepladser - seminar in Copenhagen I O - 1 1 october I 984, Nordiska ministerradet, ambetsmannakommitten for miljoskyddsfragor. 1985:6, 40-46.
[ I 8) Bendz, D., Bengtsson, L., I 996. Evaporation from an active uncovered landfill. J Hydr 182, 143-155.
[ I 9) WARD, R.C., 1975. Principles of Hydrology. Second Edition. Mc Graw Hill Book company (UK) Ltd, Maidenhead. 367 p.
[20] Hasselgren, K., Nilsson, P., 1991. Lakvattenbehandling, lokala metoder for behandling av lakvatten fran avfallsupplag. Naturvardsverket rapport 4052.
[2 I] Newton. J.R., 19 77. Pilot scale studies of the leaching of industrial wastes in simulated landfills. Warer Pol/urion Conrroll 76, 468-480.
[22) Kulander, K.E., 1991. Lakvatten fran avfallsdeponier, Utvardering av analysresultat fran lakvattenkontroll I 9 75 -I 985. Naturvardsverket rapport 3760.
[23] Bengtsson, L., Bendz, D., Hogland, W., Rosqvist, H., Akesson, M., 1994. Water balance for landfills of di fferent age. J Hydr 158, 203-217.
[24) Peyton , L.R., Schroeder, P.R., 1988. Field verification of HELP model for landfills. ASCE J Env Eng 114(2), 247-269.
[25) Marques, M., Hogland, W., 2003. Hydrological performance of MSW incineration residues ans MSW co-disposed with sludge in full-scale cells. Wasre Managemenr 23, 469-48a1.