Kalmar ECO-TECH '07 KALMAR, SWEDEN, November 26-28, 2007
ASSESSMENT OF PERFORMANCE
CHARACTERISTICS OF SOME CONSTRUCTED
WETLANDS IN NEPAL
1Dr. V. Krishna Murthy*
2Dr. Sanjay Nath Khanal
2Ahmad Kamruzzaman Majumder
2Aharon Weiss
1Deepika Shrestha
2Shovana Maharjan
1PES Institute of Technology, Bangalore, India
2Kathmandu University, Kathmandu, Nepal
ABSTRACTSurface water pollution is one of the serious environmental problems in urban centers of Nepal due to the discharge of untreated wastewater. Almost all conventional type wastewater plants are not functioning well and practically not sustainable due to lack of regular maintenance and high operation cost. To overcome this, Constructed Wetland (CW) technology for wastewater treatment arises as alternative technology in Nepal. Now, there are 12 sub-surface flow CW systems in operation all over the country.
This study aims to checking the efficiency and performance evaluation of three CW located at various locations in Nepal. The performance evaluation was conducted through collection of wastewater samples from inlet and outlet sources of treatment plants and measuring significant water qualities determining physical and chemical parameters such as Biochemical Oxygen Demand (BOD), Chemical Oxygen Demand (COD), Hydrogen ion concentration (pH), Conductivity, Phosphorus, Total Suspended Solids (TSS), Total Dissolved Solids (TDS) and Total Solids (TS).
The CW systems were found efficiently removing and reducing different pollution parameters. Performance of CW system were excellent for Kathmandu University (KU) and Malpi International School (Malpi) where the efficiency levels ranged between 82% to 96% for BOD, 68% to 85% for COD, 91 % to 99% for TSS, 60% to 83% for TDS and for TS 84% to 92%. The performance efficiency was relatively lower for Thimi Community Scale Wastewater Treatment Plant (Thimi) where the efficiency levels was 56% for BOD, 64% for COD, 17% for Conductivity, 88% for TSS, 59% for TDS and 80% for TS. The results show that, the CW systems are useful and efficient for waste water treatment in growing urban areas. They are cost effective and easy to maintain. It is recommended that CW system could be replicate in other growing urban areas.
KEYWORDS
Constructed wetland, performance, elimination rates.
I. INTRODUCTION
Scientists have investigated the possibility of using wetlands to remove nutrients and suspended solids from polluted water. The bulrushes, Schoenoplectus lacustris could remove large quantities of organic and inorganic substances from contaminated water. The wetlands herbs can also reduce the levels of bacteria in waste water by secreting natural antibiotic substances from their roots, and they can sequester heavy metals and eliminate hydrocarbons. The basic mechanism of organic matter degradation in constructed wetlands is plant bacterial symbiotic reactions, in which gaseous oxygen photosynthetically produced or taken up for respiration by the plant is used by aerobic and facultative bacteria [I].
The Constructed Wetland (CW) technology is relevant for wastewater treatment due to the tropical climate at most places which is conductive to the growth of the rhizosphere. Some of the reasons for the need of introducing CW systems in Nepal are that they are modular and can therefore be decentralized to even a single family level for sewage treatment; does not involve complicated mechanical components; does not demand high technical skill for operation and maintenance and construction uses locally available materials desirable for developing countries.
Constructed Wetland for treatment of wastewater was introduced in Nepal in I 997 from a Dhulikhel hospital. Now, there are 12 sub-surface flow constructed wetland systems in operation for treatment of gray water, wastewater and fecal sludge at household to institutional scale (hospital, university, school, monastery and staff quarter). The scale of treatment systems is from single household to institutions with more than 300 inhabitants. The government has decided to install CW system at 8 small cities for treatment of municipal wastewater under Urban Environment Improvement Program funded by Asian Development Bank.
2. OBJECTIVE
The study aimed at reviewing the status of CW and checking the efficiency of these plants in Kathmandu University (Dhulikhel), Malpi International School (Panauti), Community Scale Wastewater Treatment Plant (Sunga, Thimi). The performance evaluation was assessed through collection and analysis of wastewater samples that reflect clearance of pollutants from waste water.
Kalmar ECO-TECH '07 KALMAR, SWEDEN, November 26-28, 2007 Table 1: List of Constructed Wetland systems in Nepal
No. Location of CW
I, Dhulikhel Hospital, Dhulikhel Year 1997
2. Septage Treatment Plant, Kathmandu Metropolitan City, Teku 3, Grey water Recycling, Private house, Dallu
4, Malpi International School, Panauti
5, Sushma Koirala Memorial Plastic and Reconstructive Surgery Hospital, Sankhu
6, Kathmandu University, Dhulikhel
7, Middle Marsyangdi Hydro Electric Power Station Staff Quarter
1998 1998 2000 2000 200e1 2002 8, Recycling of wastewater from toilet and laboratory, EN PHO 2002
9, Grey water recycling, Private House, Kathmandu 2002
10, Kapan Monastery 2003
]I, Shuvatara School, Lamatar
12, Septage and Landfill Leachate Treatment Plant, Pokhara Not in operation 2004
The community based CWLs are:
I. Bagmati Area Sewage Construction/Rehabilitation Project (BASP), Gokarna 2. Madhyapur Thimi Municipality
3. Monohara Landpooling Area
3. MATERIAL AND METHODS
The reed bed (plant - Phragrnites Karka spp.) wastewater treatment units in Nepal consists of 3
12 sub-surface flow constructed wetland systems, with capacity ranging from 0.5 to 1 15 m /d
in operation for treatment wastewater eleven such units. The Wetlands have been constructed for the treatment of hospital wastewater, grey water and municipal wastewater.
3.1 Description of study areas
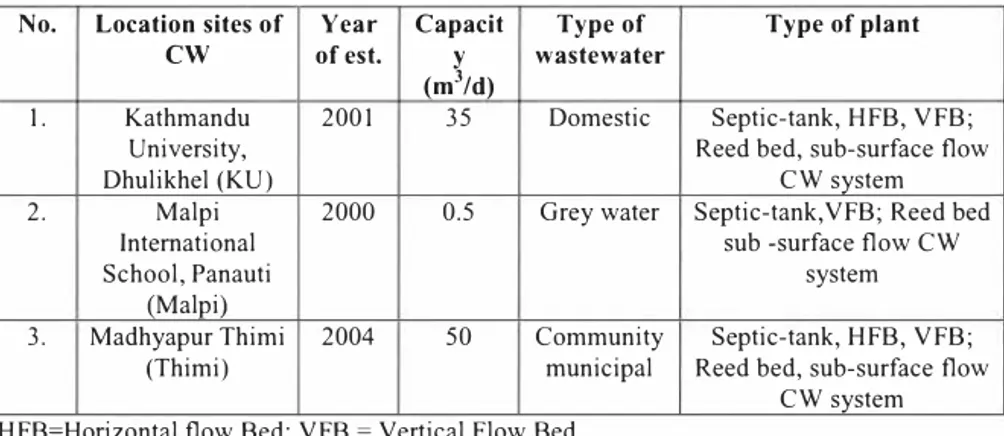
The study areas were located at Kathmandu University, Malpi international school, Panauti and Madhyapur Thimi municipality. Kathmandu University is located at Dhulikhel Municipality of Kavre District. The following table provides brief information about the CWs included for assessment,
Table 2: The CWLs included for the study No. I, Location sites of
cw
Kathmandu University, Dhulikhel (KU) Year of est. 2001 Capacit y (m3/d) 35 Type of wastewater Domestic Type of plant Septic-tank, HFB, VFB; Reed bed, sub-surface flowCW system
2, Malpi
International School, Panauti
(Malpi)
2000 0.5 Grey water Septic-tank,VFB; Reed bed
sub -surface flow CW system 3. Madhyapur Thimi 2004 50 Community Septic-tank, HFB, VFB;
(Thimi) municipal Reed bed, sub-surface flow
CW system
=
HFB=Horizontal flow Bed; VFB Vertical Flow Bed
The wastewater sample was collected from the inlet and outlet of each wastewater treatment plant and various physical and chemical parameters such as pH, conductivity, phosphorus, COD, BOD, TDS, and TSS were determined. The sample was collected two times (two different occasions) from each location to ensure the accuracy.
3.2 Water Sample Collection
The sample at different levels from the constructed wetland was taken and subjected for analysis. The samples were collected from the following sources within the treatment plant:
3.3 Inlet water sample
A common inlet to the treatment plant that exists at the beginning of the treatment plant was the source of collection of inlet water sample. The sampling point was near the inlet-feed pipe end which leads to the settlement tank of the constructed wetland treatment system. Inlet water sample therefore is the raw and untreated sample.
3.4 Outlet water sample
The outlet water sample was collected from the tank where the water after undergoing full treatment through the Vertical Flow Bed (VFB). This water finally is drained out of the plant into the general environment.
There were in all two water samples, collected in the manner explained above from the field. The samples were transferred to the laboratory and preserved till taken up for the chemical analysis.
3.5 Time of water sample collection
The time of water sample collection was during peak periods, representing maximal flow into the system. It was in the morning hours, between 7 to 8 AM, collected from all three sites.
Kalmar ECO-TECH '07
KALMAR, SWEDEN, November 26-28, 2007
3.6 Analysis of waste water
The water quality parameters were assessed by select tests, The procedures followed were according to the prescribed standard tests [2],
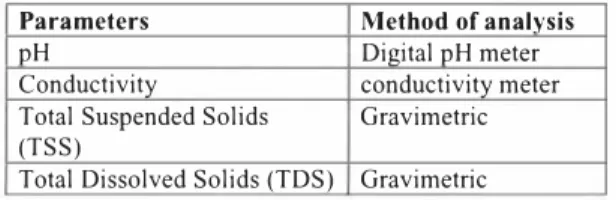
Table 3: The physical water quality parameters
Parameters Method of analysis
pH Digital pH meter
Conductivity conductivity meter Total Suspended Solids
(TSS) Gravimetric
Total Dissolved Solids (TDS) Gravimetric Table 4: The chemical water quality parameters
Parameters Method of analysis
Chemical Oxygen Demand (COD) Open reflux method
Biological Oxygen Demand (BOD5) Winkler Method, 5 day incubation
Phosphorus Spectrophotometric method
3.7 pH
pH was measured with the help of calibrated digital pH meter. A small quantity of mixed water sample was taken in the labeled beaker. A calibrated pH meter was taken and the electrode-sensor of the pH meter was dipped into the water sample and the reading was noted down, The electrode-sensor was washed with the distilled water, two to three times each time before it was dipped in the different sample, Care was taken to take pH measurements soon after collection of sample, to simulate condition of temperature as prevailed when the sample flowed through the constructed wetland.
3.8 Conductivity
The conductivity measurements of samples were taken using digital conductivity meter. The instrument was set on ms/m and the probe was dipped in the respective sample and the reading was recorded, The instrument had a range which could be fixed to have result in two and three digits; in three digits value the instrument measures up to 999µ/cm and if the value was higher than I 000 then it could be set on ms/cm mode.
3.9 Total Suspended Solids (TSS)
TSS was estimated by gravimetric method. The weighing, filtration and evaporation processes are involved in this process, Required volume of sample (50 cm3) was filtered through a pre
weighed of filter paper (Whatman No. I). The filtrate so obtained was used for estimating Total Dissolved Solid (TDS). The solid residue settled on the filter paper was subjected to the drying in an hot-air oven at a temperature of 70e° C for 24 hours, consequently the residue
along with filter paper was cooled to room temperature in a desiccators, and the final weight of the filter paper was taken. The difference between the final and the initial weight gave the amount of suspended solid in mg/I of the volume water sample taken.
3.10 Total Dissolved Solid (TDS)
This represents the total amount of solids dissolved in the sample, The estimation of TDS was by gravimetric method. In this, filtrate was subjected for heating and full evaporation of water sample taken in pre-weighed porcelain crucible. The crucible was kept for 24 hours in hot air oven maintained at I 05 ° e; after ensuring full evaporation the crucible was cooled to laboratory temperature and weighed. The difference between the weights was the estimate of TDS expressed as mg/L single pan digital balance (four digits after decimal) was used for all measurements.
TDS
=
(Inittal \-\'eight - final weight) X 1000 + Volume of sample in liter3.11 Chemical Oxygen Demand (COD)
COD was estimate by open reflux, volumetric titration method, based on the chemical oxidation of material (chemical constituents present in wastewater sample) by potassium dichromate (K2Cr207), A measured volume of water sample for the treated water and a reduced volume for the polluted water were taken in the conical flask and the required chemical reagents like mercuric iodide, potassium dichromate and concentrated sulfuric acid were added to it as prescribed in the standard procedure. The reaction mixture was subjected to heating with the dilution by distilled water and then cooling at room temperature. After cooling, the sample was mixed with reagents and titrated with standard Ferrous Ammonium Sulfate (FAS) taken in burette and the reading was noted and the calculation was done using the following formula:
COD (mg/l)
=
(B -5) X N X 8 X 1000 + 1/olume of sample in literWhere, B is the volume of FAS used for blank titration, S is the volume of FAS consumed by sample, and N is the normality of FAS.
3.12 Biochemical Oxygen Demand (BOD)
BOD, an indicator for the pollution level of water and is calculated by the measurement of oxygen consumption by the microorganisms present in waste water. BOD is measured once on the day of collection (8001) and also at the end of 5th day for the same sample (8005). The wastewater sample was diluted with the distilled water by suitable dilution factor ( 1-5% for raw and settled waste water) for a required volume in a beaker and I ml of each reagents like manganese sulfate, ferric chloride, calcium chloride and phosphate buffer reagents per liter were required for the dilution. The water in the beaker was stirred using glass rod for the aeration process for sometime. Afterwards the same water was poured in two cleaned sterile BOD bottles (300 ml BOD bottles) and closed with a glass cork. The water level in a bottle was made full so that there was no air bubble trapped inside the bottle, One bottle is kept for the BOD, phase (for analyzing on same day of collection of water sample) and other is kept in BOD incubator at 20 ° C and taken up for analysis after five days,
For estimating 8001 sample, I ml of manganese sulfate and alkaline iodide azide were added and then kept for 15 minutes. After the precipitate was dissolved, concentrated sulfuric acid was added, About 50 ml of sample was taken in a conical flask and 2 ml of starch were added. The sample was then titrated with standard 0.025 N sodium thiosulfate (Na2S203) and burette
reading was noted.
DO (mg/I)= 1/olume of Na2S203 X N(Na2:S203) X 8 X 1000 + Volume of sample taken for titration
Kalmar ECO-TECH '07 KALMAR, SWEDEN, November 26-28, 2007
For BOD5, the sample was taken after five days from the incubator and similar procedure was followed as in case of BOD1 • Reading was taken and the calculation was done with the same
formula as used for the BOD1 .
Calculation of BOD was done by:
BOD (mg/I)= D01 -DOS X Dilution factor 3.13 Phosphorus
Phosphorus was estimated by colorimetric determination of dissolved orthophosphate. The separation of phosphorus into its various forms is defined analytically but the analytical differentiations have been selected so that they may be used for interpretive purposes. Ammonium molybdate and potassium antimony! tartrate react in acidic media with orthophosphate to fonn a heteropoly acid-phosphomolybdic acid. This is reduced to intensely coloured molybdenum blue by ascorbic acid.
The level of phosphorus was deduced from a standard calibration graph. The standard phosphate solution in varying concentration I 0, 25, 50, 75, I 00 ppm was prepared. Color developed and absorbance was measured at the wavelength of 880 nm in the spectrophotometer. Based on this calibration graph, the sample concentration was calculated. The same graph was used for all sample phosphorus analyses.
3.14 Precautionary Measure
During sampling some precautions were taken like the collection of samples were done in the peak hours of waste water production, so that it represented the maximum polluted level as well as optimal functioning of the constructed wetland.
The physical parameters like pH and conductivity were measured in the field. To avoid the deviation in the analysis, all the parameters were tested on the same day of sample collection
(although for some parameters the final reading was taken next day). The BOD5 testing was
after 5 days of the incubation period of sample preserved in BOD incubator, maintaining the
temperature. For some tests which were not performed on the same day, the samples were preserved in refrigerator.
4 RESULTS AND DISCUSSION
The water sample collected from inlet and outlet of various wastewater treatment plants were subjected to different kinds of tests. The results obtained from these tests were discussed in the following paragraphs.
4.1 pH
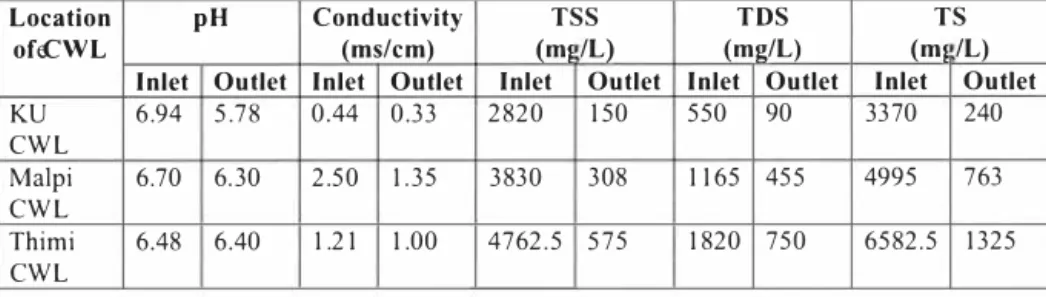
The average pH value for outlet is less than pH for inlet for each site, although the difference was less with respect to the Thimi CW plant. However, both inlet and outlet water sample seem to be little acidic. The pH decrease shows that the denitrification and nitrification processes are occurring well within the treatment plant. The high value of pH of inlet wastewater could be due to presence of detergent and other constituents. The treatment plants are effective in decreasing pH, since there is a decrease in the levels of pH observed between the raw inlet water to the treated outlet water.
455
575
Table 5: Average pH value of inlet and outlet wastewater of CWL treatment plants TS pH Conductivity TSS TDS Location (m1 /L) (ms/cm) (m1 /L) (mg/L) ofeCWL Inlet Outlet Outlet
Inlet Outlet Inlet Outlet Inlet Outlet Inlet
90 3370 240 6.94 5.78 0.44 0.33 2820 150 550 KU CWL Malpi 6.70 6.30 2.50 1.35 3830 308 1165 4995 763 CWL Thimi 6.48 6.40 1.21 1.00 4762,5 1820 750 6582,5 1325 CWL
A maximal reduction difference of pH was observed at KU CWL and hence it can be inferred that this treatment plant among others is functioning well.
4.2 Conductivity
There was a decreasing trend in the average conductivity levels observed between the outlet and inlet wastewater samples tested among the difference CWs. Thus the average conductivity value for outlet was less than conductivity for inlet for each site. The conductivity in the water depends upon the ions in the solution, so higher conductivity in the water indicate, higher number of total ions (charged particle species) and thus more polluted. The conductivity of the water sample from outlet of KU was less than other sites and Malpi CW plant showed highest degree of conductivity. Mal pi plant also showed highest degree of reduction in conductivity. As wastewater flows through the settling tank, HFB and YFB, the ion concentration in the wastewater decreases gradually, ultimately supplying the ion free water to the outlet. The result indicates that there was a decrease in conductivity after the water got treated through the CW,
4.3 Total Solid (Total Suspended + Total Dissolved)
From the water sample collected from various sites, TSS, TDS and TS were estimated. The following table presents results.
Kalmar ECO-TECH '07
KALMAR, SWEDEN, November 26-28, 2007
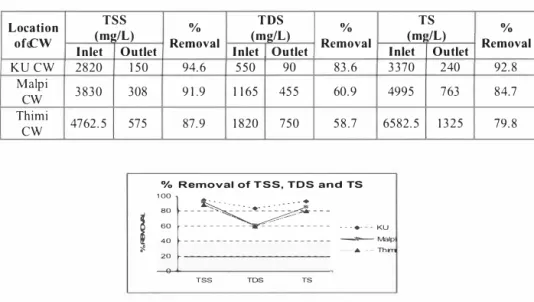
Table 6: The TSS, TDS and TS levels of inlet and outlet wastewater for three CWL treatment plants
TSS TDS
Location (mp-/L) % (mg/L)
ofeCW Inlet Outlet Removal Inlet
KU CW 2820 150 94.6 550 Malpi 3830 308 9 1.9 1 165
cw
Thimi 4762.5 575 87.9 1820cw
Outlet 90 455 750 % Removal 83.6 TS (m1 /L) Inlet Outlet 3370 240 % Removal 92.8 60.9 4995 763 84.7 58.7 6582.5 1325 79.8 % Removal of TSS, TDS and TSI ':]:::��::: ...
· KU � : : : : : : : : : : : : : : : : : : : : : : : : --:----: ';:'P : TSS TI)S TSFigure J : Percent removal efficiency of TSS, TDS and TSS
A maximal average TSS was observed in the inlet wastewater sample from Thimi CWL plant. Similarly maximal TDS and TS were also observed from Thimi plant. The treatment plant at Thimi received wastewater from larger area including all kinds of households, and small scale factories However, the clearance rate was relatively lesser percentage compared to corresponding levels of these parameters noted from other plants. The performance in terms of clearance rate indicates the following inferences:
(i) KU CW plant showed highest removal rate of all the three parameters namely TSS, TDS and TS and hence its overall efficiency was high.
(ii) The order of CWs according to reduction of TSS, TDS and TS were: KU>Malpi>Thimi.
It is relevant to indicate that CW Ls rated capacity of thimi plant as highest among the other CWs. Viewed with this fact, al l the CWLs were associated with good pollutant clearance rates. A clearance range of 87.9 to 94.6 % observed in this study with respect to TSS is comparable to the previous reported range of 82.2 to 99.4% from of seven constructed wet lands in Nepal [3].
4.4 BOD
The results are presented in the following table relates to the BOD estimation from wastewater samples from three CWs. From all three sites, it was found that the BOD level with respect to the inlet wastewater is more than that of the outlet samples. COD level for outlet in Thimi was found to be the highest which may be due to high concentration of inorganic as well as organic constituents in the wastewater.
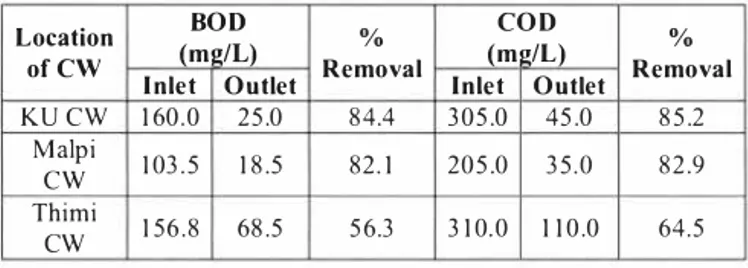
Table 7: The BOD and COD levels of inlet and outlet wastewater for three CWL treatment plants
BOD COD
Location (m!!/L) % (m2/L)
of CW Inlet Outlet Removal Inlet Outlet KU CW 160,0 25,0 84,4 305,0 45,0 Malpi 103.5 18.5 82. 1 205.0 35.0
cw
Thimi 1 10.0 156.8 68.5 56.3 3 10.0cw
% Removal 85,2 82.9 64.5Regarding the clearance or reduction rates the KU CWL and Malpi CWL could be compared and the hence the efficiency was almost similar. However the Thimi CWL was associated with relatively lesser clearance rates with respect to BOD and COD quality parameters. The oxygen required for decomposition of the organic contents in wastewater by the microorganisms is supplied through diffusion and intennittent feeding mechanism of the root system. When the oxygen supply is checked the degradation process is interfered thereby decreasing the BOD removal efficiency of the plant so, it may be stated that least BOD removal efficiency of wastewater treatment plant in Thimi could be due to the higher volume of wastewater containing higher amount of organic load but limited amount of dissolved oxygen available for the complete degradation of organic load by microorganisms. The lesser rate of efficiency could be attributed to the larger capacity of the plant, community municipal sewage being associated with complex mixture of contaminant-load at a higher rate and also relatively low level of maintenance of the plant [ 4].
The efficiency removal rates of BOD and COD according to the CWL treatment plants is also shown in the following figures:
E ffic i e n c y fo r B O D re m o v a l
E ffi c iency fo r C O D removal
90 80 100 -70 60 .! 40 so ■ E ffic i e n c y for 8 0 0
,e
30■
E ffic iency 20 10 0K U Malpi T h i m i K U Malpi Th1mi
Fig 2: BOD and COD removal efficiency rates
4.5 Phosphorus
Phosphorus is an integral component of all detergents and soaps. It is also a constituent of fertilizers. The phosphorus levels of inlet and outlet water samples according to the CW Ls are shown in the following table. Although reduction in levels was observed, the degree of
� �
Kalmar ECO-TECH '07
KALMAR, SWEDEN, November 26-28, 2007
reduction with respect to this contaminant was not appreciable. The percentage removal with respect to Malpi CW was better compared to KU and Thimi CWs.
Table 8: Phosphorus removal efficiency according to the CWs
PHOSPHeORUS
Location (mg/L) %
ofeCW Inlet Outlet Removal
KUeCW 0.93 0.90 2.7
Malpi 1.04 0.98 5.2
cw
Thimi 0.96 0.93 2.5
cw
The phosphorus content removal efficiency for all the wastewater treatment, plant was found to be very less. The phosphorus is retained in wetland by precipitation with Ca, Al and Fe. However, the material used as substrate for CWs usually do not contain enough concentration of these element and therefore, removal of this nutrient is quite low. Also, plants absorb Phosphorus through their roots and transport it to the growing tissues. The uptake capacity of phosphorus in the macrophytes is lower as compared to nitrogen as phosphorus concentration in plant tissues is much lower than that of Nitrogen. This could be few of the reasons why phosphorus content in outlet was not so much different from that in inlet.
A previous study also reported lower clearance levels with respect to nitrogen and phosphorus when compared to other water quality parameters like BOD, COD [5]. The efficiency with respect to phosphorus reduction is shown in the following figure.
phosphorus
� 4
+---3 +--- ■ pho5µhoru�
KU Malp1 Tlwni
Fig 3: Ejficiency of phosphorus removal of three sites
5 CONCLUSIONS
Constructed Wetlands are an appropriate technology for Nepal. Although this technology is not the over-all answer for the present wastewater problem, it is sufficient for peri-urban and rural areas.
Nepal is characterized by an extreme topography. Therefore it is economically impossible to construct long sewer lines for the centralized treatment of wastewater. Decentralized waste water treatment plants, like the Constructed Wetlands, are more economic. Land is always expensive in agricultural regions like the Kathmandu Valley, but compared to conventional wastewater treatment plants and sewer costs in it is still an economically reasonable decision to set up a Constructed Wetlands. Furthermore, it is a simple technology that does not need much attention and know-how to operate it properly.
ACKNOWLEDGEMENT
Authors express grateful thanks to the faculty staff members and Prof. Sanjay Nath Khanal, Head, Department of Environmental Science and Engineering and administrative staff of Kathmandu University for extending support of laboratory facilities. The authors also express sincere thanks to Prof K.N. Balasubramanya Murthy, Principal, PES Institute of Technology and the management for extending support and encouragement. The cooperation of Prof Y.S. Chakravarthi, Head, Department of Science and Humanities, PESIT, is gratefully acknowledged.
REFERENCES
[I] Polprasert, C., Khatiwada, N. R.e, Bhurtel, J., 1998. A Design Model for COD Removal in Constructed Wetlands Based on Biofilm Activity. J. Env. Engg., Div., ASCE. 124 (9): pp. 838-843,
[2] American Public Health Association (APHA), 199 1. Standard Methods for the 17th
Examination of Water and Wastewater Edition. American Public Health Association (APHA), Washington D.C. pp. 4/ 139-4/142, 5/2-5/ 18.
[3] Shrestha, R.R., Harber! R., Laber, J, Manandhar R., and Mader J, 2000. Application of Constructed Wetlands for Wastewater Treatment in Nepal, Wat. Sci. Tech., 44 ( 11-12), pp. 375-380.
(4] Aharon Weiss, 2006. Rehabilitation of constructed wetlands in Nepal, In; Diploma-thesis, Institute for Technologies in the Tropics, University of Applied Science, Cologne, Germany.
[5] Sista, K. R., Kathiwada, N., 2000. Performance study on reed bed wastewater treatment units in Nepal, Department of Water Supply and Sewerage (DWSS), Kathmandu,