November 2007
EDR 07-24
Department of Agricultural and Resource Economics, Fort Collins, CO 80523-1172
http://dare.colostate.edu/pubsExecutive Summary
Colorado’s agritourism sector appears to be growing in terms of its economic contribution at the state level. This fact sheet explores the economic role of agritour-ism industries in Colorado; estimates the impact of visitors to Colorado’s agricultural, food and heritage enterprises; and projects how these visits contribute to Colorado communities. The results presented herein are based on a survey of visitors’ interest and participa-tion in agritourism in Colorado during the 2005 and 2006 travel years.
The tourism industry is an economic driver for rural communities across the U.S. In Colorado, 23 counties outside of the Denver metro area had more than 1,000 jobs in tourism in 2005 and, in 7 non-metro counties, more than 40% of all jobs were in travel and tourism.
Twenty-three percent of 1,003 visitors to and around Colorado during the 2005-2006 travel year reported that agritourism was a primary or secon-dary reason for their trip. The impact of their visits was widely distributed across the state—they reported participating in agritourism in 45 of Colorado’s 64 counties.
Nearly 1/5 of the travelers surveyed participated in agritourism activities more than 3 times per year. Fifty-six percent of these frequent agritourism visi-tors were Colorado residents.
An estimated 13.2 million visitors engaged in some agritourism in 2006, spending approximately $1.26 billion. Of these:
○
Agritourism was the primary trip focus for 4.1 million visitors who reported spending $807 million, including:1.9 million in-state visitors 2.2 million out-of-state visitors
○
Unplanned agritourism added 6.7 million visitors who spent $189 million during their trips, including:5.4 million in-state visitors 1.3 million out-of-state visitors Out-of-state visitors spent nearly 80% of the total $1.26 billion, or $986 million, on agritourism-related trips. Two-thirds of these expenditures were made by visitors whose primary trip focus was agritourism.
THE 2006 ECONOMIC CONTRIBUTION OF AGRITOURISM TO COLORADO: ESTIMATES FROM A SURVEY OF COLORADO TOURISTS 1
Dawn Thilmany,2 Martha Sullins3 and Alex Ansteth2
1 The authors wish to acknowledge support for this study from the Colorado Department of Agriculture and the Colorado Ag Experiment Station. State
funds for this project were matched with Federal funds under the Federal-State Marketing Improvement Program of the Agricultural Marketing Service, U.S. Department of Agriculture. Additional funding was provided under a Western Region Sustainable Agriculture Research and Education Professional Development Program grant.
Using the multiplier estimated through the recrea-tional/leisure sector of Colorado’s IMPLAN economic model (478), the total economic impact is projected at $2.2 billion, including indirect and induced effects. This equates to 14% of tourism’s total economic contribution to the Colorado econ-omy.
Agritourism generated an estimated 14,665 jobs in 2006; equivalent to 7% of all the state’s jobs in tourism.
INTRODUCTION
A growing segment of the travel and tourism industry, agritourism has become more visible in the Intermoun-tain West over the past two decades. Travelers are increasingly interested in including agritourism experi-ences into their travel plans, and producers and their communities view agritourism enterprises as a chance to increase economic activity for their operations and local economies. Agritourism is any activity, event, and/or service related to agriculture that connects consumers with the heritage, natural resource, or culi-nary experience that they value and will pay for. There are three general classifications of agritourism activi-ties: on farm/ranch activities, food-based activities, and heritage activities. Wherever these activities occur, be it at a farm, rodeo or farmer’s market, all provide many
positive influences like education, outreach and eco-nomic development.
In 2002, 867 Colorado farm and ranch businesses (nearly 10% of all farms and ranches) in 59 counties derived some income from recreational sources, con-tributing 11% to total farm income for producers, and a state total of over $12 million (US Census of Agricul-ture). Farm- and ranch-level economic activity from agritourism is higher in Colorado than in other states in the intermountain West, where the income derived from agritourism averaged about 7%. Furthermore, in 11 Colorado counties, income from recreation-oriented enterprises provided more than half of all farm-related income in 2002.
Overview of Survey Findings: Travel Behavior, Re-gional Findings and Popular Activities
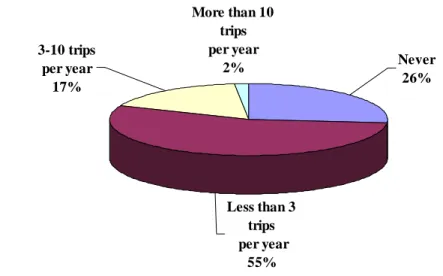
A survey of travelers to and within Colorado was con-ducted in early 2007 to assess total visitation, inci-dence of agritourism participation, and categories of expenditures, based on a sample of Coloradans and nearby metro area residents in 3 states (Arizona, New Mexico and Utah). Out of 1,003 total respondents, 246 reported that agritourism was a primary or secondary reason for their trip to Colorado. The majority took three or fewer trips per year that included agritourism activities, with 26% reporting no such trips (Figure 1).
Less than 3 trips per year 55% 3-10 trips per year 17% More than 10 trips per year 2% Never 26%
On the other hand, nearly 1/5 of all respondents reported that they participated in agritourism activities more than 3 times per year, indicating a relevant target market for the state, as well as for farm and ranch enterprises. Fifty-six percent of these frequent agri-tourism visitors were Colorado residents.
Overall, our survey respondents visited 45 of the state’s 64 counties for agritourism. However, 10 of the coun-ties that received no agritourism-related visits during 2005-2006 lie in the eastern part of the state, revealing the need to improve marketing of this region’s tourism opportunities. The Denver metro region, the Central Mountains and Northern Colorado (home to Rocky Mountain National Park) saw the greatest numbers of agritourism visitors, while the Central Mountain and West Slope regions attracted visitors who stayed the longest (more than 5 days on average). The greatest participation in agritourism activities occurred in Northern Colorado, the Southwest and the South Cen-tral areas of the state.
Most of the activities in which Colorado travelers reported participating were on-farm (68%), with them majority of those being educational and nature-based experiences. Culinary activities ranked second at 20%, and heritage activities ranked third (13%). Agritourists participated in more culinary-oriented activities on the West Slope and in the Central Mountains than in other regions of Colorado, likely due to the emerging wine sector. The Northern Colorado region saw the greatest number of participants in on-farm activities (79%), while the Eastern Plains attracted the most visits to heritage sites (50% of all visits to the
regions).
Who are Colorado’s Agritourists?
The average traveler’s age was 46; similar to heritage travelers in Colorado, but a little older than the average leisure traveler (Colorado Tourism Office, 2005). In-state travelers (Colorado residents traveling to another region of the state)made up 42.5% of the sur-vey’s agritourism participants (185 travel parties, or 617 total travelers), while out-of-state travelers made up 57.5% (250 travel parties or 837 total travelers). The average travel party was approximately 3 per-sons—similar to the state average for overnight leisure travelers (CTO, 2005).
Overall, 35% of all travelers surveyed earned $75,000 per year or above, while 18% earned under $30,000 per
had incomes over $75,000 per year, compared to 30% of all out-of-state agritourists. These income ranges indicate that agritourism offers a wide variety of activi-ties around Colorado for travelers of different income levels and, given the greater distance that some out-of-state visitors must travel, Colorado still offers afford-able agriculturally-based experiences.
Although resident agritourists averaged nearly 8 trips around Colorado during 2005 and 2006, they stayed for about 4 days on average, compared to out-of-state agri-tourists who made only 2 trips to Colorado, but stayed for nearly 6 days on each trip. This difference in trip length and frequency is reflected in total expenditures where out-of-state agritourists spent an average of $887 per trip, 2.3 times the average of $391 per trip spent by in-state agritourists.
Sixty-three percent of all agritourism trips were associ-ated with a leisure vacation, while 26% occurred during a trip to visit friends and family. More than half of all out-state agritourism trips (52%) were unplanned, com-pared to 36% for in-state agritourists.
To better understand patterns in travel planning and behavior among agritourism visitors to and within Colorado, we used a cluster analysis to identify groups of travelers with similar characteristics. These clusters serve two purposes: 1) they can be used to target mar-keting plans and promotional strategies for specific travel segments; and 2) they may allow producers, communities or the state to target growth in certain clusters’ visitation or expenditures as a way to grow or forecast future economic activity in the agritourism sector.
Respondents who had visited Colorado in 2005 or 2006 were grouped into five different traveler segments:
Cluster Total number Percent of sample Out-of-State Activity Seekers 34 4 In-State Explorers 267 30
Loyal Colorado
Enthusi-asts 121 13
Accidental Tourists 324 36
1. Ninety-seven percent of Out-of-State Activity
Seekers are out-of-state travelers. They are mid- to
upper-middle class travelers who fly in, rent a car and stay mainly in hotels or with friends and family. They tend to take longer trips and spend the most (an aver-age of $1,279 per trip), primarily on lodging. Although their primary travel focus is not agritourism, 2/3 do report participating in unplanned activities, especially in culinary events.
2. In-State Explorers are primarily Colorado residents (62%). They tend to tour in their cars for more fre-quent (over 4 times a year), shorter trips (perhaps long weekends), but spend only half as much as the Out-of-State Activity Seekers per trip. They tend to stay in hotels, resorts, or with friends and family. Twelve percent of In-State Explorers make agritourism their trip focus, while another 25% make unplanned visits to farms, ranches and culinary events.
3. Loyal Colorado Enthusiasts are primarily leisure travelers from within the state (66% are residents). This group offers some of the greatest potential for growth in the agritourism sector: all individuals in this cluster participate in agritourism; 58% planned trips specifically for agritourism; they engage in the most activities per trip (more than 3); and they make more agritourism visits relative to two years earlier. While 2/3 are Coloradan parents or couples who plan to return often (98% plan to visit again), this cluster also contains large numbers of out-of-state visitors who frequent farms and ranches during the summer (80% of whom indicated they will travel to Colorado during 2007). Since these travelers tend to camp or stay with friends and family, they spend less than each cluster at $512 per trip, except the Accidental Tourists. How-ever, the Loyal Colorado Enthusiasts indicated that 10% of their purchases were on local products, which is likely to have a larger marginal impact for the agri-cultural and other local businesses. Lastly, 25% of all trips made by the in-state members of this cluster are during the fall (and 15% by out-of-state members dur-ing this period), indicatdur-ing good market potential for further extending tourism into a period when there is typically decreased visitation.
4. Accidental Tourists come to Colorado for non-recreational business, educational, or convention activities. In short, they are not seeking agritourism
activities and, consequently, a low share of their agri-tourism-related activities take place in Colorado. Indi-viduals in this group are only in the state for a few days, with small windows of leisure-time (for which they may not have planned), and they may look for activities to occupy their free time. However, these activities need to be local, well-promoted and easily accessed due to the limited amount of time these trav-elers spend in-state.
5. Family Ag Adventurers are among the most promis-ing agritourism visitor segments. This segment plans their travels around specific agritourism outings and also participates in unplanned activities several times per year. Although these travelers are middle income, they look at their trips as investments in leisure and typically spend $783 per trip, second only in amount to the Out-of-State Activity Seekers. Most often they travel with children and are willing to visit a variety of agritourism destinations both locally, as well those at longer distances.
Results of Economic Contribution Analysis The data used for this analysis integrate the various elements that comprise an industry’s contribution to the economy (direct sales, money spent by those whose in-puts and labor are purchased, and allied activities). Details of the analysis are in Appendix 1, but important elements of the analysis are presented here.
Table 1 shows that expenditures on agritourism vary by type of traveler. Overall, out-of-state visitors to rado spent 2.3 times more on their trips than did Colo-rado residents ($887 compared to $391).
Figures 2 a & b show how those expenditures were made by traveler type and category and, although there are many similarities, Table 1 highlights that the level of outlays were significantly different among in-state and out-of-state respondents.
Direct Contributions
Visitors to Colorado who listed agritourism activities as part of their travel plans spent approximately $1.26 bil-lion on their trips. Of these outlays, $986 milbil-lion (almost 80%) was spent by out-of-state visitors, and nearly 2/3 of all expenditures ($808 million) were made by those who noted that agritourism activities were their primary trip focus.
Indirect Contributions
We used primary data from Colorado, and IMPLAN ware and data to conduct the economic contribution analysis. IMPLAN is based on linkages between spe-cific economic relationships. The categorization of economic activity calculated by IMPLAN can be sum-marized in these three areas:
•
Direct effect refers to the production changeassoci-is the initial impact to the economy, which associ-is ex-ogenous to the model.
•
Indirect effect refers to the secondary impact caused by changing input needs of directly affected industries (e.g., additional input purchases to pro-duce additional output).•
Induced effect is caused by changes in household spending due to the additional employment gener-ated by the impacts of the direct and indirectef-Total expenditures ($) Total expenditures per day ($)
Mean SD Mean SD
Out-of-state 887.36* 1,332.09 157.01* 207.53 In-state 393.11* 710.37 114.40* 153.21
Total 677.51 1136.97 138.92 187.40
Table 1: Colorado Traveler Expenditures-2005/06
Colorado Tourists
Lodging 40% Dining 22% Gas/auto 15% Gifts/toys 4% Groceries & Liquor 7% Local Goods 8% Entrance Fees 4%Out of State Tourists
Lodging 38% Dining 23% Local Goods 8% Groceries & Liquor 8% Gifts/toys 5% Gas/auto 15% Entrance Fees 3%
Figures 2 a&b: Expenditures of Colorado Visitors who Participated in Agritourism
Industry Output Employ-ment Employee Compensa-tion Proprietor Income Other Prop-erty Income Sales Taxes Total Value Added Agritourism Operations $1,262.27 14,665 workers $3.72 $58.89 $283.99 $103.81 $818.58
Table 2: Colorado Agritourism Sector Output, Employment, and Value Added Note: Significantly different at a 95% confidence level.
When a business expands or contracts, there is a ripple effect through the economy. For example, when an agritourism enterprise expands, the manager buys more equipment or hires more workers. This new economic activity generates even more activity in related busi-nesses who sell to the operation and in turn, buy more inputs and hire more labor. The total impact of a change by one industry therefore is multiplied through the economy through various linkages to other businesses and payments to their workers. To capture this effect, it is necessary to use an economic model that contains these linkages, but it is virtually impossible to fully de-termine linkages through an entire economy using sur-veys.
In addition to the direct revenues generated by agritour-ism operators, the industry generates indirect revenues for other industries such as restaurants, graphic artists, and real estate professionals. This increased demand has an effect on the suppliers of these intermediate goods. This is called the indirect effect of an industry. Together the direct, indirect and induced effects combine to calculate the industry’s multiplier and the composite of these effects constitutes the total eco-nomic contribution of an industry. The multiplier cal-culated for the agritourism industry was 1.22 (Table 3). Therefore, the industry is estimated to generate about $2.2 billion dollars in economic activity in Colorado during 2006, but this figure still doesn’t account for affiliated activities such as tourism.
WHAT IS THE ECONOMIC IMPACT? So far these results have been presented in terms of agritourism’s economic contribution, which includes all the entrance fees and local product sales associated with agritourism visitors, other trip expenditures (for those travelers who noted that agritourism was their primary trip focus) and how that money cycles through the economy. It was found that the total economic con-tribution of the agritourism sector was $2.2 billion
dollars. The true economic impact of an industry is generally much smaller than its contribution, because an impact accounts only for the marginal gain in eco-nomic activity that the industry adds to the economy, over what would likely be present if the industry did not exist. It is often also presented as the marginal gain or loss to regional economic activity due to an ex-pansion or contraction of that industry.
Although many people report contributions as impacts, they should be viewed separately. For example, if some Boulder residents did not visit and buy from a Boulder winery, they might redirect the money they spent there to another activity or purchase. Therefore, it is likely that the entire amount they spent at the win-ery would not be lost from the local economy. Con-versely, expenditures by non-locals who came to Boul-der to visit the winery are consiBoul-dered new dollars to the economy and are counted as true impacts, which is one reason why it is important to measure impacts in the tourism sector. Thus, when reporting an industry con-tribution, it is appropriate to include expenditures from locals, but when presenting true impact numbers, local expenditures must be scaled back to account for poten-tial substitute spending.
In the case of agritourism, however, it can be argued that visits by locals and travelers are both impactful. If there were no farm-based recreational choices in Colo-rado, people would probably visit other regions to find those recreation choices or participate in activities with more economic “leakage,” where the money would then go to out-of-area owners and industries (for instance, the movie industry). People would likely still spend approximately the same amount on recreational activi-ties, but they would spend that money in ways that may have a relatively lower economic impact within Colo-rado. Thus, Colorado’s agritourism industry represents import substitution, and a large share of the industry’s output can be considered an economic impact to the state’s economy. Direct Effects Indirect Ef-fects Induced Ef-fects Type I Multi-plier Type II Multi-plier Agritourism Operations 1.00 0.164 0.058 1.164 1.22
Table 3: Economic Output Multipliers for Colorado's Agritourism Sector
Appendix 1
Methodology for Economic Impact Estimation The 2007 agritourism survey asked Colorado visitors about their recent trips to Colorado, whether they par-ticipated in agritourism activities, and how much they spent on their travels within the state. These numbers were then used, in combination with Colorado Tourism Office estimates of visitation and the shares of our sam-ple that fell into various categories, to conduct an eco-nomic impact analysis.
1. As a lowest common denominator we calculated the direct economic activity for several subgroups. We decided to make the direct outlays a function of total stay since this best represents the average expenditure for a travel party, per trip, in each of the categories. However, this can easily be
changed to a per day estimate. Traveler expenditure estimates are presented in Table 1 of the fact sheet. 2. The visitor categories are in Table 4.
3. In the second stage, we expanded the traveler/party number to a broad representation of all agritourism travelers using survey data and Colorado Tourism Office numbers.
a. We found that 898 out of the 1003 respondents (90%) had visited Colorado (or a region in Colo-rado in which they do not live) in 2005 or 2006 and, of those, 435 had participated in an agritour-ism activity (48.5%).
b. Using the visitation shares for each of the six cate-gories (in the table above) and scaling their re-ported expenditures, we arrived at the following estimates per visitor category (Table 5).
Trip purpose in terms of agritourism
Share of travelers from
agritourism survey Trip expenditures included in impact analysis In-state Out-of-state
Primary 24% 12% 100%
Secondary 6% 10% 50%
Unplanned 17% 29%
Only outlays at agritourism operation, such as entrance fees & local good purchases
Visitor category Estimated number of travelers Total expenditure/stay($)
Out-of-state Primary 2,221,940 579,900,200 Secondary 1,807,680 235,891,607 Unplanned 5,385,380 170,716,546 In-state Primary 1,926,309 228,384,363 Secondary 486,621 28,847,040 Unplanned 1,338,006 18,531,383
Table 4: Visitor Categories and Travel Shares
c. There is concern that the only out-of-state respondents in the sample were from three adjacent states’ metro areas (Arizona, New Mexico and Utah), but according to CTO 65% come from this area general geographic area, so this sample represents the super-majority. Furthermore, those from farther away would likely spend more during their trip to Colorado, implying that our economic impact estimate might be even higher than reported in this study.
Appendix 2:
Colorado Tourism Office Impact Estimation 2006 Travel Year
Assumptions:
1.
Data do not include day trips to or within the state (all data include overnight stays);2.
Travel included only when taken by those age 18 and over;3.
The immediate western regions of the U.S., con-sisting of the Mountain, West North Central and West South Central census divisions, continue to be the primary source of travelers to Colorado (in 2006, 2/3 of all overnight leisure trips originated in the region); and4. Thirty-one percent of all trips by overnight lei-sure visitors came from within Colorado itself in 2006.
I. Three major market segments and estimated spending, per person per day, for 2006:
1.
business travel- an average of $1102.
marketable leisure visitor - $863. visiting friends or relatives - $49 per person (considered leisure but not marketable) II. Further leisure travel segmentation, 2006:
1.
skiers - an average of $140 each on a daily basis2.
people on city trips - $109 per person daily3.
special event attendees - $934.
touring vacationers - $955. outdoor vacationers - $65 on a daily basis (up from $55 per day in 2005)
III. Number of Visitors
a) 26.9 million domestic U.S. visitors came to Colorado on overnight trips in 2006, of whom 23.4 million were leisure overnight visitors
b) The numbers of visitors coming to Colorado in 2006 in each of the state’s core
“marketable” travel segments were as follows:
•
Touring trips - 2,440,000•
Outdoor trips - 2,800,000•
Special event trips - 1,770,000•
Ski trips - 1,780,000•
Combined business-pleasure trips - 1,440,000•
Casino - 620,000•
City trips - 880,000•
Country resort trips - 330,000c) The economic benefit generated by Colorado visitors in 2006 was $8.2 billion in direct spending
•
Colorado residents accounted for $1.3 billion or 15% of this total;•
Expenditures by tourists totaled $7.6 billion or 86% of the total;•
Business visitors totaled $1.3 billion;•
In 2006, $2.8 billion was spent in Denver (or nearly one in every three dollars), while the remainder benefited other regions of the state; and•
Cultural heritage visitors, numbering 4.8 million, spent $3.4 billion on their travels in the state, or 44% of all leisure travel expenditures in 2006d) Expenditures by category for 2006:
•
Accommodations expenditures - $2.2 billion 4•
Transportation - $1.7 billion•
Restaurants - $2.1 billion•
Retail purchases - $1.5 billion•
Recreation sector - $1.3 billion (with ski-related activities and gaming accounting for 33% and 11% of all recreation spend-ing, respectively)4 CTO differentiates between people who stay in commercial accommodations (such as hotels, motels, resorts, inns and
B&Bs) and those who stay in private homes, vacation properties and campgrounds as they find the former typically spend more on their trips than other visitors.
Sources:
Department of Local Affairs, State Demography Office. 2005. Base analysis data on tourism sector. Data retrieved June 2007 at:
http://www.dola.state.co.us/demog_webapps/ economic_base_analysis.
Longwoods International. 2006. Colorado Travel Year 2005. Study commissioned by the Colorado Tour-ism Office.
Longwoods International. 2007. Colorado Travel Year 2006. Study commissioned by the Colorado Tour-ism Office.
USDA National Agricultural Statistics Services. 2006. 2002 Census of Agriculture. Available online at: