School of Natural Sciences
Degree project work
Fadoua Aboubi
Subject: Environmental Science Level: Second cycle
Nr: 2011:M4
A cost effective and environmentally friendly stormwater
treatment method: the use of wood fly ash and H
2O
2i
A cost effective and environmentally friendly stormwater treatment method: the use of
wood fly ash and H2O2
Fadoua Aboubi
Environmental Science 240 credits
Degree project work, Environmental Science
15 Credits Master Of Science
Supervisor: Fabio Kaczala, PhD Student, Linnaeus University, Sweden
Examiner: Qing Zhao, Researcher, Linnaeus University , Sweden
Sponsors
ii
Abstract
This current study is a lab-scale investigation focused on the treatment of stormwater runoff generated in wood-storage areas. The main target constituents of the proposed treatment were: metals (Cu, Cd, Co, V, Pb, Zn, Ni, Cr, Fe, As), COD, TOC, Phenols, and color. The method implemented for this project follows the main concept of using low-cost and environmental friendly technologies and had as main steps the use of a by-product of wood-based industries - wood fly ashes as sorbents - followed by oxidation with H2O2 (Hydrogen Peroxide). The results
obtained during this investigation were vey promising since satisfactory removal % was achieved. Removal rates of 98.5%, 86%, 89.6%, 79.6% were achieved for color, chemical oxygen demand (COD), total organic carbon (TOC) and phenols respectively. Furthermore a decrease in metals concentrations was also observed with the exception of chromium. The study showed that for 300 ml storm water, optimum conditions were with 7g wood fly ash, 5 hours time reaction, pH11.46 and 150 µl of a 30% H2O2 solution in a room temperature. To conclude
it can be stated that the use of a by-product from wood industry to treat contaminated water from the same sector, following the concept of a closed-loop system, is promising and possible. However further studies need to be conducted in order to evaluate such system in scaled-up conditions.
iii
French summary
Ce projet est un stage qui s‟inscrit dans le cadre de ma formation en tant qu‟étudiante en échange ERASMUS en Suède à Linnaeus University, département de Sciences Naturelles.
L‟objectif de ce travail est de développer une méthode à bas coût et respectueuse de l‟environnement, pour le traitement des eaux pluviales générées dans les industries du bois. Les eaux pluviales de ces industries, sont caractérisées par une couleur foncée, une Demande Chimique en Oxygène (DCO )élevée et une
importante concentration en polluants chimiques. Des études ont montrée que cette eau est très toxique pour la nature et en particulier pour les poissons. Donc le principal objectif de ce travail, est de traiter cette eau de façon à pouvoir la décharger dans la mer baltique sans danger pour l‟environnement.
La méthode développée utilise des cendres volantes et H2O2 comme oxydant. Le
choix des cendre est dû au fait que ce produit est considéré comme un déchet par l‟industrie du bois. Donc l‟utilisation de cendre volante non seulement permet de valoriser un sous produit, mais aussi permet le développement d‟une méthode à très bas coût. En ce qui concerne H2O2, ce choix s„explique par le fait que H2O2
ne génère pas de sous produits et de ce fait, considéré par les
environnementalistes comme un produits respectueux de l‟environnement. La méthode à été implémentée et de très bons résultats ont été obtenus pour un rapport L/S= 48 ml/g. La couleur a été réduite de 98.5%, et les composés organiques de plus de 80% . En ce qui concerne les métaux, une réduction de 96.2% a été observée pour Fe, 66% pour le Cu, 41% pour V et 80% pour le Zn. Ce pendant, As, Cd, Co et Pb ont totalement été adsorbés par les cendres. Les seuls métaux pour lequel une augmentation de la concentration a été observée, sont le vanadium et le chrome. l‟environnement.
iv
Preface:
This project is a part of a master program in Environmental Science at Linnaeus University. This work was performed at ESEG lab, at School of Natural Science; Kalmar.
The study conducted is part of a large scientific project “Development of an Integrated Approach for Industrial Wastewater and Stormwater Management in the Wood-industry sector”.
The main aim of this project is to develop low cost and environmental friendly methods for the treatment of wastewater generated in wood industries. The project is sponsored by the KK-Foundation in cooperation with companies in wood sector.
The contribution of this study to the project is to investigate a cost effective and
environmental friendly method for stormwater treatment using fly ash and H2O2. Fly ash is a
by-product of the wood industry so; the reuse of such raw material to treat wastewater generated in wood industry would allow creating a closed loop. The use of fly ash allows developing a sustainable treatment method.
Acknowledgements
First, I would like to acknowledge Professor William Hogland for giving me the chance for being part of his research group during my stay in Sweden as ERASMUS Exchange student. It was a pleasure for me to work in his group and participate to events such as Linnaeus Ecotch‟10. He offered me the opportunity to expand my knowledge and discover research by working in this project.
A special thank to Fabio Kaczala, Qing Zhao and Thomas Jonsson for their support during my stay in Kalmar and for helping me for my project and studies.
I also would like to acknowledge Sawanya Laohaprapanon; Asim Ibrahim, Henric Svensson and Henrik Hanssonfor for their help and for answering my questions.
Finally, I thank KK-Foundation and the companies AB Gustaf Kähr, KalmarEnergi AB, AczoNobel and Becker Acroma AB for sponsoring this project.
1
Contents table
Abstract ii
French summary iii
Preface iv
Aknowledgements iv
1Introduction 2.
2 Materials and methods 3
2.1 Area of Study 3
2.2 Material and Analytical methods 3
2.3 First step of treatment: fly ash 5
2.3.1 Time optimization 5
2.3.2 Mass optimization 5.
2.3.3 pH optimization 5
2.4 Second step of treatment: oxidation 6
3. Results 6.
3.1 Time optimization .6
3.2 Fly ash mass optimization 11
3.3 pH optimization 15
3. 4 second step of the treatment: oxidation by H2O2 18
3.5 Metals analysis 22
3.5.1 Metals balance 22
Discussions 28
Conclusions 29
2
1 Introduction
Wood is an important natural source all over the world and it has been used in several industries as raw materials such as paper mills, sawmill, wood-floor industries, energy industries etc. In general, productions using wood in their processes store their raw material in outdoor areas. Consequently, when precipitation (rainfall and snow-melt) comes into contact with wood stored in outdoor areas, a contaminated stormwater runoff is generated. Other sources of runoff are irrigation of logs with water to protect them from cracking and biological attacks and application of water to dust and fight against fire (Hedmark et al; 2009). Despite the use of method such as climate controlled sprinkling that allows decreasing the sprinkling by 31 % to 97% within 24-h period (Hedmark et al; 2009) the volume of runoff generated because of irrigation remains high. Between May and September the amount of runoff generated in a medium log yard in central Sweden using climate-adapted sprinkling can be up to 70,000 m3 of runoff (Hedmark et al; 2009).
Runoff from wood industries is characterized by a low pH, high COD and a dark color. Storm water generated in such sites is discharged to the nature and downstream without any treatment. A study on the effect of wood waste on water quality and fish communities shows that runoff from wood-waste handling sites has a considerable impact not only on the water chemical composition but also on the aquatic life (Francis et al; 2007). Toxicity of wood runoff is due to the oxygen deficiency caused by the high COD and is related to the amount of organic compound in the water (Jonson et al; 2006). Therefore, a low-cost treatment method for runoff generated within wood storage areas is needed.
Within this study, a cost effective method using fly ash as adsorbent has been proposed and investigated. The use of a by-product that is generated from wood industries to treat storm water generated in the same industries allows the valorization of fly ashes that is considered as waste to be seen as a useful resource following then the concept of a sustainable closed-loop production.
The aim of the present study was to investigate the treatability of storm water generated in wood-chips storage area using fly ashes as sorbent material. A laboratory-scale study has been conducted on the effectiveness of wood fly ash on the reduction of color, COD, TOC, phenol and decrease of Cu, Cd, Co, V, Pb, Zn, Ni, Cr, Fe and As.
3
2 Material and method 2.1 – Area of Study
The total drainage area has approximately 6,000 m2. All ground area is covered by asphalt. The drainage
area includes parts of the pile of wood chips used by Kalmar Energi (Figure 1). The volume of wood chip changes every day and there is a big change in volume every season with the largest piles during the summer month. There is also transportation by trucks and wheel loaders in connection to the pile. The area is located in the southeastern part of Sweden and the region had an average annual precipitation of 595 mm according to data collected between 1984 and 2009 by the local municipality.
Figure 1: wood chips stored outdoor 2.2 Material and analytical methods
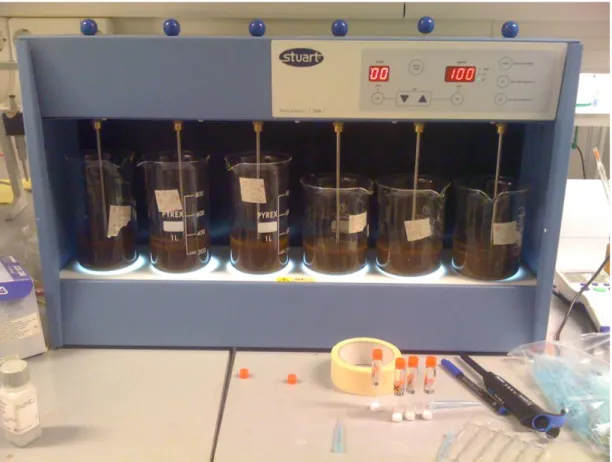
The treatability study was carried out in batch mode and all the reactions between stormwater collected in the field and the fly ashes were done in beakers that were kept under agitation speed of 100 rpm in room temperature (Figure 2). All experiments were made in duplicate.
4
Figure 2: Experimental set-up with fly-ashes and stormwater runoff
COD, TOC, Iron and phenols were analyzed with Dr. Lange curette tests LCK 114, LCK 380, LCK 320 and LCK 345/346 respectively. (Dr. Bruno Lange, GmbH & CO. KG, Dusseldorf, Germany) and measured with the spectrophotomer HACH DR 500. COD was measured by adding 2 mL of the sample to analyze. Before being able to measure the COD, the solution was kept in a thermostat (LT 100) at 148°C for 2h. TOC was measured after reaction of 2 ml of sample with the solution in the tube test and kept in the thermostat for 2h at 100°C. The phenol was measured by reacting 2 ml of sample with the solution in the tube test iron was measured by adding 2 ml of wastewater to the test tube. It was not necessary to heat the tubes before measuring phenol and iron concentrations in the samples.
Lange methods have been validated according to ISO 8466-1 (ISO, 1990), DIN 32645 (DIN, 1996) and DIN 38402 A51 (DIN, 1986) (Kaczala et al., 2010).
5
2.3 First step of treatment: fly ashes
The stormwater used for the study was collected from the wood-handling and storage site that belongs to Kalmar Energi Värme AB in Nybro. The Fly ashes has been collected from Kalmar Energi Värme AB an energy society using wood chips to produce heat.
In the table below is the composition of some metals in the fly ash used during the study.
Table 1: Some metals in the wood fly ash
Metal Fly ash composition (mg/kg
TS) Calcium Ca Potassium K Aluminium Al Arsenic As Cadmium Cd Cobalt Co. Copper Cu Nyickel Ni Lead Pb Vanadium V Zinc Zn Silicon Si Iron Fe Aluminum Al 273300 40500 15200 4.9 12 11 100 26 64 21 1700 50600 14200 15200
Fly ash used for the treatment has a very high concentration of calcium. This alkali metal is responsible of the pH increase when adding fly ash to the samples. The high concentration of Si, Fe can be explained by the presence of SiO2, Al2O3 and Fe2O3 the principal characteristic oxides in fly ash.
After reaction solutions were filtered using glass fiber filters. To make sure filtration doesn’t have any influence on the stormwater characteristics two samples; one after filtration and one without filtration were compared. The results were the same for all parameters (TOC, COD, Iron, Color and phenol).
2.3.1 Time optimization
300 ml of stormwater were poured into 6 beakers and 7g of ash were added to each of them. The beakers were kept under agitation and samples were taken in pre-determined intervals in order to evaluate the optimum time to achieve the highest treatment efficiency. Samples were taken in intervals of 0, 1, 2, 3, 4, 5 and 6 hours. Parameters analyzed were TOC, COD, Color ,phenols and metals.
2.3.2 Mass optimization
As soon as the optimum reaction time was obtained, batch tests were carried out in order to obtain the sorbent dose that would achieve the highest treatment performance during the optimum reaction time. 300 ml of stormwater have been putted in each of the nine beakers. Sorbent doses of 1, 2, 3, 4, 5, 6, 7, 8, and 9 g of ash were added to each of the samples. .
2.3.3 pH optimization
Following the time and mass optimization, an evaluation of the optimum pH was carried out. 7 g of ash have been added to 300 ml of stormwater. After addition of fly ash the pH was decreased using H2SO4. The
6 C o lo r (mg /l Pt)
2.4 Second step of treatment: oxidation
The idea of the current investigation was to investigate the use of oxidation processes as a final polishment of the effluent produced after the fly ashes step. This experiment was carried out by adding 7g of fly ash to 300 ml of stormwater in six beakers that were kept under agitation for 5 hours. In a sequence, the aqueous phase was filtered and further mixed together as a composite sample before adding H2O2.
The oxidation process was evaluated by using twelve BOD bottles filled with 100 mL of stormwater previously treated with fly ashes and different volumes of H2O2. The solutions were stirred for 1h with a
speed of 200 rpm. After agitation solutions were stored in the fridge for one day before measurements were made (COD was measured seven days after adding H2O2).
3. Results
3.1 Time optimization Color
Table 2: reaction time influence on stormwater color
Figure 3: color evolution versus reaction time
Time (h) Average (mg/l Pt) Evolution (%)
0 4200 0 1 440 89.5 2 405 90.4 3 361 91.4 4 312 92.6 5 270 93.6 6 270 93.6 Time (h)
7
COD
Table 3: reaction time influence on COD
Time (h) Average (mg/l) Evolution (%)
0 668 0 1 123 81.6 2 114 82.9 3 118 82.3 4 106 84.1 5 107 84.0 6 107 84.0
Figure 4: COD evolution versus time reaction
TOC
Table 4: reaction time influence on TOC
Time (h) Average (mg/l) Evolution (%) 0 371 0 1 53 85.7 2 44 88.1 3 48 87.1 4 46 87.6 5 48 87.1 6 41 89.0 Time (h) C O D ( mg /l )
8
Figure 5: TOC evolution versus reaction time
Iron
Table 5: reaction time influence on Fe
Figure 6: Iron evolution versus reaction time
Time (h) Average (mg/l) Evolution (%)
0 6,28 0 1 0,539 91.7 2 0,359 94.4 3 0,330 94.9 4 0,308 95.2 5 0,245 96.2 6 0,285 95.6 CO D (m g/l ) Ir on (m g/L) (m g/ l)( m g/ l) Time (h) Time (h)
9
In the stormwater sample, almost all the iron was soluble. The main form of the metal was Fe2+.The presence of such form of the metal in water is due to the low dissolved oxygen concentration in solution (Gray. 2008) and a low pH (4.88).
After treatment with fly ash an uptake of 96% is observed on the iron concentration. The decrease can be related to the precipitation of the metal because of the high pH in the solution.
The high concentration of iron can be one explanation for the color. A high concentration of the ferric ion in the water can lead to a reaction with tannin which makes the color turn inky black (Gray et al, 2008). Stormwater has an important concentration of tannin and lignin (930 mg/l) (Hedmark et al, 2008)
Phenol
Tableau 6: Phenol evolution with reaction time
Figure 7: Phenol evolution versus reaction time
Data confirm the effectiveness of the method on the most of the elements. A decrease of 93.6% is observed on the color (Figure 7) after treatment with 7g fly ash and 5-6 hours reaction time. An uptake of 84.0% occurs on COD; 87.0% on TOC, 95.6% on iron and 79.6% on phenol . However, the optimum values are gotten with 5 and 6 hours reaction time.
Time (h) Average (mg/l) Evolution (%)
0 9,50 0 1 1,72 81.9 2 1,79 81.5 3 1,83 80.7 4 2,24 76.4 5 2,01 78.8 6 1,94 79.6 Time (h) Ph en ol (m g/l )
10
More the solution is kept in contact with fly ash for long time better are the results; except for phenol for which a low increase is observed with a reaction time of 4, 5 and 6 hours. The improvement of results with contact time may due to the fact that organic compound were adsorbed by fly ash. More the reaction was kept under stirring for long time more the adsorption had time to happen.
However, the contact time doesn’t have much influence on the iron concentration. Such results are may be related to the decrease of the iron concentration because of the low pH in the solution and not because of the adsorption by fly ash. Since the pH is high from the beginning; the precipitation occurs in the first hours of the reaction time.
11
3.2 Fly ash mass optimization
Flay ash has a very high content of metals. The aim of the current optimization is to investigate the ratio L/S that has a positive effect on the parameters the study is aiming to decrease, without increasing the water’s metals concentration.
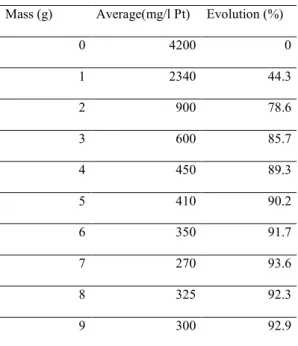
Color
Table 7: fly ash mass influence on the color
The color has a low value when using 7g fly ash compare to when using 8 and 9 g. This difference is due to the fact that the sample with 7 g was not made in the same time then others even if the samples’ volume and the fly ash mass were the same. However, the use of 7; 8 or 9 g leads almost to the same color removal
.
Figure 9: Color evolution versus fly ash mass
Data show that with 5 g fly ash, the reduction of color is less then 50% while with a mass of 7 g the reduction is 93.6% for the same reaction time. These results confirm that the reduction of the color is due to the adsorption of organic compounds by fly ash; particularly that the samples had almost the same pH (11.19 for the sample with 5g and 11.51for the sample with 7 g). Higher the amount of fly ash added better is the reduction for the color. However, almost same results are gotten with 8 and 9 g;. Therefore, the optimum
Mass (g) Average(mg/l Pt) Evolution (%)
0 4200 0 1 2340 44.3 2 900 78.6 3 600 85.7 4 450 89.3 5 410 90.2 6 350 91.7 7 270 93.6 8 325 92.3 9 300 92.9 Mass (g) Co lo r (m g/l Pt)
12
mass of fly ash is 7 g. This last mass is the minimum needed for the adsorption of the compounds that cause the dark color in the stormwater.
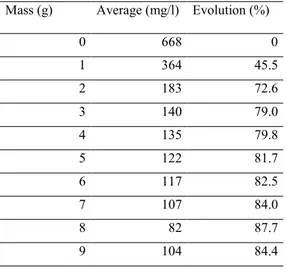
COD
Table 8: fly ash mass influence on COD
Mass (g) Average (mg/l) Evolution (%)
0 668 0 1 364 45.5 2 183 72.6 3 140 79.0 4 135 79.8 5 122 81.7 6 117 82.5 7 107 84.0 8 82 87.7 9 104 84.4
Figure 10: COD evolution versus fly ash mass
Phenol
Table 9: fly ash massinfluance on phenol
Mass (g) Average(ma/l) Evolution (%)
0 9,50 51.8 1 4,58 51.8 2 2,89 69.6 3 2,70 71.6 4 2,19 76.9 5 1,94 79.6 6 2,19 76.9 7 2,01 78.8 8 2,12 77.7 9 2,05 78.4 C O D ( mg /l ) Mass (g)
13
Figure 11: Phenol evolution versus fly mass ash
TOC
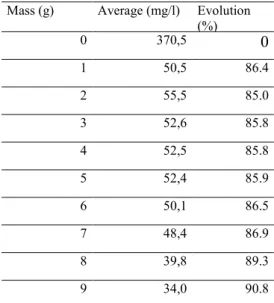
Table 10: fly ash mass influence on TOC
Mass (g) Average (mg/l) Evolution
(%) 0 370,5 0 1 50,5 86.4 2 55,5 85.0 3 52,6 85.8 4 52,5 85.8 5 52,4 85.9 6 50,1 86.5 7 48,4 86.9 8 39,8 89.3 9 34,0 90.8
Figure 12: TOC evolution versus fly ash mass
COD; TOC and phenol follow the same evolution as the color. These results confirm that the color is due to the presence of organic compounds in the stormwater.
Ph en ol (m g/l ) Mass (g) TOC ( mg /l ) Mass (g)
14
The uptake observed is due to the adsorption by fly ash; however it cannot be excluded that some organic compounds precipitate due to the high pH of the solution.
During the experiments, a precipitate appeared in the sample made with 1 g fly ash and 1 hour reaction time; 24 hours after the reaction was stopped. This precipitate is viscous and has a brown color. These characteristics let think that the precipitate is a precipitate of organic compounds. After this precipitate was formed, the water became clearer.
Iron
Table 11: fly ash mass influence on Fe concentration
Mass (g) Average (mg/l) Evolution (%) 0 6,28 0 1 1,245 80.9 2 0,551 91.5 3 0,500 92.3 4 0,358 94.5 5 0,300 95.4 6 0,268 95.9 5 0,273 95.8 8 0,234 96.4 9 0,220 96.6
The iron evolution is almost always the same except for the sample with 1 g fly ash. When adding only 1 g fly ash to the sample, the pH increases to a value of 9.80 while the iron start precipitating at a pH= 8. When the fly ash mass is higher then 1 g; the reduction is almost the same for all the samples. Thus, it can be concluded that the reduction of iron is due first to the pH increase that leads to the precipitation of the metal.
Figure 13: Iron evolution versus fly ash mass
It can be observed from data that the fly ash mass has an influence on the results. The color is around 93 % lower comparing to the sample without treatment. Such results are gotten with 7; 8 and 9 g fly ash. COD is 88% lower. A reduction of 87% to 91% is observed for TOC. Phenol and iron were respectively 76-79% and 92-97% lower after treatment with fly ash.
Ir on (m g/l ) Mass (g)
15
3.3 pH optimization
In this step of the experiments, pH was measured after adding 7 g of fly ash to 300 ml stormwater and 5 hours reaction time. After adding fly ash the pH increases very fast to stabilize at 11.3-11.7. A 65% H2SO4
solution was used to decrease the pH.
The increase of pH after adding fly ash to the sample; is the consequence of the following reaction (Li et al,1997).
CaO(s) + H2O(l) Ca(OH)2
Color
Table 12: pH influence on the color
Final pH Color (mg/l Pt) Evolution (%) 11,46 270 93.6 10,93 270 93.6 10,04 270 93.6 9,48 300 92.9 9,45 300 92.9 9,28 360 91.4
It was very difficult to decrease the pH in this experiment. After adding H2SO4 the pH was very low (4 to 6);
but few minute later it increased very fast. However, the table shows a small difference in the color for the sample with pH=11.46 and the sample with pH=9.28 for which the pH was decreased.
Figure 14: Color evolution versus fly ash mass
Co lo r (m g/l ) Final pH
16
COD
Table 13: pH influence on COD
Figure 15: COD evolution versus pH
Phenol
Table 14: pH influence on phenol
pH sample Phenol (mg/l) Evolution (%)
11,46 2,01 78.8 10,93 3,32 65.1 10,04 3,34 64.8 9,48 3,57 62.4 9,45 4,51 52.5 9,28 6,57 30.8
pH sample COD (mg/l) Evolution (%)
11,46 107 84.0 10,93 114 82.9 10,04 116 82.6 9,48 118 82.3 9,45 137 79.5 9,28 132 80.2 Final pH CO D (m g/l )
17
Figure 16: phenol evolution versus pH
These experiments show that the pH has a big influence on the reduction of phenol concentration in the stormwater. The phenol reduction is only 30.8% lower for a sample with a pH= 30.8 while with a pH= 11.46 it is 78.8% lower. The increase of phenol with the decrease of pH is may related to the fait that phenol precipitate when pH is high. Furthermore, when the pH is low; the solid surface is positive and as it knows phenol has a high electro-negativity. Therefore, at a low pH the adsorption should increase while it isn’t what the data show. Thus is can be concluded that the phenol’s decrease is due to the precipitation. However, to confirm this hypothesis it would be necessary to know the structure of phenol present in the solution.
Iron
Table 15: pH influence on Fe concentration
pH final Fe (mg/l) Evolution (%) 8,15 0,247 96.1 8,76 0,297 95.3 8,78 0,327 94.8 9,88 0,335 94.7 10,43 0,290 95.4 10,48 0,281 95.5 11,03 0,250 96.0 11,26 0,267 95.7 11,29 0,237 96.2 11,49 0,263 95.8 11,74 0,283 95.5 Pheno l ( mg /l ) Final pH
18
Figure 17: Iron evolution versus pH
As it could be seen from the data; pH decrease has a negative effect on the results. A decrease of 91.4 is observed on the color with pH=9.28 instead of 93.6% with pH=11.46. COD decreases with 80.2% instead of 84.0%; phenol with 30.8% instead of 78.8%. However, the pH decrease applied to the solution doesn’t have much influence on the iron concentration after treatment with fly ash.
The study of the pH influence let think that the color is due to presence of phenol. Tannin are polyphenolic compounds and the stormwater has a high concentration of iron; so the color is may the result of a complication of the tannin with iron.
3. 4 second step of the treatment: oxidation by H2O2
Stormwater was first treated with fly ash for 5 hours (7g fly ash in 300 ml of waste water) before adding H2O2. A 30 % solution of H2O2 was used for the experiments below. The use of such oxidant for this
treatment is due to the fact that H2O2 does not generate any by-product and therefore, does not have any
negative effect on the environment.
The use of H2O2 as oxidant has many advantages. An oxidation usin hydrogen peroxide is fast and the contaminates are converted to compounds such as H2O2, CO2, O2 and halide ions (Goi et al, 2009)
considered not harmful for the environment . Color
Table 16: H2O2 volume influence on the color
H2O2 volume (µl) Average (mg/l Pt) Evolution (%) 0 255 89.4 5 138 94.3 10 125 94.8 15 100 95.8 20 95 96.0 25 85 96.5 50 65 97.3 I ro n (m g/ l) Mass (g)
19
Figure 18: Color evolution versus H2O2 volume
COD
Table 17: H2O2 volume influence on COD
Figure 19: COD evolution versus H2O2 volume
H2O2 (µl) Average (mg/l) Evolution (%) 0 108 83.8 5 102 84.7 10 96 85.6 15 96 85.6 20 98 85.3 25 95 85.8 50 95 85.8 H2O2 volume (µl) C o lo r ( mg /l ) H2O2 volume CO D (m g/l )
20
TOC
Figure 20: TOC evolution versus H2O2 volume Phenol
Table 19: H2O2 volume influence on phenol
H2O2 (volume µl) Average (mg/l) Evolution (%) 0 46,4 87.5 5 42,0 88.7 10 37,9 89.8 15 30,1 91.9 20 37,0 90.0 25 41,8 88.7 50 35,0 90.6
Table 18: H2O2 volume influence on TOC
H2O2
volume (µl) Average (mg/l) Evolution (%)
0 2,01 78.8 5 1,61 83.1 10 1,93 79.7 15 1,87 80.3 20 2,15 77.4 25 2,00 79.0 50 1,94 79.6 TO C (m g/l ) H2O2 volume (µl)
21
Figure 21: phenol evolution versus H2O2 volume
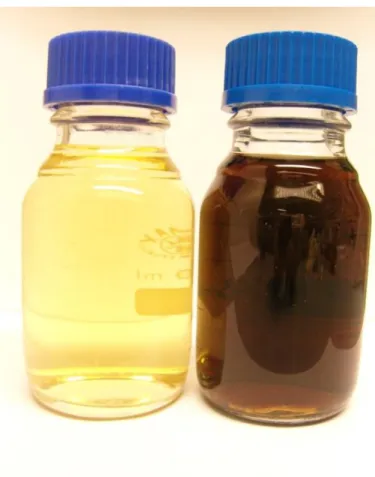
The optimum volume of H2O2 for color reduction is 50 µl. When adding 50 µl H2O2 to 100 ml sample
treated with fly ash a color reduction of 98.5% is observed instead of 94% after treatment with fly ash. Even if the reduction when adding H2O2 seems to be not high, however the variation can be seen (Figure 19).
COD, TOC and phenol don’t decrease much when adding H2O2. An uptake of 85,8 % is observed on the
COD instead of 83.8% after treatment with fly ash, 90.6% instead of 87.5% for phenol and 78.8% instead of 79.9% for phenol.
Figure 22: treatment with H2O2 H2O2 volume (µl) Pheno l ( mg /l ) 50 µl H2O2 25 µl H2O2 0 µl H2O2
22
3.5 Metals analysis
A mixture of two samples (50/50 v/v) made in the same conditions has been used for metals analyze.
The removal of heavy metals ions from aqueous solutions is the result of two main nechanisms; which are adsorption and precipitation. It has been reported in some studies that alkaline fly ash behave as a stabilizer or bindinfd reagent for the fixation of heavy metals and nutriants in wastewater (Alinnor et al, 2006)
3.5.1 Metals balance
To determine the real reduction of metals in the samples, leaching tests with fly ashes and tape water were carried out in the same conditions of reaction time and sorbent dose. It has been widely reported that fly ashes can release metals into the aqueous phase and in order to make a mass balance to achieve metal reduction %, leaching tests were necessary. The reduction % was calculated based on a mass balance equation: Initial concentrations= Metals in the leachate + Metals in the stormwater; Final concentrations: Metals in the stormwater after treatment
Sample 1
In the sample 1g fly ash has been added and the reactions were kept for 1 hour under stirring.
*Initial metals = Stormwater + Leachate; ** After treatment Table 20: evolution of metals concentration (%) in sample 1
Metal Stormwater (mg/l) (mg/l) Leachate (mg/l) M0* (mg/l) M** Mevolution (%) As 0,00071 <0,0005 0,00071 0,0011 55 Cd 0,00024 <0,0001 0,00024 0,002 733 Co 0,0011 <0,001 0,0011 0,0015 36 Cr 0,0043 0,0053 0,0096 0,0099 3 Cu 0,021 0,0037 0,0247 0,028 13 Ni 0,0062 <0,001 0,0062 0,0081 31 Pb 0,007 <0,0005 0,007 0,015 114 V 0,0041 0,0053 0,0094 0,0087 -7 Zn 0,064 <0.005 0,064 0,16 150
23
Figure 23: Metals variation (%) for sample 1
From the figure and table it observed that the concentration of all metals increases. The increase is even very high for some of the metals such as Cd. Cadmium concentration is 733% higher after 1 hour reaction. However, the only one metal concentration that decreases with 7% is Vanadium concentration. This increase is due to the fact that the fly ash mass is too low. The sorbent dose is not enough to allow the adsorption to happen. Insteat of having a adsorption it is a realize of metals that happen in the sample
Sample 2
The samples have been made with 300 ml solution (storm water or tape water), 4g fly ash and 1 hour reaction time.
Table 21: evolution of metal concentration (%) in sample 2 Metal Stormwater (mg/l) leachate (mg/l) (mg/l) M0 (mg/l) M M evolution (%) As 0,00071 <0.0005 0,00071 <0.0005 -100 Cd 0,00024 <0.0001 0,00024 0,00014 -42 Co 0,0011 <0.001 0,0011 <0.001 -100 Cr 0,0043 0,02 0,0243 0,02 -18 Cu 0,021 0,003 0,024 0,007 -71 Ni 0,0062 <0.001 0,0062 <0.001 -100 Pb 0,007 <0.0005 0,007 0,0015 -79 V 0,0041 0,0063 0,0104 0,0066 -37 Zn 0,064 0,0075 0,0715 0,032 -55 M ev ol utio n (%) Metals
24
Figure 24: Metals variation (%) for sample 2
Very good results are gotten with 1 hour reaction time and 4 g fly ash on metals concentration. All metals concentration decrease furthermore, As, Co and Ni are even under detection limit. Such results are confirmed with the figure above.
Sample 3
The samples were made by adding 7g fly ash to the water and kept under stirring for 1 hour. Table 22: evolution of metals concentration (%) in sample 3
M* stormwater (mg/l) leachate (mg/l) M0 M M evolution (%) As 0,00071 <0.0005 0,00071 <0.0005 -100 Cd 0,00024 <0.0001 0,00024 0,00012 -50 Co 0,0011 <0.001 0,0011 <0.001 -100 Cr 0,0043 0,034 0,0383 0,043 12 Cu 0,021 0,0014 0,0224 0,0049 -78 Ni 0,0062 <0.001 0,0062 0,0028 -55 Pb 0,007 <0.0005 0,007 0,00052 -93 V 0,0041 0,0043 0,0084 0,0059 -30 Zn 0,064 0,01 0,074 0,015 -80 M e tal e vo lu ti o n ( % ) Metals
25
Figure 25: metal evolution (%) in sample 3
A decrease is observed for all metals in sample 3 except for Cr. Despite the fact that a decrease of 12% is observed for chrome its concentration of 4.5 µl/l; is considered as low by the Swedish EPA (EPA: lakes and watercourse).
Sample 4
The reactions were kept under stirring for 5 hours after adding 1 g fly ash.
Figure 26: metals evolution (%) in sample 4
Table 23: evolution of metals concentration (%)in sample 4
M Stormwater (mg/l) leachate (mg/l) (mg/l) M0 (mg/l) M M evolution (%) As 0,00071 <0.0005 0,00071 0,00093 31 Cd 0,00024 <0.0001 0,00024 0,00021 -13 Co 0,0011 <0.001 0,0011 <0.001 -100 Cr 0,0043 0,007 0,0113 0,013 15 Cu 0,021 0,003 0,024 0,01 -58 Ni 0,0062 <0.001 0,0062 0,006 -3 Pb 0,007 <0.0005 0,007 0,0011 -84 V 0,0041 0,0078 0,0119 0,0078 -34 Zn 0,064 0,0052 0,0692 0,033 -52 M e tal e vo lu ti o n ( % ) Metals M e tal s e vo lu ti o n ( % ) Metals
26
The same mass was used for this sample as in the sample 1. However, is this case there is adsorption of metals but not in the first case.
This step of the study shows that fly ash has higher affinity for Co, Pb and Cu than for Zn, V, Cd and Ni. However, it has a very low affinity for As and Cr. The affinity of Cu and Pb with fly ash is confirmed by Wang (Wang et al 2007).
A concentration increase is observed for As and Cr. The concentration after treatment are respectively 0.93 µl/l and 13 µl/l for As and Cr. Arsenic concentration is considered as low (between 0.3 and 5 µl/l) by the Swedish EPA. However, chrome concentration is moderately high (EPA lakes and watercourses).
Sample 5
4 g of fly ash were added to 300 ml of water and kept under stiring for 5 hours.
Table 14: metals evolution (%) in sample 5
Figure 27: metals evolution (%) in sample 5
As it could be seen from this figure all metals concentrations decreased after 5 h reaction and treatment with 4 g of fly ash. The highest decreases of 100% is observed for As, Co, Cd, Ni and Pb.
Furthermore, the decrease is higher with a reaction time of 5 h than with only 1 hour (Figure 24). Higher the contact time is; better are the results.
M* stormwater leachate M0 M Mevolution
(%) As 0,00071 <0.0005 0,00071 <0.0005 -100 Cd 0,00024 <0.0001 0,00024 <0.0001 -100 Co 0,0011 <0.001 0,0011 <0.001 -100 Cr 0,0043 0,022 0,0263 0,022 -16 Cu 0,021 0,0043 0,0253 0,0052 -79 Ni 0,0062 <0.001 0,0062 <0,001 -100 Pb 0,007 <0.0005 0,007 <0,0005 -100 V 0,0041 0,0066 0,0107 0,0068 -36 Zn 0,064 0,0085 0,0725 0,0092 -87 M e tal s e vo lu ti o n ( % ) Metals
27
Sample 6
The parameters were 7g fly ash, 5hours reaction time and 300 ml of sample.
Table 25: metals evolution (%) in sample 6
M* stormwater leachate M0 M Mevoluti
on (%) As 0,00071 <0.0005 0,0007 1 <0.0005 -100 Cd 0,00024 <0.0001 0,0002 4 <0.0001 -100 Co 0,0011 <0.001 0,0011 <0.001 -100 Cr 0,0043 0,035 0,0393 0,051 30 Cu 0,021 0,0035 0,0245 0,0083 -66 Ni 0,0062 <0.001 0,0062 0,013 -100 Pb 0,007 <0.0005 0,007 <0.0005 -100 V 0,0041 0,0045 0,0086 0,0051 -41 Zn 0,064 0,029 0,093 0,019 -80
Figure 28: metals evolution (%) in sample 6
The decrease of As, Cd, Co, Ni and Pb is the same than in the sample 5. The uptake for V is higher in sample 6 (41% instead of 36%). However, the adsorption is lower for Cr, Cu and Zn when using 7 g compare to when using 5 g.
In the sample 5, Cr decreases with 16% and then increase in the sample 6 with 30%. Cu deceases with79% in sample 5 and only with 66% in the sample with 7 g fly ash. Finally, the uptake for Zn in sample 5 is 87% and only 80% in the sample 6. The difference in the amount of metal ion uptake may be explained by the difference in the structure of metals ions (Alinnor et al, 2006).
Such increase means that fly ash when added in a ration L/S= 43 ml/g (liquid/solid) or L/S= 300 ml/g realizes metals in the sample. There is a limit of adsorption for fly ash. The mass added should not be too high or too low to avoid metals concentration increase.
M e tal s e vo lu ti o n ( % ) Metals
28
Discussion
The study shows that the optimum conditions for 300 ml stormwater are a mass of 7 g, a time reaction of 5 hours, a pH=11.44 and a H2O2 volume of 150µl.
In these conditions the color decreases with 94% in the first stage of the treatment and then with 98.5% after oxidation with a 30% solution of H2O2. After pre-treatment with fly ash a decrease of 84% has been
observed on COD and a decrease of 86% after oxidation. TOC has been reduced by 87.5% after treatment with fly ash and 89.6% after addition of 50 µl of H2O2 to 100ml of the treated water. The sample‘s phenol
concentration decreased with 78.8% after pre-treatment and 79.6% at the end of the treatment. Finally, a decrease of 96.2% was observed on iron concentration.
A decrease has been observed on others metals as well. The decrease has been observed on As; Cd; Co; Cu; Ni; Pb; V; and Zn respectively by 100%; 100%; 100%; 66%; 100%; 41% and 80%. The only one metal for which an increase was detected is Chrome.This suggests that fly ash has a low affinity for Cr.
The comparison of metals concentration in stormwater, in sample 5 and sample 6 without considering leachate, shows that all metals where reduced except for the Cr and V for which in both samples, the concentration is higher than in the sample without any treatment.
Table 26 : comparison of the concentration for some metals
Metal Stormwater (µg/l) Sample 5 (µg/l) Sample 6 (µg/l)
Cr 4.3 22 35
Cu 21 5.2 3.5
V 4.1 6.8 4.5
Zn 64 9.2 29
The increase is even higher in the sample 6. The concentration of Cr in stormwater is considered as low by the Swedish EPA; while those in the sample 5 and 6 are considered as high. The concentration of the Cu in both samples is considered as moderately high. In the sample 5; concentration of zinc is considered as low while in the sample 6 is considered as moderately high (EPA lakes and watercourses).
As it was discussed above, when the stormwater is treted with 4 g fly ash for 5 hours a decrease is observed on all metals. It would be very interesting to treat sample 5 and sample 6 a second time after filtration with 4 g fly ash and 5 hours reaction time to study if it is possible to decrease the concentration of Cr and V in the samples.
Therefore, the study shows that when using a low mass of fly ash; a very high increase of metals
concentration occurs in the sample. To avoid such negative effect, the ratio L/S should be in the limit of adsorption. In this study the ratio limit seems to be 48≤L/S˂ 300. However, when L/S=75 all metals seem being adsorbed. The limit of L/S ratio could be better studied so that it can be known with more precision. In the literature the metal uptake is explained by the electrostatic interaction. At a high pH adsorbent has a negative surface and metallic ions have a positive charge therefore, the adsorption of such ion increases. It would be of interest to conduct the same study with wood fly ash from different sources. Such study would allow determining if all wood fly ash have the same effects on the parameters studied and if not which are the characteristic suitable for the fly ash so that the method can be implemented within a large number of industries.
29
Conclusions
The method developed proves being very effective and low-cost. Almost all parameters were reduced with very high percentage. Despite the fact that fly ash can release metals into the aqueous phase, only the Cr and V concentration increased.
The method cost is very low. Indeed, the method use fly ash that in plus of being free is considered as a by-product within wood industries. Thus, the use of this raw-material into a waste water treatment method enables its recovery.
References
Åsa Hedmark . 2009. Treatment of Log Yard Runoff. Purification in Soil Infiltration Systems and Constructed Wetland. Faculty of Forest Sciences Uppsala. Thesis. ISBN 978-91-86195-99
Fabio Kaczala, Marcia Marques, William Hogland. 2010. Biotreatability of wastewater generated during machinery washing in a wood-based industry: COD, formaldehyde and nitrogen removal.Linnaeus University Kalmar. 101 ; 23 ; pp 8975-8983.
Francis O. ARIMORO, Robert B. IKOMI and Efe C. OSALOR. (2007). The Impact of Sawmill Wood Wastes on the Water Quality and FishCommunities of Benin River, Niger Delta Area, Nigeria. Delta State University. 2, 1, pp1-12
Jonsson, M. 2006. Wet Storage of Roundwood – Effects on wood properties and treatment of run-off water. Doctoral dissertation. ISSN 1401-6230, ISBN 91-576-6703-9.
Swedish Environmental Agency. 2000. Lakes and watercourses. Environmental Quality Criteria. Report 5050. ISBN 91-620-5050-8
Hanxu Li, Xiang-Zhong Shen, B. Sisk, W. Orndorff, Dong Li, Wei-Ping Pan and J. T. Rile. 1997. Studies of fly ash using thermal analysis techniques. Western Kentucky University. 49, pp943-951
A. Goi, M. Trapido, and N. Kuli. 2009. Contaminated Soil Remediation with Hydrogen Peroxide Oxidation. World Academy of Science.
Åsa Hedmark and Miklas Scholz. 2008. Review of environmental effects and treatment of runoff
from storage and handling of wood. Swedish University of Agricultural Sciences. 99 ,14, pp
5997-6009.
I.J. Alinnor. 2007.. Adsorption of heavy metal ions from aqueous solution by fly ash. Federal University of Technology. 86,5-6, pp 853-857.
SE-391 82 Kalmar +46 480 446200 info.nv@lnu.se Lnu.se