1
University of Halmstad
School of Business and Engineering
IMPROVING FOOD SECURITY IN SUB-SAHARAN AFRICA WHILE
LIMITING PRODUCTION IMPACTS ON CLIMATE
Master’s thesis by:
Michael Acheampong
Applied Environmental Sciences
15 Credits
Supervisor:
Göran Sahlén
June, 2011
2
ABSTRACT
Climate change is one of the biggest global challenges in the twenty-first century and has been discussed on several platforms with anthropogenic contributions to the phenomenon widely acknowledged. Agriculture has been one of the main contributors to climate change being a major source of all the three prominent green house gases (GHGs); CO2, N2O and CH4 mainly
due to intensification. The sub-Sahara African region faces a precarious food situation which looks to deteriorate through the years and the suggested intensification practices to improve on productivity are likely to worsen the impacts on climate. This paper makes a compilation from literature to address how food security in the region can be improved while reducing the negative impacts of agriculture on climate. Adoption of best management practices (BMPs) can reduce the global warming potential (GWP) of agricultural practices by increasing carbon sequestration and efficiency in fertilizer application to improve productivity. Enhancing the adaptive capacity of rain-fed agriculture to climate change through employment of scientific tools to map rainfall patterns coupled with strengthening the resource base of agriculture communities will be necessary to ensure food security in the sub-Saharan region. Continuous in-country assessments will be necessary to fit methods and approaches identified into specific local conditions of different countries.
3
ACKNOWLEDGEMENT
First of all, I am grateful to God for His protection and guidance throughout the study year.
For keeping her head up to ensure our dreams become a reality even during the seemingly impossible times, I want to say, God bless my mother. We will continue to keep the dream alive.
I owe sincere and earnest thankfulness to my supervisor, Göran Sahlén for his kind supervision without which this project would not have been successful. All the great comments have been very much appreciated.
I would like to show my gratitude to Stefan Weisner, Marie Mattsson, Siegfried Fleischer and Sylvia Waara their precious times they expended in my aid during the study period.
I am obliged to my colleagues and friends especially Benjamin Osei-Karikari for his role in helping out with this project.
I am truly indebted to Anna Larsson and Angela Bäckström for their support and contributions to my study period in Halmstad.
Special thanks go to Finn Poulsen, Miikka Vuorinnen and the Salvation Army of Halmstad for the wonderful gesture shown.
To my family and friends, I appreciate all the help and efforts.
4 CONTENTS ACKNOWLEDGEMENT ... 3 FIGURES ... 4 TABLES ... 5 1. INTRODUCTION ... 6
2. METHODOLOGY AND OBJECTIVE ... 9
3. RESULTS AND DISCUSSION ... 10
3.1. GLOBAL AGRICULTURE- Overview of its dynamics over the years ... 10
3.2. MECHANISMS OF EMISSIONS AND EFFECTS- How Agriculture impacts on Climate ... 13
3.3. ATTRIBUTES AND STATE OF SUB-SAHARAN AGRICULTURE... 15
3.4. EMISSIONS FROM UNDEVELOPED AGRICULTURAL SYSTEMS ... 19
3.5. EMISSIONS FROM ADVANCED AGRICULTURAL SYSTEMS ... 21
3.6. SITUATION OF GLOBAL FOOD SECURITY ... 23
3.7. CURRENT AND PROJECTED EMISSIONS FROM AGRICULTURE- Global and regional levels… ... 27
3.8. REDUCING EMISSIONS IN PRODUCTIVE AGRICULTURE ... 31
3.8.1. Carbon Sequestration ... 32
3.8.2. Appropriate Use of Fertilizer and Manure ... 35
3.8.3. Other means of improving yield while reducing emissions ... 37
3.9. CLIMATE CHANGE EFFECTS ON AGRICULTURE ... 40
3.9.1. Effects of Climate change on sub-Saharan Agricultural productivity ... 40
3.9.2. Adapting sub-Saharan agriculture to climate change ... 42
4. CONCLUSION ... 45
REFERENCES ... 48
FIGURES 1. IPCC assessment of Global Anthropogenic GHG emissions by the year 2004……….6
2. Sub-Saharan Africa indicated by green part of the map……… 9
3. Hunger in the developing world, with and without China as by FAO………...26
4. Right amount of N nutrition improves yield of corn and maximizes response to N rate…………..38
5. Adequate P nutrition causes a reduction in residual soil NO3-N in corn………...39
5
TABLES
1. Different uses of agricultural land in the past four decades in global and regional
contexts……. ………12
2. Trends in GHG emissions from different agricultural sources in different regions of the world from the period 1990-2020………22
3. Contribution of GHGs from different sectors of agriculture in different regions of the world in 2005………...28/29
4. Regional food consumption in total (109 KJ day-1) and per capita (KJ capita-1day-1)……...30
5. Current and projected regional GHG emissions………....30
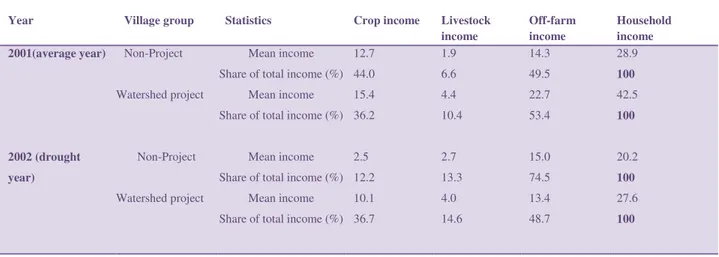
6. Effect of integrated watershed initiative on alternative sources of household income in the semi-arid tropics of India………..43
6
1. INTRODUCTION
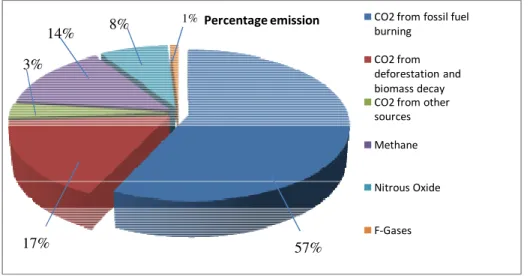
Climate change phenomenon is one of the most discussed issues around the globe in recent decades mainly because its consequences have been glaring in local, regional and global perspectives. There is no doubt that human activities have substantially increased green house gas (GHG) emissions in the atmosphere and for that reason, anthropogenic footprints on this phenomenon have been acknowledged whenever the issue has been discussed (Cooper et al., 2008; Gorte and Sheikh, 2009; Pitesky and Stackhouse, 2009; Tinker et al., 1995). Burning of fossil fuels is the leading cause of GHG emissions into the atmosphere basically in the form of CO2 (Tinker et al., 1995) but agriculture has been identified as one of the few anthropogenic
activities that produce substantial amounts of all the three major Green House Gases; CO2, N2O
and CH4 (Johnson et al, 2007) with proportion of each gas emitted by different activities
represented in figure 1.
Percentage emission CO2 from fossil fuel burning
CO2 from deforestation and biomass decay CO2 from other sources Methane Nitrous Oxide F-Gases 17% 3% 14% 8% 1% 57%
Figure 1: Assessment of Global Anthropogenic GHG emissions by the year 2004 (Redrawn from IPCC, 2007)
The rate of CH4 emissions into the atmosphere is said to have doubled over the last 25 years due
to human activities (Synder et al., 2009) and said to have increased at a rate of 1% per year with 70-90% coming from biotic sources (Bouwman, 1990) while atmospheric concentrations of N2O
concentrations is reported to have increased from 270 parts per billion (ppb) during the pre-industrial era to 319 ppb in 2005 (Synder et al., 2009). Global land characteristics including physical and physiological characteristics have been significantly altered by humans through agricultural activities. On the global scale, agriculture is said to account for 13% of radiative
7
forcing related to GHGs (Desjardins, 2010). At the local, regional and global scale, agriculture is considered to be the largest source of anthropogenic N2O and CH4 (Pitesky and Stackhouse,
2009) contributing 52% of global methane and 84% of global nitrous oxide emissions from agricultural sources such as animal husbandry, manure management and agricultural soils (Desjardins, 2010) while transportation still accounts for the highest CO2 emission (Pitesky and
Stackhouse, 2009).
Globally, agriculture is recognized to have undergone tremendous changes in the past four decades and these changes have been influenced mainly by population pressure, technological changes, public policies and economic growth (Smith et al., 2007). These changes in agriculture has kept the production of food and fiber in pace with sharp increase in food demand by a constantly rising world population even though there are notable regional exceptions. Agricultural growth has however occurred to the detriment of the environment while it has not been successful in solving the problems of child malnutrition and food insecurity in very poor countries (Smith et al., 2007).
The demand for agricultural products is rapidly on the increase in the world due to a constantly growing population and shifts in consumption patterns. The increase in production in the agri-food sector is highly desired in countries where agricultural productivity has been relatively low at present levels (van Beek et al., 2010; Verge et al., 2006). These countries are mainly identified as developing countries and countries in transition which are non-Annex 1 countries of the United Nations Framework Convention on Climate Change (UNFCCC) (van Beek et al., 2010). Asia is the largest food consumer of the world and will remain so for the next three decades while contributing about 50% of global GHGs from agriculture. The growth of food demand will however be highest in Africa (Verge et al., 2006).
Agriculture is said to account for 20-30% of gross domestic product (GDP) of the sub-Saharan region and 55% of total value of exports from Africa (O’Brien and Leichenko, 2000). The sub-Saharan region has been relatively left out of globalization process (O’Brien and Leichenko, 2000) and is the only region of the world where food production has been on the decline despite a general increase in the world (Pitesky and Stackhouse, 2009) as the green revolution responsible for increase in agricultural production and reduction of poverty in Latin America and Asia has largely by-passed it (Cooper et al., 2008). This declining trend can be linked closely to
8
issues regarding low and declining soil fertility and inadequate fertilizer inputs as well (Smith et al., 2007).
An estimated substantial increase of up to 127% in agricultural GHGs is likely to result from the growing food demand in Africa unless improved management systems are introduced and adopted (Verge et al., 2006). This is because the intensification of agricultural systems is closely linked to the high level emissions in the form of N2O and CH4 (van Beek et al., 2010). As stated
in van Beek et al. (2010), although the current increase in GHG emissions in non-Annex countries is mainly as a result of the increasing level of fossil fuel use, future agricultural emissions also requires much attention regarding how the economic development of most of these countries is rooted in agriculture. The changes associated with agricultural production, transport and systems of processing will have a massive impact on their emissions.
The importance of addressing limitation of GHG emissions from agriculture in the African continent especially in the sub-Saharan region is further highlighted by studies which consider the potential effects of climate change on agricultural productivity (Parry et al., 1999). It is estimated that about 80 million additional people to the currently estimated half of a billion worldwide will be at the risk of hunger due to climate change by 2080 (Parry et al., 1999) and the African region will be one of the most adversely affected as it is expected to experience marked reductions in yield and could have 70 million of the total projected (Parry et al, 1999; Ramankutty et al., 2005).
The necessity of examining the links between mitigation and adaptation; and sustainable development drive and potential for mitigating GHG emissions from agriculture in the future cannot be over stated. As Synder et al. (2009) states, agriculture has the potential to reduce GHG emissions and increase C sinks.
9
2. METHODOLOGY AND OBJECTIVE
My project is a desktop study which focuses on sub-Sahara Africa (figure 2) and makes a review from various scientific articles, reports, books and other related materials to address my objectives which are;
• Identify some of the best management practices (BMPs) from around the world with the potential of improving agricultural productivity of the region while mitigating GHG emissions usually associated with agriculture intensification.
• The current agricultural systems in the region is highly reliable on rainfall as the sole source of moisture and the success or failure of a growing season is associated with seasonal rainfall variability (Cooper et al., 2008). The project therefore seeks to identify means of enhancing the ability of agriculture communities and various stakeholders involved in agriculture in sub-Sahara Africa to adapt to climate change that may already be underway to help reduce the projected negative impacts, while taking advantage of any possible opportunities.
10
3. RESULTS AND DISCUSSION
3.1. GLOBAL AGRICULTURE- Overview of its dynamics over the years
The development and improvement in agricultural practices have occurred for thousands of years through the history of man. Many changes have occurred in the global agricultural sector but these changes cannot be said to be uniform, as different forms of advancements are made in different regions around the world. However, common factors such as increase in the demand for food, increased technological intervention and an improved understanding of the ecosystem have formed the basis to these changes of agriculture (Desjardins, 2010). There is a hypothesis of early agricultural development being few forest clearings which occurred in Europe and China about 8,000 years ago, a period when hunting and gathering was still the basic means of accessing food for consumption. Climate was least affected by this early form of agriculture but impacts on climate have increased through the years from agriculture improvement through the Asian adoption of paddy rice system through the slash and burn system to the highly mechanized forms of agriculture currently practiced in many parts of the world (Desjardins, 2010).
Global landscape has been changed to a very large extent by the improvements in agricultural system as there is a high rate of substitution of natural vegetation for agricultural lands. There is currently a total of about 1.4 billion hectares of farm land on which agricultural activities are undertaken of which 18 million km2 are croplands (Ramankutty et al., 2005). The study of Desjardins (2010) further sheds more light on how much agriculture has altered the global landscape through the years by stating that the size of cropland area increased to 1,471 million hectares in 1990 from 265 million hectares in 1700. Desjardins (2010) also stated that in the same period, 1700-1990, livestock grazing areas increased to 3,451 million hectares from 524 million hectares. These major changes have had significant impacts on climate due to resultant degradation of land in many areas around the globe.
Carbon and nitrogen fluxes were effectively balanced in the early systems of agriculture such as the traditional slash and burn system which was practiced on small scales and allowed re-establishment of natural vegetation through long fallow periods. This reduced annual build-up of GHGs in the atmosphere as emissions were limited (Desjardins, 2010; Tinker et al., 1995). Desjardins (2010) however identifies that changes in the physical and physiological land
11
characteristics of the globe has been largely contributed by activities such as tillage, irrigation, fertilizer application and others which are carried out extensively by humans due to development in the agricultural sector.
Despite the general expansion of agricultural systems around the globe due to a constantly increase in production demand, there exist a conspicuous difference in agricultural footprints on different areas around the world in the present times as far as adopted methods and production systems are concerned. Smith et al. (2007) stated that technological changes, population pressure, economic growth and price squeeze have been some of the main factors driving a drastic change in agriculture in the past four decades. Verge et al. (2006) cited FAO (2003) which stated that since the 1960s, crop production increase has been as a result of yield improvement with 78% of the growth; 15% arising out of arable land expansion and responsible for the remainder 7% being crop intensity increase. The study projected a likely continuing trend through the year 2030 with about 70% accounted for by improvement in yield, 20% by land expansion and 10% by increase in cropping intensity.
Green revolution was a coordinated international effort which was instituted to pursue the goal of eliminating hunger and this is seen to have accounted for increase in food production around the world. This plan came with intensification of practices such as fertilizer and pesticide application, irrigation and mechanization of farms to pursue its goal (Smith et al., 2007; Verge et al., 2006). The green revolution is said to have been successful in keeping the pace of food and fiber production with the steep increase in food demand from a constantly growing global population but has not been completely successful in solving child malnutrition and food security problems since there are still challenges in some regions to contend with. Meanwhile, it has been noted that the intensification practices which accompanied this effort has been very detrimental to the quality of the environment (Smith et al., 2007; Verge et al., 2006).
As with the details presented in table 1, there has been a decrease in agricultural lands in developed countries while an increase has been observed in the developing countries. This is attributed to the fact of land use efficiency in the developed countries through the employment of very advanced agricultural systems (Smith et al., 2007) while the subsistence form of agriculture still practiced in most rainforest areas coupled with expansion of pasture lands has been
12
responsible for the increased clearance of natural vegetation for agricultural lands (Desjardins, 2010).
Production of livestock is presently the biggest user of all agricultural lands around the globe both in direct terms for pasture and indirectly for feed and forage. According to Ramankutty et al. (2005), lands under permanent pastures are more than twice those dedicated to food crop cultivation around the globe. Over 40% of current food production in the world stems from livestock production and its contribution is observed to still be on the rise.
There is no doubt that food demand will continually increase due to a constantly rising global population. This, accompanied by a general worldwide phenomenon of carbon-credit market emergence and high demand for biofuels will only not likely result in mounting pressure on agricultural lands but also an enhancement of agricultural productivity through intensification since incentives exist for producers (Desjardins, 2010).
Table 1: Different uses of agricultural land in the past four decades in global and regional contexts (Redrawn
from Smith et al, 2007)
Area in Million ha (Mha) Change (2000s-1960s)
1961-1970 1971-1980 1981-1990 1991-2000 2001-2002 % Mha World Agricultural land Arable land Permanent crops Permanent pasture Developed countries Agricultural land Arable land Permanent crops Permanent pasture Developing countries Agricultural land Arable land Permanent crops Permanent pasture 4562 1297 82 3128 1879 648 23 1209 2682 650 59 1973 4484 1331 92 3261 1883 649 24 1210 2801 682 68 2051 4832 1376 104 3353 1877 652 24 1201 2955 724 80 2152 4985 1393 123 3469 1866 633 24 1209 3119 760 99 2260 5023 1405 130 3488 1838 613 24 1202 3184 792 106 2286 +10 461 +8 107 +59 49 +10 306 -2 -41 -5 -35 +4 1 -1 -7 +19 502 +22 142 +81 48 +16 313
13
3.2. MECHANISMS OF EMISSIONS AND EFFECTS- How Agriculture impacts on
Climate
The study of mechanisms through which anthropogenic activities impact on GHG emissions in atmosphere and affect global climate have existed for over 100 years as John Tyndall in 1861 stated that CO2 in the atmosphere could effectively trap heat (Johnson et al., 2007). Agriculture
impacts on climate through two processes; the biogeochemical which constitutes the release and sequestration of GHGs that modifies the absorption of terrestrial long-wave radiation from the atmosphere and the biophysical which modifies surface energy budget and water balance through land cover change (Desjardins, 2010; Seguin et al., 2007).
Agriculture can influence climate through land-use changes which has the capacity to modify albedo (how much incident sunlight is reflected back) of earth surface. Climate can also be affected directly or indirectly by the radiative and non-radiative forcing agents impacted by agricultural activities. Approximately one-fifth of the annual increase in radiating forcing, or one-third with land-use considered is accounted for by the emissions of CO2, CH4 and N2O on
global scale (Desjardins 2010; Verge et al., 2006). Aerosols existing in the environment as dust particles from bare soil and plant residues or burning of crops can also have a significant cooling effect. Directly, they affect radiation budget by scattering and absorbing both short-wave and long-wave radiation while they indirectly possess a radiative effect of influencing the formation of clouds which lead changes of incoming radiation. Hydrological cycle change as a result of different crop and soil conditions is an example of non-radiative forcing effect. Both radiative and non-radiative effects can change heat and moisture fluxes on the surface which changes the lower boundary conditions of the atmosphere thereby influencing weather and climate (Desjardins, 2010; Verge et al., 2006).
Agricultural development has contributed enormously to the release of GHGs into the atmosphere. It is estimated that a total of about 310 gigatons of carbon (GtC) was accumulated at an average rate of 0.04 GtC yr-1 between 8000 years and 200 years ago from land clearance but this contribution has increased to an average of 0.8 GtC per year since the beginning of industrial revolution accumulating an estimated 160 GtC in the period (Desjardins, 2010). It is estimated that CO2 emissions from fossil fuels only surpassed that of agriculture after the 1970’s.
14
More than 50% of the world’s crops are routinely fertilized stemming from the Green Revolution. Increasing use of nitrogen fertilizers has prompted concerns of the impact of their N2O releases on the environment. Studies show that more than 50% of nitrogen fertilizers are not
taken up by crops and are lost either through leaching or released into the atmosphere in the form of N2O (Desjardins, 2010; Smith et al., 2007; Verge et al., 2006). According to Snyder et al.
(2009), N2O emissions are through two microbial processes; nitrification and denitrification and
these processes release small amounts relative to the total soil N supply. Denitrification occurs when NO3- is transformed to dinitrogen (N2) gas described in the pathway, NO3- - NO2- – NO -
N2O - N2. The process of converting NO3- to N2 is usually completed with a small and variable
portion of the N emitted as N2O gas. Emissions occur sporadically before, during and after a
growing season. Moistening or saturation from precipitation or irrigation of soils which were previously well-aerated can also cause flushes of N2O (Synder et al., 2009).
Several GHGs including carbon dioxide (CO2), methane (CH4), ozone (O3), nitrous oxide (N2O)
and water vapour trap heat. CO2, CH4 and N2O are however recognized as major contributors to
positive increases in radiative forces as they are long lived in the atmosphere (Johnson et al, 2007). Therefore, high increases in their atmospheric concentrations have the capacity to cause elevated mean global temperatures and changes in precipitation (Tinker et al., 1995).
15
3.3. ATTRIBUTES AND STATE OF SUB-SAHARAN AGRICULTURE
The targeted economic growth of most sub-Sahara African countries still has agriculture as the main engine of their drive contributing about 30% of the GDP and being the source of employment of about half of its labour forces (Barrios et al., 2008; O’Brien and Leichenko, 2000). The systems of agriculture in this region of the world remain basically rain-fed. Even though rain-fed agricultural systems is a major contributor of global food (about 60%), it is exceptionally significant in the sub-Saharan region as it contributes to about 90% of its staple food production. Rain-fed agriculture therefore forms the basis for food security and forms the foundation of the livelihood of many rural communities (Barrios et al, 2008; Cooper et al, 2008).
Agriculture, despite its economic importance in the sub-Saharan region has had a relatively poor performance in relation to other developing regions of the world (Barrios et al., 2008). Institutional failures, pre-colonial slave trade and poor policies in the post-colonial era including economic ones such as focusing on cash crops and minerals as the main source of government revenue and foreign exchange have been pinpointed as having played negative key roles in sub-Saharan agricultural performance (Barrios et al., 2008; Mohammed-Saleem, 1995). Intensification of agriculture in many developing regions of the world has taken place gradually over some decades but will have to occur in a very short period in the sub-Saharan region due its rapid population. As Mohammed-Saleem (1995) stated, the process of agricultural intensification in the sub-Saharan region has been sabotaged by the many economic distortions in the region since independence.
Although basically dependent on rain as the source of moisture for agriculture in the sub-Saharan region, it is worthy to note that availability of water in the region widely differs as a consequence of a very large diversity of geographic conditions across the continent (Barrios et al, 2008). The tropics around the equator being parts of both the West and western part of Central Africa are humid throughout the year. There is almost no rain in dry seasons in the sub-humid regions located to the south and the north of the tropics though substantial rainfall occurs in the wet seasons. Located further towards the poles from the sub-humid regions are the arid and semi-arid climates. As can be inferred from the names, these areas suffer from unreliable rainfall in extremity and very few permanent water resources thus receiving very little direct water
16
although not totally rid of water in the wet seasons (Barrios et al, 2008). It is also worthy to point out that even though many large water basins and rivers exist on the continent with some parts noted to experience massive rainfall, there is particularly low run-off from these areas to the arid and semi-arid areas.
The year round high temperatures in the sub-Saharan Africa exacerbate the issue of water scarcity especially in the arid and semi-arid areas. Barrios et al. (2008) states that the average run-off is 15% lower on the African continent than any other continent of the world and it is lesser in the arid and semi-arid regions as the dry soils absorbs very much moisture. This makes the arid region the region with the lowest capacity to support human needs as long as agriculture is in the context of discussion (Mohammed-Saleem, 1995). Despite the relatively low supply of naturally produced water compared to other regions of the world, the sub-Saharan region has very much smaller proportion of its arable lands under irrigation. As a matter of fact, it is less than 10% of irrigation compared to 20% irrigated arable lands existing in other developing regions of the world (Barrios et al., 2008).
Agricultural production in the sub-Sahara is highly affected by the above described geographical variation of water availability in an ironic sense. More precisely, the abundance of water in the humid parts of the tropics has been ironically identified not to make it suitable for agricultural productivity (Barrios et al., 2008). Most soils in Africa are derived from high chemical weathering of granite and parent gneiss material fostered by high temperatures, making them coarse and abundant rainfall causes leaching, resulting in organic matter content and inherent fertility being very low (Barrios et al 2008; Mohammed-Saleem, 1995). These soils are notably deficient in nutrients such as nitrogen and phosphorus (Mohammed-Saleem, 1995). For the reasons as explained above, much crop production in sub-Saharan Africa is located in the semi-arid zones making it more susceptible water shortages (Barrios et al., 2008). The agricultural practices undertaken have also often contributed to the water shortage problem in Africa more than any other region due to differences in property rights. To be more precise, the preservation of natural resources including water resources have generally been viewed as a secondary objective by farmers since they usually do not own the farms on which they work. In the work of Barrios et al. (2008), the water problem associated with the sub-Saharan agricultural system is
17
compounded by farmers predicting large fluctuations in rainfall by rudimentary non-scientific means.
Sub-Saharan Africa is a region dominated essentially by small holders and has very sensitive environment (Mohammed-Saleem, 1995). The farming systems were previously guided by principles of shifting cultivation which gave enough fallow periods for soils to regain fertility. As population grows and cropped areas expand, land use intensifies and fallow periods are progressively shortened interfering with soils ability to regain fertility, producing little fuel wood and providing a poor grazing resource. For the pursuit of alternative fuel sources, crop residues and dung which are desperately needed to help maintain soil structure and fertility are increasingly burnt (Mohammed-Saleem, 1995). This coupled with communal or uncertain land tenure over the most parts of the region makes the task of agricultural development harder.
Mixed cropping is undertaken mostly in the sub-Saharan region as Mohammed-Saleem (1995) states, farmers intercrop anything with everything. This method of growing a mixture of crops and varying land management helps in adjusting to different soil and water regimes. Intercropping is also said to possess other advantages such as providing a protective cover of vegetation which lowers soil temperature, increases water infiltration thereby reducing soil erosion and lowers labour needs for controlling weed. Mohammed-Saleem (1995) also states that the combination of crops and plants with different heights, root depths and periods of maturity complement each other in the in the use of light, water and nutrients. Although yields associated with intercropping are usually greater than monocropping, yields in general have declined in the absence of fertility replenishment stemming from short fallows.
Adoption of the use of fertilizers compensates for the shortened fallow periods but many farmers in the sub-Saharan Africa have no incentive for their use because of their scarcity or prices of farm produce not being sufficiently attractive (Kelly, 2005; Mohammed-Saleem, 1995). Manure is used where fertilizers are not easily accessible while mulching dominates in areas unsuitable for animals. The demand for power is however encouraging integration of animals into farming systems.
In a nutshell, the changing circumstances of the sub-Saharan farmer have not been catered for by technological innovation, infrastructure and extension services. Farmers moving activities into marginal lands have a deleterious impact on the environment while still not being able to
18
increase productivity as they continue to use traditional techniques which have failed to sustain productivity in abandoned lands which were suitable for agriculture (Mohammed-Saleem, 1995). Most countries in the sub-Saharan region have their populations growing to the level where intensification of agriculture is more than a necessity.
19
3.4. EMISSIONS FROM UNDEVELOPED AGRICULTURAL SYSTEMS
The rain-fed agricultural systems in the undeveloped parts of the world especially sub-Saharan Africa are undertaken through slash and burn due to lack of machinery for large scale production and the general subsistence outlook. The slash and burn approach to agriculture was traditionally practiced on local or very small scale by farming communities and due to lower population levels which was then existent, it was characterized by long fallow periods and thus, undisturbed forest area was relatively large (Tinker et al., 1995). This made the system a fully sustainable one with no net input of CO2 and other significant GHGs into the atmosphere as the carbon and
nitrogen fluxes resultant from the traditional or earlier slash and burn effectively balanced. In the system, carbon fixation through the process of photosynthesis equals the sum of carbon loss through the process of respiration while the above and below ground biomass remained constant with soil organic carbon level (Tinker et al., 1995).
Increase in population in the recent decades has however caused a dramatic increase in tropical deforestation as a result slash and burn clearing to establish more permanent agriculture, plantations and pastures which has often resulted in degraded grasslands or degraded fallows (Tinker et al., 1995). For this reason, emissions from such systems of agriculture have been mainly related to resultant land use change (Verge et al., 2006). As Tinker et al. (1995) stated, any land clearing possess very important consequences as the felling and burning of forest lead to high GHG and aerosol emissions. Apart from GHGs arising from forest clearance, soil cultivation and growing of annual crops results in accelerated conversion of soil-C to CO2 by soil
microbes (Verge et al., 2006). One-third of global net CO2 emissions are as result of agricultural
related deforestation and burning (Johnson et al., 2007). Nitrogen is also mineralized and denitrified by processes such as tillage in the cultivation process which increases GHGs from these agricultural systems (Tinker et al., 1995). As was further described by Tinker et al. (1995), there is a nitrogen balance obtained between nitrogen of either biological fixation or rainfall and losses due to leaching and denitrification. However, this balance is seriously disturbed when good secondary forests are not able to re-establish and loss of carbon from soil and vegetation becomes permanent due to very short fallows.
20
Tropical rainforest areas are impacted most by agricultural land use change where native rainforests are continuously being cleared for cultivation. This contributes significantly to total global deforestation which exceeds 13 M hectares per year (Desjardins, 2010). Generally, it is accepted that the expansion of agriculture into natural ecosystems has already had a significant impact on climate as agricultural activities emitted the most CO2 into the atmosphere before the
1970’s when burning of fossil fuels surpassed this emission. Lack of intensification in agricultural systems especially in areas like the sub-Sahara keeps expansion of agricultural lands being on the rise as was shown in table 1 (Smith et al., 2007) thus, a continually rising CO2
emissions.
Although CO2 is known to be the main GHG emitted from agricultural systems such as that
practiced in the sub-Saharan region, some fire conditions during biomass burning in African savannas and forests may also release significant amounts CH4 and N2O (Tinker et al., 1995).
Tinker et al. (1995) referred to estimated 29 particles per million by volume (ppmv) of CH4 in
smoke plumes in annual savanna fires and 0.37 megatons (Mt) N2O lost from fires in the whole
of Africa.
As outlined above, undeveloped agricultural systems could have significant impacts on the climate by releasing GHGs through several pathways. Most lands of such agricultural systems are dedicated to annual cropping which possess the capacity to radically change the hydrology, micrometeorology and conditions of the soil (Tinker et al., 1995).
21
3.5. EMISSIONS FROM ADVANCED AGRICULTURAL SYSTEMS
Unlike earlier agricultural systems and those practiced in the much undeveloped parts of the globe which are characterized mainly by CO2 emissions, high level N2O and CH4 emissions
characterizes agricultural production in the very advanced systems. The main anthropogenic emitter of N2O which contributes highly to global warming and destruction of the ozone layer is
thought to be agricultural production (Hoffman et al., 2001; Smith et al., 2007).
Fertilizer application in the advanced agricultural systems is the main cause of N2O emissions
while enteric fermentation and manure application causes the major part of CH4 released. As
much as 78% of total N2O in the United States is said to result from application of nitrogenous
fertilizers and cropping practices (Johnson et al., 2007). Ten percent (10%) of GHG emissions in the European Union is said to be due to N2O and CH4 of which 63% and 49% respectively have
been associated with agriculture.
Agricultural development has for a long period of time followed a general rule which has been expanding lands and land use intensification as population density increases (Mohammed-Saleem, 1995). However, advancement and mechanization of agricultural systems have aided the output associated with intensive farming. In East and West Asia, the transition to intensive farming was aided by irrigation while more sophisticated crop rotations involving legumes and integration of livestock with arable farming ensured a transition in the Middle Ages of Europe; two processes which have to a very high extent eluded the undeveloped agricultural systems like those practiced in the sub-Saharan Africa to aid transition (Mohammed-Saleem, 1995; Smith et al., 2007).
As was noticed before in the previous sections, mechanization of agriculture including massive use of fertilizers which have increased N2O and CH4 has on the other hand been successful in
increasing production over very small areas causing decrease in agricultural land in the developed world contrary to the case scenario in the developing world (table 1). An assessment of the Environmental Protection Agency of the United States (US-EPA) as referenced by Smith et al., (2007) showed manure management was the only source of agricultural GHG emissions in which agricultural systems in the developed world surpassed that of the developing parts. According to their assessment, GHG emissions in the Europe, one of the regions with
22
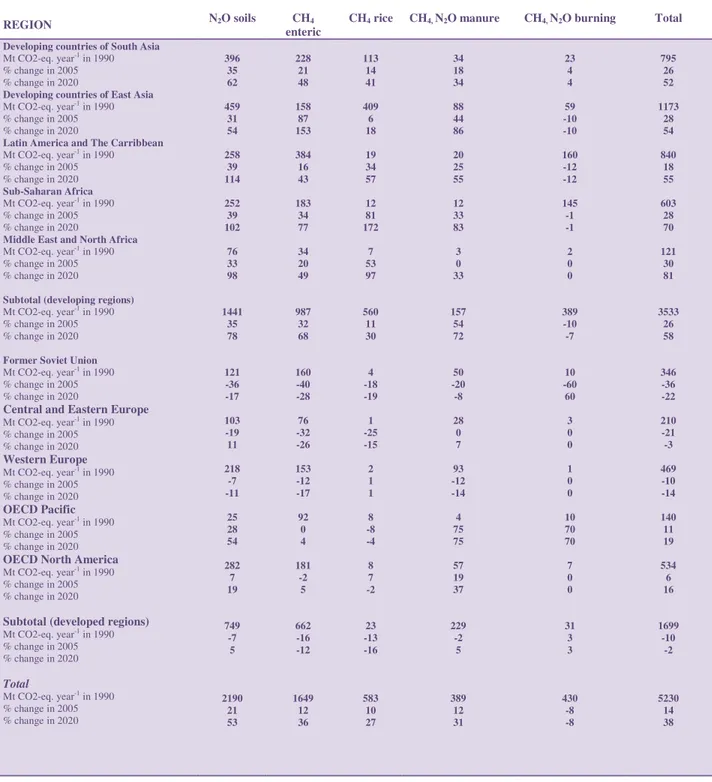
widespread advanced forms of agricultural systems amongst its countries is the only region with its agricultural GHG emissions projected to decrease until 2020 (table 2).
Table 2: Trends in GHG emissions from different agricultural sources in different regions of the world from the period 1990-2020 (Redrawn from Smith et al., 2007)
REGION N2O soils CH4
enteric
CH4 rice CH4, N2O manure CH4, N2O burning Total
Developing countries of South Asia
Mt CO2-eq. year-1 in 1990
% change in 2005 % change in 2020
Developing countries of East Asia
Mt CO2-eq. year-1 in 1990
% change in 2005 % change in 2020
Latin America and The Carribbean
Mt CO2-eq. year-1 in 1990 % change in 2005 % change in 2020 Sub-Saharan Africa Mt CO2-eq. year-1 in 1990 % change in 2005 % change in 2020
Middle East and North Africa
Mt CO2-eq. year-1 in 1990
% change in 2005 % change in 2020
Subtotal (developing regions)
Mt CO2-eq. year-1 in 1990
% change in 2005 % change in 2020 Former Soviet Union
Mt CO2-eq. year-1 in 1990
% change in 2005 % change in 2020
Central and Eastern Europe
Mt CO2-eq. year-1 in 1990 % change in 2005 % change in 2020 Western Europe Mt CO2-eq. year-1 in 1990 % change in 2005 % change in 2020 OECD Pacific Mt CO2-eq. year-1 in 1990 % change in 2005 % change in 2020 OECD North America
Mt CO2-eq. year-1 in 1990
% change in 2005 % change in 2020
Subtotal (developed regions)
Mt CO2-eq. year-1 in 1990 % change in 2005 % change in 2020 Total Mt CO2-eq. year-1 in 1990 % change in 2005 % change in 2020 396 35 62 459 31 54 258 39 114 252 39 102 76 33 98 1441 35 78 121 -36 -17 103 -19 11 218 -7 -11 25 28 54 282 7 19 749 -7 5 2190 21 53 228 21 48 158 87 153 384 16 43 183 34 77 34 20 49 987 32 68 160 -40 -28 76 -32 -26 153 -12 -17 92 0 4 181 -2 5 662 -16 -12 1649 12 36 113 14 41 409 6 18 19 34 57 12 81 172 7 53 97 560 11 30 4 -18 -19 1 -25 -15 2 1 1 8 -8 -4 8 7 -2 23 -13 -16 583 10 27 34 18 34 88 44 86 20 25 55 12 33 83 3 0 33 157 54 72 50 -20 -8 28 0 7 93 -12 -14 4 75 75 57 19 37 229 -2 5 389 12 31 23 4 4 59 -10 -10 160 -12 -12 145 -1 -1 2 0 0 389 -10 -7 10 -60 60 3 0 0 1 0 0 10 70 70 7 0 0 31 3 3 430 -8 -8 795 26 52 1173 28 54 840 18 55 603 28 70 121 30 81 3533 26 58 346 -36 -22 210 -21 -3 469 -10 -14 140 11 19 534 6 16 1699 -10 -2 5230 14 38
23
3.6. SITUATION OF GLOBAL FOOD SECURITY
The 1974 World Food Conference set a very ambitious goal to eradicate hunger from the human society in a decade under the proclamation; “every man, woman and child has the inalienable right to be free from hunger and malnutrition” (Gebremedhin, 2000). There has been an enormous improvement in global food supply since the early 1960s with world food supplies being 18% higher than 30 years ago.
The global grain yields per hectare in the decade of 1990s were nearly 2.5 times the 1.15 tons per hectare in the 1930s. In 1994 alone, world grain harvests rose by 2.9% to 1,747 million tons (M-tons) from a value of 1,697 M-tons in 1993. With the exception of slight fluctuations in some years basically attributed to drought and other natural disasters, world grain production especially wheat, corn and rice is seen to have shown a general upward trend (Gebremedhin, 2000). Meat production of the world also shows an increasing trend with a recorded 184 M-tons output in 1994 up from 177 M in 1993. The past two decades have seen the world make remarkable progress towards increasing food production and reducing food insecurity (von Braun et al., 2003) due to very favourable agricultural conditions that were experienced in the 1980s and 1990s (Gebremedhin, 2000). As referenced in von Braun et al. (2003), the number of food insecure people in developing countries fell from 920 M people in 1980 to 799 M in 1999 with the proportion taking a drop from 28% to 17% as according to FAO statistics. Furthermore, the present level of global food production has the capacity to satisfy the minimum calories of every individual within the total world population should there be an even distribution of available food supplies (von Braun et al., 2003).
There is no doubt that the general picture of world food production has improved over the years. Gebremedhin (2000) and von Braun et al. (2003) have stated that the trend of increasing productivity will continue in the decades ahead due to improved agricultural technology. Despite these improvements and optimistic future projections, the world still faces a serious crisis which is as perilous and life threatening to millions of people as was in the past since they do not share in this abundance (Gebremedhin, 2000). During the World Food Conference in 1996, two decades and two years after the 1974 proclamation, a renewed world food crisis was noticed as it was realized that many children still went to bed hungry, many families ended the day without a guarantee for the next day’s meal and many people faced the risk of stunted growth as a result of
24
hunger and malnutrition which made it clear that the goal of the 1974 conference had not been achieved (von Braun, 2003). The general outlook of food sufficiency for the earth’s population has not reflected in all countries as it is evident that the poor have all too often not had access to the food. This can be attributed to the fact that many poor countries have not had the capacity to be self-sufficient as long as food and agricultural production is concerned due to various economic, social and political reasons (Gebremedhin, 2000).
Due to unreliable data from many countries especially developing ones, it is difficult to estimate the total number of undernourished people today as different authors have published different figures (Gebremedhin, 2000). Despite this inconsistency, there is a general agreement that an extremely large number of people are affected by hunger and malnutrition. An estimated 1 billion people were estimated not to have enough food to lead to healthy and productive lives and out of seven people on the earth is affected by hunger by World Bank in 1996 (Gebremedhin, 2000). As referenced in Gebremedhin (2000), the Food and Agriculture Organization also estimated in 1997 that 840 million of the world’s 1.1 billion poor people live in rural areas with 15 million of them dying annually from starvation and its related diseases.
In 1994, 1.4 billion people were estimated to be living in absolute poverty by Childers and Urquhart as was referenced by Gebremedhin (2000). This number was said to be 40% more than the number estimated half of a century earlier. It is also estimated that nearly one out of every four people living on the planet lives on the edge of poverty, too poor to obtain food needed to work. The livelihood and well-being of many people are being adversely affected by the consequences of hunger and malnutrition thereby causing the development of many undeveloped countries to be inhibited (Gebremedhin, 2000). Associated with the hunger situation in very poor countries is the lack of purchasing power (combination of income and the price of goods and services purchased) among the poorest segments of the society since the income distribution in such countries is skewed towards the high end of the scale making it difficult for the poor to purchase adequate food supplies.
Dependency on natural resources for food supply or using income derived from natural resources for purchasing food is a critical commonality between developing countries. According to the United Nations, about 70% of the 5.2 billion hectares of dry lands dedicated to agriculture are already degraded and this affects the livelihood of an estimated 250 million people around the
25
world (Mwakalobo and Shively, 2002). The last quarter of the twentieth century is said to have seen a reduction of world’s arable land by about 25% and this has had dire implications for food security and people dependent on degraded lands. The situation is especially worse in sub-Saharan Africa where the dependence on natural resources is potentially very high as it is said to presently produce less food per person than it did 30 years ago (Gebremedhin, 2000; Mwakalobo and Shively, 2002).
Economic Research Service (ERS) predicts growing gaps for low-income countries mostly in sub-Sahara and Asia over the next decade despite the increase in food supply in developing countries over the past two decades (Mwakalobo and Shively, 2002). There is a deterioration of food security in sub-Sahara African countries and is recognized as the most vulnerable region. The sub-Saharan region accounts for 65% of total gaps for all countries within the ERS assessment. The population of the sub-Saharan Africa grows at around 3% per year which is much greater than the rate at which food production increases, 1% per year (Davidson et al., 2003; Mwakalobo and Shively, 2002). The International Food Policy Research Institute (IFPRI) measured food insecurity with a new methodology which goes beyond the assessments done on the basis of food availability data. This new approach took into consideration information gathered by nationally representative surveys at household levels which is the level at which access to food actually takes place. Preliminary results from 10 sub-Saharan countries showed a very high food insecure population which is worse than estimated by assessments based on food availability data (von Braun et al., 2003).
With China out of the picture, the number of food insecure people in the developing world increased from the 1980s through the 1990s by nearly 50 million people as shown in figure 3 (von Braun et al., 2003). In sub-Sahara alone, the number of people living in hunger is said to have jumped nearly 20% and with almost a doubled number of food insecure people by the end of the decade (Mwakalobo and Shively, 2002; von Braun et al., 2003). According to the FAO, the situation could have been more precarious in the absence of large in-flows of food aid. There is still a forecast of acute food shortage and persistence of severe malnutrition in the sub-Saharan Africa and the Sahel by FAO (Mwakalobo and Shively, 2002).
26 500 550 600 650 700 750 800 850 900 950 1000 1980 1990 2000 N u m b e r o f u n d e rn o u ri sh e d p e o p le in m il li o n s Developing world without China Developing world Year
Figure 3: Hunger in the developing world, with and without China as by FAO (Redrawn from von Braun et
al., 2003)
The rather precarious nature of food insecurity in most developing countries especially sub-Saharan Africa amidst a general growth in the world is one of the most visible manifestations of rural poverty deserving of considerable attention in both theory and policy (Mwakalobo and Shively, 2002). Highlighting the real causes of malnutrition and hunger in the region to raise awareness is very necessary to serve as a challenge to policy makers and planners to make changes in policies and development programs to alleviate poverty and ensure food security (Gebremedhin, 2000).
27
3.7. CURRENT AND PROJECTED EMISSIONS FROM AGRICULTURE- Global and
regional levels
As a result of the Green Revolution, fertilizers have been highly utilized to improve and sustain food production and their use is expanding on the global scale to meet the food, fiber and fuel demands of a constantly rising population (Snyder et al., 2009; Verge et al., 2006). Population increase and increased emissions from agricultural activities are positively correlated in so many countries (van Beek et al., 2010) due to increased fertilizer usage which in turn is positively correlated with N2O flux (Johnson et al., 2007). N2O from soils and N inputs to crop and soil
systems is the most important GHG considered in agriculture although CO2 is generally the
major GHG issue for the global economy (Snyder et al., 2009). As noted earlier however, the amounts of all the 3 major GHGs; CO2, N2O and CH4 released through agricultural activities are
significant.
Globally, the agricultural sector contributes about 45-50% of global anthropogenic CH4
emissions (i.e. enteric fermentation, cultivation of rice in wetlands, animal waste decomposition) and 20-70% of global anthropogenic N2O emissions (i.e. biomass burning, use of synthetic and
manure fertilizers, manure deposition, agricultural soils). In various ways, factors such as land use changes, crops and cropping systems also have effects on weather elements (Pitesky and Stackhouse, 2009; Verge et al., 2006). Livestock production contributes highly to CH4 emissions
with an estimation of 20-34% of all CH4 produced around the globe from enteric fermentation
and animal waste storage while contributing about 94 Tg of N in manure yearly, a magnitude similar to N from fertilizers (Johnson et al., 2007). Between 1990 and 2005, GHG emissions resultant from agricultural emissions increased by 14% (table 2), with annual emission on the average of 49 Mt CO2-eq. per year. The greatest increase in emissions from agricultural sources
were from N2O from soils, N2O from manure management, and CH4 from enteric fermentation which showed increases of 21%, 18% and 12% respectively (Smith et al., 2005). Within this same period however, N2O and CH4 emissions released from burning of biomass decreased by
respective values of 8% and 6%.
In 2005 alone, agriculture is said to have accounted for about 14% of the total estimated global emission of non-CO2 GHGs of 5969 Mt CO2 -eq. per year while contributing to 47% and 84% of
28
Smith et al. (2007). N2O emissions from soil and CH4 from enteric fermentation were the highest
contributors to the total non-CO2 emissions in 2005 contributing 44% and 31% respectively.
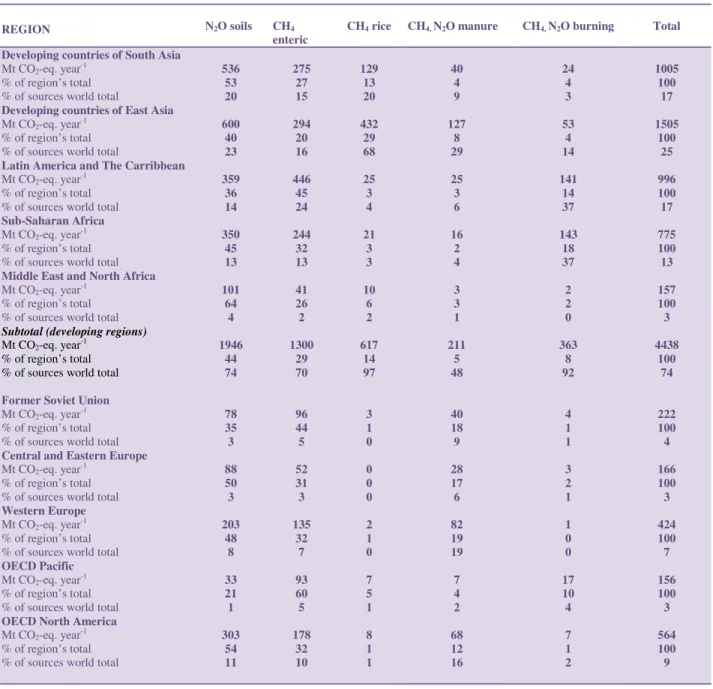
Both the magnitude of emissions and the relative importance of the different sources show a wide variation among the different world regions (table 3). According to Smith et al. (2007), 74% of the total agricultural emissions in 2005 were contributed by a group of five regions consisting predominantly of non-Annex I countries with developing countries in East Asia emitting about 25% of the world total.
Table 3: Contribution of GHGs from different sectors of agriculture in 2005 as by different regions of the world (Redrawn from Smith et al., 2007)
REGION N2O soils CH4
enteric
CH4 rice CH4, N2O manure CH4, N2O burning Total
Developing countries of South Asia
Mt CO2-eq. year-1 % of region’s total % of sources world total
Developing countries of East Asia
Mt CO2-eq. year-1 % of region’s total % of sources world total
Latin America and The Carribbean
Mt CO2-eq. year-1 % of region’s total % of sources world total
Sub-Saharan Africa
Mt CO2-eq. year-1 % of region’s total % of sources world total
Middle East and North Africa
Mt CO2-eq. year-1 % of region’s total % of sources world total
Subtotal (developing regions)
Mt CO2-eq. year-1
% of region’s total % of sources world total Former Soviet Union
Mt CO2-eq. year-1 % of region’s total % of sources world total
Central and Eastern Europe
Mt CO2-eq. year-1 % of region’s total % of sources world total
Western Europe
Mt CO2-eq. year-1 % of region’s total % of sources world total
OECD Pacific
Mt CO2-eq. year-1 % of region’s total % of sources world total
OECD North America
Mt CO2-eq. year-1 % of region’s total % of sources world total
536 53 20 600 40 23 359 36 14 350 45 13 101 64 4 1946 44 74 78 35 3 88 50 3 203 48 8 33 21 1 303 54 11 275 27 15 294 20 16 446 45 24 244 32 13 41 26 2 1300 29 70 96 44 5 52 31 3 135 32 7 93 60 5 178 32 10 129 13 20 432 29 68 25 3 4 21 3 3 10 6 2 617 14 97 3 1 0 0 0 0 2 1 0 7 5 1 8 1 1 40 4 9 127 8 29 25 3 6 16 2 4 3 3 1 211 5 48 40 18 9 28 17 6 82 19 19 7 4 2 68 12 16 24 4 3 53 4 14 141 14 37 143 18 37 2 2 0 363 8 92 4 1 1 3 2 1 1 0 0 17 10 4 7 1 2 1005 100 17 1505 100 25 996 100 17 775 100 13 157 100 3 4438 100 74 222 100 4 166 100 3 424 100 7 156 100 3 564 100 9
29
Subtotal (developed regions)
Mt CO2-eq. year-1
% of region’s total % of sources world total
TOTAL
Mt CO2-eq. year-1 % of region’s total % of sources world total
700 46 26 2646 44 100 554 36 30 1854 31 100 20 1 3 637 11 100 225 15 52 436 7 100 32 2 8 395 7 100 1531 100 26 5969 100 100
This falls in line with an assertion made by Pitesky and Stackhouse (2009) who stated that two-thirds of all anthropogenic agricultural GHG emissions is from the developing world. In their study, it was indicated that six out of the 10 world regions grouped, N2O from soils (primarily
due to fertilizer and manure application) was the primary source of GHGs which is almost as the seven out of 10 by Smith et al. (2007).
Many programs have been initiated to reduce the amount of GHGs from agricultural systems and considerable progress has been made so far in reducing emissions per unit product (Desjardins, 2010; Popp et al., 2010). Despite this progress, the total amount of GHGs from agriculture is still on the rise due to a continually growing food and energy demand from a constantly growing global population, hence failure in reducing the impact of agriculture on the environment.
Increase in population in the forthcoming decades will prompt an increase in demand of food demands (Verge et al., 2006). The US-EPA forecasted an accelerated global agricultural GHG emission for the period 2005-2020 compared to 1990-2005 (table 2) (Smith et al., 2007). N2O
emissions from agricultural sources forecasted to rise by 35-60% by 2030 due to increased adoption of N fertilizer use and production of animal manure. Global livestock-related CH4
production is also projected to increase by 60% in the year 2030. Agricultural CO2 emissions
from land use change may however be on the decline to the year 2030 (Smith et al., 2007).
Based on expected food consumption and demand levels, total GHG emissions from agriculture between the years 2000 and 2030 is expected to increase by about 50% (Verge et al., 2006). In the coming decades, the group of regions with the largest share of global agriculture GHG emissions, those with developing countries are also expected to have the largest increase in emissions (table 2) (Smith et al., 2007). Asia is and will be expected to remain the largest food consumer and the largest source of agricultural GHGs through the coming decades based on the year 2000 consumption levels (table 4 and 5) (Verge et al., 2006).
30
Table 4: Regional food consumption in total (109 KJ day-1) and per capita (KJ capita-1day-1) (Redrawn from
Verge et al., 2006)
Year Africa Asia South America North and Central America SW Pacific Europe
2000 Total Per capita 2015 Total Per capita 2030 Total Per capita 8.7 11.0 11.7 (34%) 10.9 16.7 (92%) 12.0 44.0 11.7 52.8 (20%) 12.0 62.4 (42%) 12.7 4.0 11.4 5.0 (25%) 12.0 6.3 (58%) 13.3 6.7 13.7 7.5 (12%) 13.1 8.4 (25%) 13.0 3.3 12.4 3.8 (15%) 12.0 4.2 (27%) 11.9 9.2 12.9 8.8 (-4%) 12.6 8.4 (-9%) 12.5
Table 5: Current and projected regional GHG emissions (Redrawn from Verge et al., 2006)
Year Africa Asia South
America
North and Central
America SW Pacific Europe
2000
Total GHG (Tg CO2-eq.)
Total GHG per capita (kg CO2-eq.)
2015
Total GHG (Tg CO2-eq.)
Total GHG per capita (kg CO2-eq.)
2030
Total GHG (Tg CO2-eq.)
Total GHG per capita (kg CO2-eq.)
626 787 796 734 1422 1017 2670 723 3203 731 3788 773 757 2180 966 2313 1207 2558 713 1459 789 1373 877 1356 264 994 296 936 329 929 626 878 594 849 566 841
Based on the 2000 consumption levels, the highest increase in food demand will however occur in the African and South American region (table 4) leading to very high GHGs release into the atmosphere (table 5) (Verge et al., 2006). This is consistent with an observation by Smith et al. (2007) who stated that the Middle East and Africa were expected to experience the highest growth during 1990-2020 with a 72% combined increase in their emissions.
31
3.8. REDUCING EMISSIONS IN PRODUCTIVE AGRICULTURE
Agriculture has been proven to be a primary source of all the three major GHGs; CO2, N2O and
CH4 and increase in food demand and diet shift as projected would escalate annual emissions
even further. This is especially true for the sub-Saharan region whose increase in food demand in the coming decades will be exponentially high and therefore will likely result in the adoption of more fertilizer use in the intensification of agriculture and expansion into unexploited areas (Smith et al., 2007; van Beek et al., 2010; Verge et al., 2006).
There is a need for new and improved production techniques and mitigation strategies to be made to farmers especially in the sub-Saharan region to reduce the impact of the agri-food sector on climate as several possibilities exist to increase yields, reduce emissions and land use change resulting from agricultural expansion in the tropics, which easily result in land degradation (Verge et al., 2006). Recent studies and observations as in the European region have demonstrated the potential of mitigation in agricultural systems (Smith et al., 2007). Mitigation measures have the potential to reduce emissions from agriculture by 30-85% depending on the effectiveness of measures for a specific farming system (van Beek et al., 2010), the local and regional meteorological and soil conditions (Pitesky and Stackhouse, 2009). Similarly, Verge et al. (2006) estimated mitigation techniques have the potential to reduce radiative forcing by agriculture between 1.2-3.3 Pg CO2-eq per year. Despite this positive outlook however, previous
studies have shown that less than 30% of the total biophysical potential for agriculture GHG mitigation might be achieved around the world by the year 2030 due to price and non-price related barriers to implementation of mitigation strategies and therefore the need remove these barriers through creative policies (Smith et al., 2007).
Reduction of GHG emissions in agriculture will primarily be achieved from improved land management practices, efficient management of fertilizer and practices that will take advantage of existing organic matter supplies for example returning manure to the field to help increase crop yields while improving pasture (Verge et al., 2006). Many management practices such as; agro-forestry, crop management, tillage/residue management, nutrient management, rice management, water management, manure/ biosolid management, grazing land management/pasture improvement, management of organic soils, land restoration, bio-energy
32
crops, enhanced energy efficiency, livestock management (improved feeding practices, specific agents and dietary additives, longer term structural and management changes, and breeding), increased C storage in products, and reduced biomass burning have the potential to affect GHG emissions directly by affecting NO3- availability or indirectly by modifying the soil microclimate
and the cycling process of C and N (Smith et al., 2007; Smith et al., 2011, van Bleek et al., 2007).
Some of the above practices have wide applicability and others would have to be considered for regional application. Below summarizes some practices with the potential to reduce GHG emissions from agriculture while increasing productivity.
3.8.1. Carbon Sequestration
Historically, agriculture has been a major contributor to CO2 in the atmosphere and still remains
a substantive contributor following up after fossil fuel combustion. Strides have been made to reverse the process and make agriculture a net sink via C sequestration instead of a net contributor (Verge et al., 2006) since studies have shown that agriculture has the potential to reduce CO2 emissions and the lands can sequester CO2 as organic matter (Snyder et al., 2009).
Sequestration of C is the net transfer of atmospheric CO2 into long-lived C-pools (Johnson et al.,
2007) and it is considered as the main option for mitigating climate change as long as agriculture is concerned (Desjardins, 2010). Due to the very high depletion of soil C-stocks by farming, agricultural soils from around the globe are estimated to have room for sinking 30 to 90 Pg C over the next century (Desjardins, 2010). This sequestration of soil organic carbon (SOC) has the potential to offset about 15% of global CO2 emissions as estimated by Lal (2007) referenced in
Johnson et al. (2007). According to Snyder et al. (2009), there is a potential for high-yield agriculture to increase annual input of crop residue C to soils as a carbon isotope studies with corn in Ontario by Gregorich and Drury (1996) showed that a 35-year fertilization period led to a higher level of corn-derived C in soil while the native soil C level was the same as in unfertilized soil.
Beyond the obvious target of offsetting CO2 emissions, Johnson et al. (2007) states that there are
other benefits associated with C-sequestration in forest and agricultural soils. Improved soil quality (water infiltration, water-holding capacity, aeration, bulk density, penetration resistance