Rapport 9 - 2013
Proficiency Testing
Drinking Water Microbiology
- March 2013
Internal and external control for microbiological analyses of food and drinking water
All analytical activities require work of a high standard that is accurately documented. For this purpose, most laboratories carry out some form of internal quality assurance, but their analytical work also has to be evaluated by an independent party. Such external quality control of laboratory competence is commonly required by accreditation bodies and can be done by taking part in proficiency testing (PT) schemes.
In a proficiency test, identical test material is analysed by a number of laboratories using their routine methods. The laboratories report their results and to the organiser that evaluates them and compiles them in a report.
The National Food Agency’s PT program offers
External and independent evaluation of laboratories analytical competence. Improved knowledge of analytical methods used by laboratories with respect to
various types of organisms. Expert support
Tool for inspections regarding accreditation. Free extra material for follow-up analyses
For more information visit our website: www.slv.se/absint
The National Food Agency’s reference material
As a complement to the proficiency testing, National Food Agency also produces reference material (RM) for internal quality control: a total of 7 RM for food and drinking water microbiological analyses, including pathogens, are available.
Information available on our website: www.slv.se/RM
Edition
Version 1 (2013-06-17)
Editor in chief
Annika Rimland, Head of Science Department, National Food Agency
Responsible for the scheme
Tommy Šlapokas, Microbiologist, Microbiology Division, National Food Agency
Proficiency testing
Drinking Water Microbiology
March 2013
Coliform bacteria and Escherichia coli with membrane filter method (MF) Coliform bacteria and Escherichia coli, (rapid methods with MPN)
Clostridium perfringens with MF
Moulds with MF Yeasts with MF
Culturable microorganisms (total count) 3 days incubation at 22±2 °C
Tommy Šlapokas 1
Kirsi Mykkänen 1,2
Abbreviations and explanations
Common media in text and/or tables
LES m-Endo Agar LES (according to SS 028167)
LTTC m-Lactose TTC Agar with Tergitol (acc.to EN-ISO 9308-:2000) m-FC m-FC Agar (acc. to SS 028167)
PAB/TSC/SFP Tryptose Sulfite Cycloserine Agar (acc. to ISO/CD 6461-2:2002) RBCC Rose Bengal Agar with both chlortetracycline and chloramphenicol (acc.
to SS 028192)
YeA Yeast extract Agar (acc. to EN ISO 6222:1999) CCA Chromocult Coliform Agar® (Merck)
Colilert Colilert® Quanti-Tray® (IDEXX Inc.)
Other abbreviations
MF Membrane filter (method)
MPN ”Most Probable Number” (quantification based on statistical distributions) ISO "International Organization for Standardization" and their standards EN European standard from "Comité Européen de Normalistion" (CEN) NMKL "Nordisk Metodikkomité for næringsmidler" and their standards
DS, NS, SFS, SS National standards from Denmark, Norway, Finland and Sweden
Method tables for the analysis parameters
Tot n total number of laboratories that reported methods and numerical results n number of results except false results and outliers
Mv mean value (with deviating results excluded) Med median value (with deviating results included)
CV coefficient of variation = relative standard deviation in percentage of the mean, calculated from square root transformed results
F number of false positive or false negative results < number of low outliers
> number of high outliers global results for the analysis remarkably low result
remarkably high result or CV or many deviating results
278 601
Contents
Abbreviations and legends ... 2
General information on results evaluation ... 4
Results of the PT round March 2013 ... 4
- General outcome ... 4
- Coliform bacteria (MF) ... 6
- Suspected thermo-tolerant coliform bacteria (MF) ... 8
- Escherichia coli (MF) ... 9
- Coliform bacteria and E. coli (rapid method, MPN) ... 12
- Clostridium perfringens (MF) ... 14
- Moulds and yeasts (MF) ... 16
- Culturable microorganisms 22 °C, 3 days ... 18
Outcome of the results and laboratory assessment ... 20
- General information about reported results ... 20
- Assessment of the performance ... 20
- Z-scores, box plots and deviating results for each laboratory ... 20
Test material, quality control and processing of data ... 24
- Test material and its content ... 24
- Quality control of the mixtures ... 24
- Processing of numerical results ... 25
- Processing of methods data ... 26
References ... 27
Annex A – All reported results ... 28
Annex B – Z-scores of the results ... 32
General information on results evaluation
The percentages of false results and outliers are compiled in table 1. These deviating results are excluded in most calculations. Descriptions of the histograms and calculation of outliers are mentioned briefly in the section "Evaluation of numerical results" at the end of this report and more detailed in the scheme protocol (1).
The proficiency testing program organised by the National Food Agency is accredited according to EN ISO/IEC 17043. Because it states that results might be grouped based on the method used, it is mandatory for participants to give such information. Results for various method groups are now accounted for per parameter. The method information gathered is not always easy to interpret. Sometimes there is no consistency between the standard referred to and the information given regarding various method details. Results from laboratories with ambiguous details are either excluded from or placed in the group "Other/Unknown" in the tables, together with results from methods used only by some individual laboratories.
Outliers and false results are not included in the calculation of mean value and measure of dispersion for the various method groups. The numbers of low and high outliers, as well as false results, are instead explicitly given in various tables together with the group means etc. The measure of dispersion is not shown for groups with less than 7 results, except when there are only two groups to compare results for.
Results of the PT round March 2013
General outcome
Test items were sent to 100 laboratories, 35 in Sweden, 52 in other Nordic countries and 13 in other countries. 95 laboratories reported results.
Microorganisms and parameters of analyses are given in table 1. For the MF analyses the parameters suspected colonies of coliform bacteria on primary media for quantification could be reported as well. The results from suspected colonies are only used as basis for interpretations and discussions.
All reported results are compiled in annex A. Individual results for each laboratory are also shown on our website after logging in (www.slv.se/absint).
Standardized z-scores for all evaluated results are given in annex B and photographs with examples of colony appearance on various media are presented in annex C. Interpretation of laboratory performance is described after all analytical parameters and illustrated by a box plot together with the number of deviating results for each laboratory.
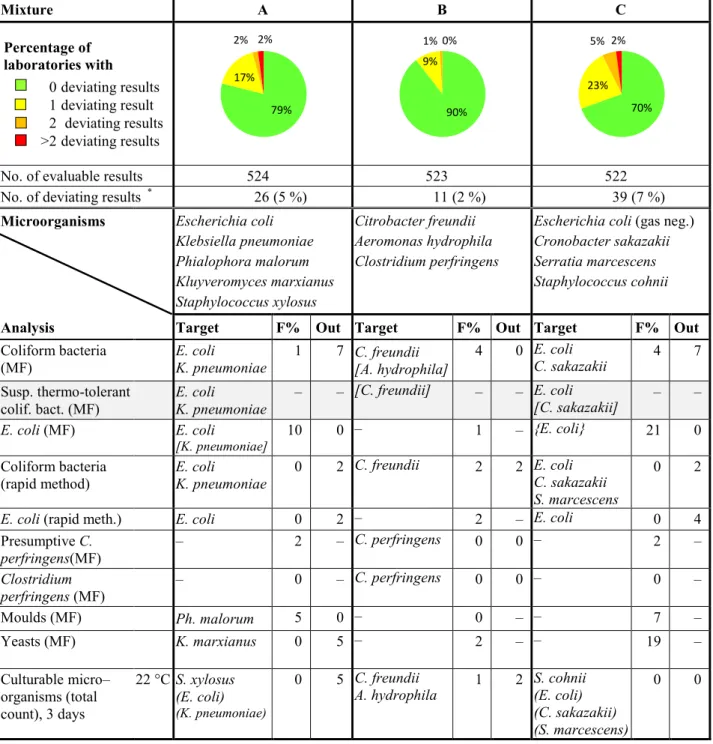
Table 1 Microorganisms in each mixture and percentages of deviating results (F%: false positive
or false negative, Out: outliers)
Mixture A B C Percentage of laboratories with 0 deviating results 1 deviating result 2 deviating results >2 deviating results
No. of evaluable results 524 523 522
No. of deviating results * 26 (5 %) 11 (2 %) 39 (7 %)
Microorganisms Escherichia coli Klebsiella pneumoniae Phialophora malorum Kluyveromyces marxianus Staphylococcus xylosus Citrobacter freundii Aeromonas hydrophila Clostridium perfringens
Escherichia coli (gas neg.) Cronobacter sakazakii Serratia marcescens Staphylococcus cohnii
Analysis Target F% Out Target F% Out Target F% Out
Coliform bacteria
(MF) E. coli K. pneumoniae 1 7 C. freundii [A. hydrophila] 4 0 E. coli C. sakazakii 4 7
Susp. thermo-tolerant
colif. bact. (MF) E. coli K. pneumoniae – – [C. freundii] – – E. coli [C. sakazakii] – –
E. coli (MF) E. coli
[K. pneumoniae] 10 0 – 1 – {E. coli} 21 0
Coliform bacteria
(rapid method) E. coli K. pneumoniae 0 2 C. freundii 2 2 E. coli C. sakazakii
S. marcescens
0 2
E. coli (rapid meth.) E. coli 0 2 – 2 – E. coli 0 4 Presumptive C. perfringens(MF) – 2 – C. perfringens 0 0 – 2 – Clostridium perfringens (MF) – 0 – C. perfringens 0 0 – 0 – Moulds (MF) Ph. malorum 5 0 – 0 – – 7 – Yeasts (MF) K. marxianus 0 5 – 2 – – 19 – Culturable micro– organisms (total count), 3 days 22 °C S. xylosus (E. coli) (K. pneumoniae) 0 5 C. freundii
A. hydrophila 1 2 S. cohnii (E. coli) (C. sakazakii) (S. marcescens)
0 0
* In total 44 out of 95 laboratories (46%) reported at least one deviating result – Organism or numerical result is missing
( ) The organism contributes with only very few colonies [ ] The organism is false positive on the primary growth medium
{ } The organism may give different results depending on the methods or definitions used 79% 17% 2% 2% 90% 9% 1% 0% 70% 23% 5% 2%
Coliform bacteria (MF)
Even though the reporting of method data happened not to be mandatory for the analysis of coliform bacteria, most of the laboratories did report it. In those cases where method data was missing, we have used the data valid for the laboratory during their last participation to a PT round – after giving the laboratories possibility to change it.
Medium Tot A B C
n n Mv CV F < > n Mv CV F < > n Mv CV F < >
Total 75 69 25 15 1 1 4 72 1395 25 3 0 0 67 48 12 3 5 0
m-Endo Agar LES 57 55 26 15 1 1 0 56 1500 22 1 0 0 51 49 11 2 4 0
Lactose TTC Agar 13 9 21 17 0 0 4 11 1171 33 2 0 0 13 45 15 0 0 0 Chromocult C Agar 1 1 27 – 0 0 0 1 200 – 0 0 0 1 54 – 0 0 0 Other/Unknown 4 4 23 – 0 0 0 4 1050 – 0 0 0 2 46 – 1 1 0 25 ↓ 0 3 6 9 12 15 0 10 20 30 40 50 60 70 80 90 100 Coliform bacteriea 35/36/37 °C (MF) Without remark False negative Outliers N o. of re su lts
No. of colonies per 100 ml
* 25 ↓ 0 3 6 9 12 15 0 10 20 30 40 50 60 70 80 90 100 Coliform bacteria 35/36/37 °C (MF)
m-Endo Agar LES Lactose TTC Agar Chromocult Coliform Agar Other/Unknown N o. of re su lts
No. of colonies per 100 ml
* 1395 ↓ 0 3 6 9 12 15 0 500 1000 1500 2000 2500 3000 3500 4000 4500 5000 Coliform bacteriea 35/36/37 °C (MF) N o. of re su lts
No. of colonies per 100 ml
1395 ↓ 0 3 6 9 12 15 0 500 1000 1500 2000 2500 3000 3500 4000 4500 5000 Coliform bacteria 35/36/37 °C (MF) N o. of re su lts
No. of colonies per 100 ml
48 ↓ 0 3 6 9 12 15 0 10 20 30 40 50 60 70 80 90 100 Coliform bacteriea 35/36/37 °C (MF) N o. of re su lts
No. of colonies per 100 ml
0 3 6 9 12 15 0 10 20 30 40 50 60 70 80 90 100 Coliform bacteria 35/36/37 °C (MF) N o. of re su lts
No. of colonies per 100 ml
48 ↓ A
B
In a few cases when the primary medium reported was not the one prescribed in the standard referred to, we have assumed the medium to be correct. The medium Endo Agar reported by some participants is here included in m-Endo Agar LES (LES). From the table it is clear that more than 4 times as many laboratories are using LES compared to LTTC. The results indicate somewhat lower results with LTTC than with LES, for all mixtures. The dispersion, and thus the uncertainty, is simultaneously somewhat higher for LTTC. It is difficult to find clear differences, although there are tails with low results in both mixture B and C.
Mixture A
- E. coli and K. pneumoniae form colonies in the analysis of coliform bacteria. The colonies are typical with a metallic sheen on LES. The reading of colonies is a bit more difficult on LTTC at 37 °C because S. xylosus grows as background. At least it was possible to count the target colonies from the volume 10 ml. As often, it was difficult to distinguish the yellow colour in the medium for individual colonies, as the whole medium turns yellow due to a lot of target colonies present. - All four high outliers were obtained with LTTC and might be due to the growth of
S. xylosus, although it forms atypical colonies. No particular problem based on
method seems otherwise to occur.
Mixture B
- The colonies of both C. freundii and A. hydrophila are typical for suspected coliform bacteria on both LES and LTTC, but with somewhat different appearance. The yellow colour beneath the colonies in LTTC is, as usual, difficult to distinguish.
- A. hydrophila is oxidase positive. The colonies can thus be excluded from coliform bacteria after confirmation by the oxidase test.
- A relatively large number of low results was obtained that could not be identified as outliers, with the exception of 3 false negative results. These low results cause a lower total mean value than when the rapid method Colilert Quanti-Tray® was
used. The low values might be caused by counting a smaller volume but forgetting to calculate the result for the volume 100 ml.
Mixture C
- The strains of E. coli, C. sakazakii and S. marcescens grow all on the media for coliform bacteria. S. marcescens ferment lactose badly and give rise to atypical colonies, i.e. green on LTTC and red on LES. That strain will most certainly not be included as suspected coliform bacterium on media based on lactose fermentation, and will not be selected for confirmation. The colonies of the other two strains are, however, typical for the various media. Negative oxidase tests will show that they are coliform bacteria.
- An unusually large number of deviating results were obtained without a clear cause.
Suspected thermo-tolerant coliform bacteria (MF)
The two most commonly used growth media are m-FC and LTTC. The incubation temperature is 44 or 44.5 °C. Here, results were separated based on the method standards most commonly used, to get a further division. They are EN ISO 9308-1 with LTTC and three standards with m-FC from the Nordic countries, namely SS 028167 from Sweden, SFS 4088 from Finland and NS 4792 from Norway. They were sometimes used a bit modified.
The table shows the medians instead of mean values because no outliers have been identified. The reason is that the analysis is not included in performance assessment.
Standard, Method Tot A B C
n n Med CV F < > n Med CV F < > n Med CV F < > Total 42 42 24 – – – – 42 0 – – – – 42 36 – – – – EN ISO 9308-1 6 6 20 – – – – 6 0 – – – – 6 37 – – – – SS 028167 13 13 27 – – – – 13 0 – – – – 13 33 – – – – SFS 4088 16 16 26 – – – – 16 0 – – – – 16 37 – – – – NS 4792 7 7 20 – – – – 7 0 – – – – 7 31 – – – – Other/Unknown 0 - - – – – – - - – – – – - - – – – –
The Swedish standard states incubation at 44 °C but one laboratory used 44.5 °C. The temperature 44 °C is also stated in EN ISO 9308-1. One laboratory using Norwegian standard has incubated at 44 °C while all the others have used 44.5 °C. All laboratories using Finnish standard reported 44 °C.
In both mixture A and C, a lower average was obtained by the 7 laboratories using Norwegian standard, NS 4792, compared to most other groups. Probably, it is caused by the fact that 6 of the laboratories incubated at 44.5 °C, since the average for the 7 laboratories incubating at 44.5 °C was 18 cfu/100 ml in mixture A and 27 cfu/100 ml in mixture C. For unknown reason, also laboratories using LTTC at 44 °C in mixture A obtained lower results than laboratories using m-FC with Swedish or Finnish standard.
Mixture A
- K. pneumoniae grows together with E. coli on m-FC at 44 °C but appears with more light blue colonies.
- Probably, the growth of K. pneumoniae is the most hampered at 44.5°C.
Mixture B
- No suspected thermo-tolerant coliform bacteria were present in the mixture.
Mixture C
- Beside the strain of E. coli, C. sakazakii grow with greyish colonies at 44 °C. It is not clear which strain is the most hampered at 44.5 °C.
Escherichia coli (MF)
E. coli is quantified after confirmation of colonies that have grown either at 36±2 °C
or at 44/44.5 °C. Different primary growth media are used at the two temperatures, LTTC or LES at the low temperature and LTTC or m-FC at the high temperature. The results from the two temperatures are here compiled in separate tables. In some cases, the incubation temperature stated for the primary growth medium was ambiguous. These results, as well as the deviating results for this group, are not specifically given but are only included in the table "All results".
E. coli was present in mixture A and C. The average of accepted results is lower for
LTTC than for LES in both these mixtures at 36±2 °C. Besides, there are 4 false negative results for LTTC in mixture A without any obvious reason. In mixture C there are more false negative results for LES than for LTTC, but here is a plausible explanation (see below under mixture A).
No method differences could be seen for any mixture at 44/44.5 °C. The numbers of results are too few. However, some false negative results were obtained.
All results Medium Tot A B C n n Mv CV F < > n Mv CV F < > n Mv CV F < > Total 77 69 12 20 8 0 0 76 0 – 1 – – 61 32 16 16 0 0 From 36±2 °C Medium Tot A B C n n Mv CV F < > n Mv CV F < > n Mv CV F < > Total 53 48 12 19 5 0 0 52 0 - 1 - - 43 33 17 10 0 0
m-Endo Agar LES 38 38 13 18 0 0 0 37 0 - 1 - - 31 35 17 7 0 0
Lactose TTC Agar 10 10 9 19 4 0 0 10 0 - 0 - - 9 29 18 1 0 0 Chromocult C Agar 1 2 0 – 0 0 0 1 0 – 0 - - 1 35 – 0 0 0 Other/Unknown 4 1 0 – 1 0 0 4 0 – 0 - - 2 29 – 2 0 0 From 44/44.5 °C Medium/Standard Tot A B C n n Mv CV F < > n Mv CV F < > n Mv CV F < > Total 12 11 10 15 1 0 0 12 0 - 0 - - 8 30 7 4 0 0 Medium m-FC Agar 8 8 11 17 0 0 0 8 0 - 0 - - 5 28 8 3 0 0 Lactose TTC Agar 4 3 9 6 1 0 0 4 0 – 0 - - 3 33 4 1 0 0 Other/Unknown 0 0 - – - – – 0 - – - - - 0 - – - - - Standard EN ISO 9308-1 4 3 9 – 1 0 0 4 0 – 0 - - 3 33 – 1 0 0 SS 028167 0 0 - – - – – 0 - – - - - 0 - – - - - SFS 4088 2 2 11 – 0 0 0 2 0 – 0 - - 2 26 – 0 0 0 NS 4792 4 4 9 – 0 0 0 4 0 – 0 - - 2 31 – 2 0 0 Other/Unknown 2 2 14 – 0 0 0 2 0 – 0 - - 1 25 – 1 0 0
Mixture A
- A confirmation step was needed irrespectively if E. coli was quantified from the primarily analysis at 36±2 or 44/44.5 °C. The strains of E. coli and K. pneumoniae grow at both temperatures. K. pneumoniae is excluded as presumptive E. coli due to its lack of indol production and β-glucuronidase activity.
- There is no clear reason to the 8 false negative results. Six of them are from LTTC. 12 ↓ 0 3 6 9 12 15 0 5 10 15 20 25 30 35 40 45 50 Escherichia coli (MF) N o. of re su lts
No. of colonies per 100 ml
Zero results ↓
12 (Without zero results) ↓ 0 3 6 9 12 15 0 5 10 15 20 25 30 35 40 45 50 Escherichia coli 35/36/37 °C (MF)
m-Endo Agar LES Laktos TTC agar Chromocult Coliform Agar Other/Unknown N o. of re su lts
No. of colonies per 100 ml
Zero results ↓
10 (Without zero results) ↓ 0 3 6 9 12 15 0 5 10 15 20 25 30 35 40 45 50 Escherichia coli 44/44,5 °C (MF) m-FC Agar Laktos TTC agar Other/Unknown N o. of re su lts
No. of colonies per 100 ml
Zero results ↓ 32 ↓ 0 3 6 9 12 15 0 10 20 30 40 50 60 70 80 90 100 Escherichia coli (MF) N o. of re su lts
No. of colonies per 100 ml
← 16 zero results
33 (Without zero results) ↓ 0 3 6 9 12 15 0 10 20 30 40 50 60 70 80 90 100 Escherichia coli 35/36/37 °C (MF) N o. of re su lts
No. of colonies per 100 ml
Zero results ↓
30 (Without zero results) ↓ 0 3 6 9 12 15 0 10 20 30 40 50 60 70 80 90 100 Escherichia coli 44/44,5 °C (MF) N o. of re su lts
No. of colonies per 100 ml
Zero results ↓
A
Mixture B
- No E. coli was included in the mixture.
Mixture C
- Confirmation is needed when E. coli is quantified from the primary analysis at 36±2 °C. Both the strain of E. coli and C. sakazakii grow as typical coliform bacteria. C. sakazakii will be excluded as presumptive E. coli due to its lack of indol production and β-glucuronidase activity.
- Both strains will also grow at 44/44.5 °C but the colonies of C. sakazakii are atypical, greyish on m-FC. Colonies of C. sakazakii suspected as presumptive E.
coli, e.g. on LTTC, will be excluded after confirmation, as described above.
- The strain of E. coli present does not produce gas while fermenting lactose. 31 laboratories reported that they have used gas production test in the confirmation step. 13 of these have reported a zero result together with three laboratories not stating the use of gas production test. This is the explanation to the majority of the 16 zero results.
- If gas production is a criterion for E. coli, the zero results based on the lack of gas production should not be reckoned as false negative ones.
- It seems that18 of the 31 laboratories reporting the use of gas production did not use the test result as a confirmation criterion for E. coli.
Coliform bacteria & E. coli (rapid method, MPN)
The rapid method used for both these parameters was almost exclusively Colilert®
Quanti-Tray® from the manufacturer IDEXX Inc. Two laboratories have not used a
rapid method but the classical multiple tube method with MPN quantification (Standard Methods 9221B; 5). Of the 53 laboratories that reported Colilert some used the trays with 51 wells, while others used trays with 97 wells (a few of which, probably incorrectly, have reported 96 wells). Only one laboratory did not indicate
which kind of trays they used. The laboratories have often analysed both diluted and undiluted samples.
Neither for coliform bacteria nor for E. coli were differences obvious in any of the mixtures based on the trays used. Only 1–2 deviating result were reported per mixture.
Coliform bacteria, Rapid method with MPN
Medium Tot A B C
n n Mv CV F < > n Mv CV F < > n Mv CV F < >
Total, Rapid meth. 55 54 28 11 0 0 1 53 1684 13 1 1 0 54 65 9 0 0 1
Colilert Quanti-51 13 13 31 11 0 0 0 13 1539 12 0 0 0 13 64 11 0 0 0
Colilert Quanti-97 39 38 27 10 0 0 1 38 1742 13 1 0 0 38 66 9 0 0 1
Colilert Quanti-? 1 1 35 - 0 0 0 1 1730 - 0 0 0 1 56 - 0 0 0
Other/Unknown 2 2 34 – 0 0 0 1 1400 – 0 1 0 2 57 – 0 0 0
Not rapid method 2 2 28 – 0 0 0 2 920 – 0 0 0 2 55 – 0 0 0
E. coli, Rapid method with MPN
Medium Tot A B C
n n Mv CV F < > n Mv CV F < > n Mv CV F < >
Total, Rapid meth. 56 55 13 15 0 0 1 55 0 – 1 – – 54 35 10 0 1 1
Colilert Quanti-51 14 14 15 18 0 0 0 14 0 – 0 – – 14 33 9 0 0 0
Colilert Quanti-97 39 38 13 14 0 0 1 38 0 – 1 – – 37 35 10 0 1 1
Colilert Quanti-? 1 1 12 – 0 0 0 1 0 – 0 – – 1 37 – 0 0 0
Other/Unknown 2 2 14 – 0 0 0 2 0 – 0 – – 2 35 – 0 0 0
Not rapid method 2 1 17 - 0 0 0 2 0 - 0 - - 1 22 - 0 0 0
28 ↓ 0 3 6 9 12 15 0 10 20 30 40 50 60 70 80 90 100
Coliform bacteria (rapid method, MPN)
N o. of re su lts MPN-index per 100 ml 13 ↓ 0 3 6 9 12 15 0 5 10 15 20 25 30 35 40 45 50
Escherichia coli (rapid method, MPN)
N o. of re su lts MPN-index per 100 ml A
Mixture A
- Both E. coli and K. pneumoniae are typical coliform bacteria, producing β-galactosidase and detected by methods based on the activity of this enzyme (ONPG positive), e.g. Colilert®-18/24 Quanti-Tray® where ONPG is a substrate.
- Only the E. coli strain produces β-glucuronidase and is detected as E. coli by methods based on the activity of this enzyme.
- The average results for both coliform bacteria and E. coli were slightly higher with Colilert®-18/24 Quanti-Tray® compared to with the MF-method and had fewer deviating results, as is often the case.
Mixture B
- C. freundii was detected as a coliform bacterium based on the activity of the enzyme β-galactosidase. The growth of A. hydrophila is inhibited by the antibiotics in the medium. The average result was somewhat higher with Colilert compared to the MF-method.
- No E. coli was present in the mixture. One false positive result was reported.
Mixture C
- All the strains E. coli, C. sakazakii and S. marcescens produce the enzyme β-galactosidase and contribute to the result of coliform bacteria obtained with Colilert®-18/24 Quanti-Tray®. The average for coliform bacteria was therefore clearly higher with this method (65 cfu/100 ml) than with the MF-method (48 cfu/100 ml), where S. marcescens is not reckoned as a coliform bacterium.
- Only the E. coli strain in the mixture is β-glucuronidase positive, and is detected as E. coli with Colilert®-18/24 Quanti-Tray®. The average for accepted values is
0 3 6 9 12 15 0 500 1000 1500 2000 2500 3000 3500 4000 4500 5000
Coliform bacteria (rapid method, MPN)
N o. of re su lts MPN-index per 100 ml 1653 ↓ 65 ↓ 0 3 6 9 12 15 0 15 30 45 60 75 90 105 120 135 150
Coliform bacteria (rapid method, MPN)
N o. of re su lts MPN-index per 100 ml * 34 ↓ 0 3 6 9 12 15 0 10 20 30 40 50 60 70 80 90 100
Escherichia coli (rapid method, MPN)
N o. of re su lts MPN-index per 100 ml B C
Clostridium perfringens (MF)
The analysis of Clostridium perfringens is performed differently in different countries and laboratories, because no international standard is stated as reference method in the European Drinking Water Directive (4). The parameter to be analysed according to the directive is spores and vegetative cells of C. perfringens. In Sweden, the result of presumptive C. perfringens is also often accepted and therefore accounted for separately.
There is one method explicitly described in the Drinking water directive (4), the use of m-CP Agar incubated at 44 °C. The method includes a confirmation step with ammonia vapour, where a red coloration of colonies indicates C. perfringens. Due to the hesitation in many countries to use this method, the use of a standard still under process (ISO/CD 6461-2:2002-12-20, CD = Committee Draft) was accepted by the responsible group under the EU Commission., Adjustments in the draft approved in ISO meetings have been pointed out in the instructions for the proficiency testing round. The standard has now the number ISO/DIS 14189 (DIS = Draft International Standard) and should be finally established in 2013 with the number ISO 14189. It is basically equivalent to the CD version from 2002 after adjustments but has now a much more simplified confirmation step. In the new version, isolated colonies are only tested for activity of the enzyme acid phosphatase.
Some other methods/media were used by individual participants, such as the Danish standard DS 2256 with Iron Sulfite agar and EN ISO 26461-2:1993 for analysis of spores only (heating of the sample). The last method has the same base medium (PAB/TSC) as in ISO/CD 6461-2 and ISO/DIS 14189, but without any confirmation. Both presumptive C. perfringens and C. perfringens analyses show that the yield with m-CP Agar is much lower with the strain present in the mixture compared with other media. The histograms show that the low results are almost exclusively obtained with m-CP Agar. Very few results were present for m-CP Agar with concentration as for PAB/TSC/SFP.
Presumptive Clostridium perfringens MF
Medium Tot A B C
n n Mv CV F < > n Mv CV F < > n Mv CV F < >
Total 45 44 0 – 1 – – 45 874 36 0 0 0 44 0 – 1 – –
PAB/TSC/SFP agar 32 31 0 1 - - 32 1185 14 0 0 0 31 0 1 - -
m-CP agar 12 12 0 – 0 - - 12 254 65 0 0 0 12 0 – 0 - -
Iron Sulfite agar 1 1 0 – 0 - - 1 1400 – 0 0 0 1 0 – 0 - -
Clostridium perfringens MF Medium Tot A B C n n Mv CV F < > n Mv CV F < > n Mv CV F < > Total 35 35 0 – 0 – – 35 723 44 0 0 0 35 0 – 0 – – PAB/TSC/SFP agar 17 17 0 - 0 - - 17 1183 14 0 0 0 17 0 - 0 - - m-CP agar 17 17 0 – 0 - - 17 352 61 0 0 0 17 0 – 0 - -
Mixture A and C
- No C. perfringens or other presumptive C. perfringens was present in the mixture.
Mixture B
- A strain of C. perfringens was present. Different results were obtained depending on the method used (see tables and figures).
- The colour of the colonies with PAB/TSC/SFP may vary from light grey or yellowish-brown to completely black, at least partly depending on the condition of the medium and its reduction potential.
- The distribution of the results is very wide and atypical compared to other parameters. Because of this it is almost impossible to identify outliers. However,
the results obtained with PAB/TSC/SFP only are better distributed.
- In comparison with PAB/TSC/SFP, most results obtained with m-CP Agar and the
C. perfringens strain present can be considered as abnormally low.
874 ↓ 0 2 4 6 8 10 0 250 500 750 1000 1250 1500 1750 2000 2250 2500
Presumptive Clostridium perfringens (MF)
Too low results ?
N o. of re su lts
No. of colonies per 100 ml
874 ↓ 0 2 4 6 8 10 0 250 500 750 1000 1250 1500 1750 2000 2250 2500
Presumptive Clostridium perfringens (MF)
PAB/TSC/SFP agar m-CP agar Iron Sulfite agar
N o. of re su lts
No. of colonies per 100 ml
723 ↓ 0 2 4 6 8 10 0 250 500 750 1000 1250 1500 1750 2000 2250 2500 Clostridium perfringens (MF) N o. of re su lts
No. of colonies per 100 ml
723 ↓ 0 2 4 6 8 10 0 250 500 750 1000 1250 1500 1750 2000 2250 2500 Clostridium perfringens (MF) N o. of re su lts
No. of colonies per 100 ml
B
Moulds and yeasts (MF)
Out of the 43 laboratories that analysed moulds and yeasts, 35 reported the use of the Swedish standard SS 028192. Besides Sweden it is used in Denmark but also in Finland and Norway under their own national designations SFS 5507 and NS 4716, respectively. Eight laboratories used other methods, such as a food method from NMKL and a method in Standard Methods of Water and Wastewater (5).
Various names, some appropriate and other probably inappropriate, were reported for the media linked to the use of SS 028192. These are "Cooke Rose Bengal" agar, "Rose Bengal Chloramphenicol" (RBC) agar and "Dichloran Rose Bengal Chloramphenicol" (DRBC) agar. According to the standard dichloran should not be an ingredient (and thus DRBC should not be used) but instead Rose Bengal and the two stronger inhibitory substances chlortetracycline and chloramphenicol are authorized. Sometimes only one of them are reported as used, which then is in accordance with what is recommended from manufacturers of the respective medium. Many laboratories using a commercial medium in which Rose Bengal is included have not reported the use of Rose Bengal. What are base medium and supplements compared to finished medium? The information given for the media and inhibitors used are in many cases not clear. The Swedish laboratories are usually using chlortetracycline and chloramphenicol together in the Rose Bengal agar, as is stated in the standard SS 028192. This medium is here designated RBCC agar from the English spelling of the characteristic ingredients.
Some unusual media such as Dichloran Glycerol 18% (DG 18) and "Malt Extract Agar" (MEA) were used together with some odd methods. The standard ISO 7954 (1987) use the medium Glucose Yeast Extract agar with Oxytetracycline as inhibiting substance (OGYE).
Moulds MF
Standard, Method Tot A B C
n n Mv CV F < > n Mv CV F < > n Mv CV F < > Total 43 41 39 37 2 0 0 42 0 – 0 – – 39 0 – 3 – – SS 028192 35 35 36 39 0 0 0 34 0 – 0 – – 31 0 – 3 – – ISO 7954 (1987) 3 2 72 7 1 0 0 3 0 – 0 – – 3 0 – 0 – – Standard methods 1 0 - - 1 - - 1 0 – 0 – – 1 0 – 0 – – NMKL 98, Modif. 2 2 65 – 0 0 0 2 0 – 0 – – 2 0 – 0 – – Other/Unknown 2 2 38 – 0 0 0 2 0 – 0 – – 2 0 – 0 – – Yeasts MF
Standard, Method Tot A B C
n n Mv CV F < > n Mv CV F < > n Mv CV F < > Total 43 41 178 10 0 2 0 41 0 – 1 – – 34 0 – 8 – – SS 028192 35 33 179 10 0 2 0 33 0 – 1 – – 27 0 – 7 – – ISO 7954 (1987) 3 3 161 10 0 0 0 3 0 – 0 – – 2 0 – 1 – – Standard methods 1 2 230 - 0 0 0 1 0 – 0 – – 1 0 – 0 – – NMKL 98, Modif. 2 2 164 – 0 0 0 2 0 – 0 – – 2 0 – 0 – – Other/Unknown 2 2 181 – 0 0 0 2 0 – 0 – – 2 0 – 0 – –
The standard SS 028192 is the only one used by more than 3 laboratories and a further separation into groups within that standard is very uncertain. For example, no evident differences can be seen depending on the different incubation conditions. The temperature is in almost all cases 25 °C and the time 7 days as specified in SS 028192. Therefore, it is not meaningful to discuss differences among results from the tables, neither for yeasts nor for moulds. The histograms show generally that the results from the odd methods are scattered among those obtained by use of SS 028192. However, the 2 false negative mould results came from these odd methods.
Mixture A
- The mould Phialophora malorum and the yeast Kluyveromyces marxianus were present in the mixture. Apart from a few individual deviating results, the analysis did not cause any problem. Although the results were scattered, the distributions could be considered as quite good for fungal analyses.
Mixture B and C
- No moulds and yeasts were present in the mixtures. Mixture B did not cause any problem, with some exceptions. On the other hand, three false positive results for moulds and 8 for yeasts were reported for mixture C. The yeast results can be explained by the fact that the bacterium S. marcescens can form reddish colonies on the fungal media, which can be misjudged as yeast colonies without microscopically observation. However, there is no certain explanation for the reported mould colonies. Individual mould colonies may appear due to deposition of spores from the laboratory air during the analysis. Such a result may not necessarily be interpreted as false positive for the sample needing follow-up
39 ↓ 0 2 4 6 8 10 0 25 50 75 100 125 150 175 200 225 250 Moulds 25 °C (MF) N o. of re su lts
No. of colonies per 100 ml
39 ↓ 0 2 4 6 8 10 0 25 50 75 100 125 150 175 200 225 250 Moulds 25 °C (MF) SS 028192 ISO 7954 (1987) "Standard methods" NMKL 98, modif. Other/Unknown N o. of re su lts
No. of colonies per 100 ml
178 ↓ 0 2 4 6 8 10 0 25 50 75 100 125 150 175 200 225 250 Yeasts 25 °C (MF) N o. of re su lts
No. of colonies per 100 ml
* 178 ↓ 0 2 4 6 8 10 0 25 50 75 100 125 150 175 200 225 250 Yeasts 25 °C (MF) N o. of re su lts
No. of colonies per 100 ml
*
A
Culturable microorganisms 22 °C, 3 days
Out of more than 90 laboratories only 3 reported another method than XX-EN ISO 6222:1999. These 3 laboratories did not report any outlier.
Only comparisons of method variants of the XX-EN ISO 6222:1999 are therefore relevant to discuss. Here, results are presented according to culture media and magnification for reading.
No general pattern can be discerned in terms of medium. For mixture C there is a trend of slightly lower results with Plate Count Agar (PCA) compared to Yeast extract Agar (YEA). The CV of the results is largest with PCA in mixture B.
Deviating results are mainly obtained while using low magnification.
22±2 °C, 3 days
Group of results Tot A B C
n n Mv CV F < > n Mv CV F < > n Mv CV F < >
Total, all results 92 87 97 6 0 3 2 89 22 17 1 1 1 92 62 9 0 0 0
EN ISO 6222 89 84 97 6 0 3 2 86 22 16 1 1 1 89 62 9 0 0 0
Medium
Yeast extract Agar 82 77 97 6 0 3 2 80 22 15 1 0 1 82 62 8 0 0 0
Plate Count Agar 7 7 95 6 0 0 0 6 24 26 0 1 0 7 54 11 0 0 0
Other/Unknown 0 0 - – - - - 0 - – - - - 0 - – - - - Magnification None 28 26 97 7 0 1 1 25 20 17 1 1 1 28 60 8 0 0 0 1,1–4,9× 28 26 98 5 0 2 0 28 23 18 0 0 0 28 65 9 0 0 0 5–11,9× 32 31 96 6 0 0 1 32 23 11 0 0 0 32 60 8 0 0 0 > 12× 1 1 82 – 0 0 0 1 21 – 0 0 0 1 55 – 0 0 0 Unknown 0 0 – – – – – 0 – – – – – 0 – – – – Other method 3 3 103 – 0 0 0 3 18 – 0 0 0 3 61 – 0 0 0 97 ↓ 0 4 8 12 16 20 0 25 50 75 100 125 150 175 200 225 250
Culturable microorganisms 22±2 °C, 3 days
N o. of re su lts
No. of colonies per ml
* 0 4 8 12 16 20 0 25 50 75 100 125 150 175 200 225 250
Culturable microorganisms 22±2 °C, 3 days
ISO 6222: Yeast extract Agar ISO 6222: Plate Count Agar Other method/Other medium
N o. of re su lts
No. of colonies per ml
* 97 ↓
Mixture A
- The three bacterial strains formed colonies in proportion linked to their concentration in the mixture. S. xylosus was the most abundant.
- Except for 5 outliers the analysis did not cause any problem. The distribution of the results was good.
Mixture B
- Only C. freundii and A. hydrophila formed colonies.
- The distribution was good with the exception of the 3 deviating results.
Mixture C
- All strains present in the mixture grow as culturable microorganisms at 22 °C. Colonies of the strain of S. cohnii were most abundant.
- No deviating results were identified. The distribution of the results was good.
22 ↓ 0 4 8 12 16 20 0 10 20 30 40 50 60 70 80 90 100
Culturable microorganisms 22±2 °C, 3 days
N o. of re su lts
No. of colonies per ml
22 ↓ 0 4 8 12 16 20 0 10 20 30 40 50 60 70 80 90 100
Culturable microorganisms 22±2 °C, 3 days
N o. of re su lts
No. of colonies per ml
62 ↓ 0 4 8 12 16 20 0 15 30 45 60 75 90 105 120 135 150
Culturable microorganisms 22±2 °C, 3 days
N o. of re su lts
No. of colonies per ml
62 ↓ 0 4 8 12 16 20 0 15 30 45 60 75 90 105 120 135 150
Culturable microorganisms 22±2 °C, 3 days
N o. of re su lts
No. of colonies per ml
B
Outcome of the results and laboratory assessment
General information about reported results
All laboratories' reported results are compiled in annex A. The distributions of results for the respective analysis are shown in histograms. A box plot (see below) gives a summarizing image of all the results of a laboratory, except false results. The number of false results and outliers are given below the plot for a paritcular laboratory to summarize its performance. These values are highlighted with bold text and colour background in annex A. The limit values for lowest and highest accepted results are given in the summarizing lines at the end of annex A, together with the measurement uncertainty of the mean.
When it is evident that a laboratory has mixed up results it is mentioned in the text. If whole samples seem to have been mixed up, the respective sample numbers are hatched in annex A. No mixing up seem to have occurred this time, neither of individual results nor of the whole samples. In some cases, however, it can be suspected that the laboratory has forgotten to calculate the results for the volume asked for, i.e. 100 ml for all analyses except for culturable microorganisms where 1 ml is appropriate.
The laboratories that did not report their results in due time, have to compare their results themselves with all other laboratory's by looking in annex A.
Assessment of the performance
The laboratories are not grouped or ranked in relation to their performances. The assessment is basically a clear description of the number of false results and outliers.
Z-scores, box plots and deviating results for each laboratory
The square root transformed results of the laboratories are calculated to standard scores, z-scores, to be comparable between analyses. They are shown in annex B but are not evaluated more elaborately. They are given explicitly to facilitate the follow-up process for the laboratories using z-scores.
The z-scores are the base for the box plots. The range of the z-scores for each laboratory is shown by a rectangle (box) and lines and/or circles above and beneath the box. The smaller the range from lowest to highest value is in the plot and the more centred around zero the values are, the better is the agreement between the particular laboratory's results and the means obtained from all laboratories' results.
Box plots and numbers of deviating results for each participating laboratory
- Z-scores are calculated from the formula z = (x – mv) / s
- Z-scores > +4 and < −4 have been set to +4 and −4, respectively.
- False results do not generate z-scores and are not included in ‘No. of results’.
False positive results cannot be illustrated in the box plots.
- The outliers are included in the plots after recalculation to standardised values
with the same s values as the rest of the results.
- The numbers of false positives and false negatives are given in the table under the
plots together with the numbers of outliers.
- The horizontal red line in each box indicates the median for the laboratory.
- The box includes 25% of the results above and below the median. The lines
protruding from the box and/or the circles embrace the remaining 50% of the results, false results excluded.
- A circle is shown when a result is highly deviating* from the rest.
- The background is divided into coloured fields in order to simplify localization of
the laboratory results.
_________________
* < [smallest value of the box - 1.5 × (largest value of the box - smallest value of the box)] or > [largest value of the box + 1.5 × (largest value of the box - smallest value of the box)]
z-val ue Lab no. 1131 1132 1149 1237 1254 1545 1594 1611 1753 1868 1970 2050 2386 2637 2670 2704 2745 3055 3076 3159 No. of results 18 11 3 14 15 21 21 21 23 20 19 23 14 12 14 18 8 3 3 18 False positive - - - 1 - - 1 - - - -False negative - 1 - 1 - - - 2 - 1 - 1 - 1 - - -Low outliers - - - 1 - - - 2 - - - - 1 High outliers - - - 1 - - - 1 - -False negative ? - - - - --4 -2 0 2 4
z-val ue Lab no. 3162 3305 3339 3475 3511 3533 3730 3868 4015 4064 4180 4288 4319 4339 4343 4356 4539 4633 4723 4889 No. of results 24 20 13 - 9 1 3 27 24 6 9 3 14 24 24 20 15 15 18 17 False positive - - 2 - - - -False negative - 1 - - - 2 - - - 1 - - 1 - - - 1 Low outliers - - - 1 - 1 - - - - -High outliers - - - -False negative ? - - - - -RSZ -0,42 1,06 -0,02 - 0,21 -3,08 -1,11 0,12 1,33 -1,04 -2,77 -3,68 -1,84 1,49 -3,19 0,17 0,09 -1,84 1,07 2 SD 0,55 0,66 0,72 - 0,25 - 1,19 0,93 0,71 1,28 0,89 0,89 1,81 0,6 1,39 0,63 0,64 0,7 0,51 0,63 z-val ue Lab no. 4980 5018 5094 5120 5201 5220 5352 5447 5553 5893 5950 6180 6253 6456 6563 6731 6852 7096 7191 7248 No. of results 21 23 12 26 7 6 19 15 12 5 - 21 9 15 23 4 6 12 - 21 False positive - 1 1 1 - - 1 - - - 1 - - - - 2 False negative - 3 2 - 2 - 1 - - 1 - - - 1 Low outliers - 1 - - - -High outliers - - 1 4 - - - -False negative ? - - - - -RSZ 0,18 -1,06 4,59 5,55 -0,75 -0,52 -0,73 0,57 0,49 0,25 - 2,18 0,61 0,09 0,94 0,12 -1,09 0,17 - 2,34 -4 -2 0 2 4 -4 -2 0 2 4
z-val ue Lab no. 7302 7442 7596 7626 7688 7728 7876 7896 7930 7946 7962 7968 8068 8255 8260 8329 8380 8435 8569 8598 No. of results 23 20 21 27 23 8 24 18 20 - 20 27 27 20 13 24 20 15 6 3 False positive 1 1 - - 1 - - - 1 - - - -False negative - - - 1 - 3 1 - 1 - - - 2 - 1 - - -Low outliers - - - - 1 - - 2 - - - 1 - - -High outliers - - - 1 1 - 1 - -False negative ? - - - - -RSZ 0,61 0,23 -0,31 -0,51 -1,67 -2,31 0,28 -3,23 -2,22 - 0,58 1,01 -1,53 0,24 1,55 6,99 0,32 39,2 1,18 2,85 SD 0,54 0,71 0,63 0,42 1,44 0,93 0,63 1,29 0,98 - 0,88 0,44 0,79 0,58 1,55 7,5 1,34 39,9 0,91 0,38 z-val ue Lab no. 8626 8628 8663 8742 8751 8766 8862 8891 8898 8955 9002 9436 9451 9465 9569 9655 9736 9899 9903 9956 No. of results - 17 20 5 9 24 24 3 24 12 9 24 15 14 27 9 24 24 18 15 False positive - - - 1 - - - -False negative - 1 1 1 - - - -Low outliers - 1 - - 1 - - - 1 - - - -High outliers - 1 - - - -False negative ? - - - - --4 -2 0 2 4 -4 -2 0 2 4
Test material, quality controls and processing of data
Test material and its content
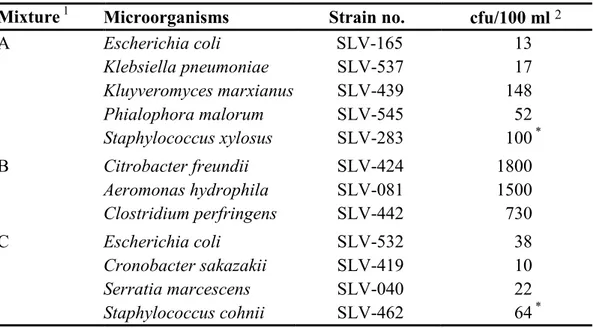
The test material was manufactured and freeze-dried in portions of 0.5 ml in small vials, according to the description by Peterz and Steneryd (2). This round comprised three test items with different microorganism mixtures. Each laboratory received one vial of each mixture. The simulated water samples were prepared by dissolving the content of the vials in 800 ml of sterile diluent. The composition and concentrations of each mixture is listed in Table 2. The participating laboratories were assigned to perform the analyses according to the methods routinely used on drinking water samples.
Table 2 Microorganisms present in the mixtures
Mixture 1 Microorganisms Strain no. cfu/100 ml 2
A Escherichia coli SLV-165 13 Klebsiella pneumoniae SLV-537 17 Kluyveromyces marxianus SLV-439 148 Phialophora malorum SLV-545 52 Staphylococcus xylosus SLV-283 100 * B Citrobacter freundii SLV-424 1800 Aeromonas hydrophila SLV-081 1500 Clostridium perfringens SLV-442 730 C Escherichia coli SLV-532 38 Cronobacter sakazakii SLV-419 10 Serratia marcescens SLV-040 22 Staphylococcus cohnii SLV-462 64 *
1 The links between the mixtures and the randomised sample numbers are shown in annex A
2 cfu = colony forming units; * indicates cfu per ml; at the times given in note 1 of table 3
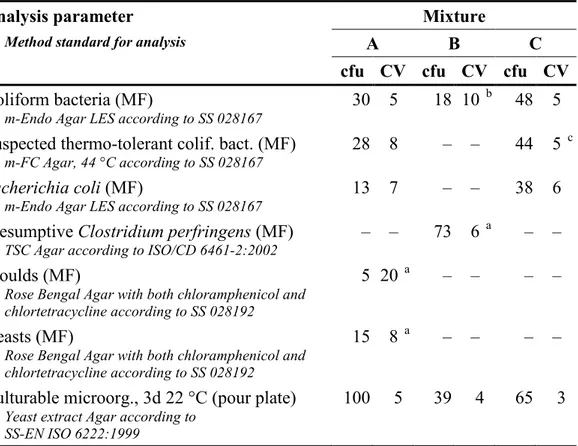
Quality control of the mixtures
It is essential to have a homogeneous mixture and a uniform volume in all vials in order to allow comparison of all freeze-dried samples derived from one mixture. The volume was checked in 11 to 13 vials of each mixture and the biggest differences between vials were 3, 3 and 4 mg for mixture A, B and C, respectively. The highest accepted volume variation is 15 mg (3%). Table 3 presents the results from the organizer in the form of concentration means (cfu) and coefficients of variation (CV) from duplicate analyses of 10 vials from each mixture. The results relate to the unit by volume at which the colonies were in fact counted. According to the criteria for the CVs used they were acceptable for the mixtures to be considered homogenous. The highest accepted CV normally is 25%. For very low colony counts a higher CV is accepted.
Table 3 Contents (cfu) and measures of homogeneity (CV; coefficient of variation in
per cent) in relevant sample volumes for the various parameters in the mixtures 1
Analysis parameter Mixture
Method standard for analysis A B C
cfu CV cfu CV cfu CV
Coliform bacteria (MF)
m-Endo Agar LES according to SS 028167 30 5
18 10 b 48 5
Suspected thermo-tolerant colif. bact. (MF)
m-FC Agar, 44 °C according to SS 028167 28 8
– – 44 5 c
Escherichia coli (MF)
m-Endo Agar LES according to SS 028167 13 7
– – 38 6
Presumptive Clostridium perfringens (MF)
TSC Agar according to ISO/CD 6461-2:2002 – –
73 6 a – –
Moulds (MF)
Rose Bengal Agar with both chloramphenicol and chlortetracycline according to SS 028192
5 20 a – – – –
Yeasts (MF)
Rose Bengal Agar with both chloramphenicol and chlortetracycline according to SS 028192
15 8 a – – – –
Culturable microorg., 3d 22 °C (pour plate)
Yeast extract Agar according to SS-EN ISO 6222:1999
100 5 39 4 65 3
1 n=10 vials analysed in duplicate, normally100 ml for MF and 1 ml for pour plate, 7, 8 and 9 weeks ahead of the testing round start for the mixtures A, B and C, respectively
a Result for 10 ml b Result for 1 ml
c Including both E. coli and C. sakazakii – No target organism
Processing of numerical results
Most histograms have “tails” in either or both directions, due to values that do not belong to a normal distribution. Calculations are performed after square root transformations of the results which give better normal distributions and therefore decrease the significance of the “tails”. Very deviating values are still present in most analyses and are identified as outliers (black bars). False negative results are presented with white bars in the histograms.
Outliers are identified by use of Grubbs’ test according to a modification by Kelly (3). A level of 1% is used as risk to incorrectly assess a result as being an outlier. Although the method is objective, it is a prerequisite that the results are normally distributed in order to obtain correct outliers at the 1% level. A zero result that is a low outlier is considered as a false negative result. In special situations, e.g. when
adjustments are made in order to set the right limits based on the knowledge of the mixture’s contents. False results and outliers are not included in the calculations. The coefficient of variation (CV) for square root transformed results is given as a measure of dispersion. When the dispersion is < 10% it is regarded as very small, 10−20% as small, 20−30 % as medium, 30−40% as large and > 40% as very large. The calculation of uncertainty of measurement of the assigned value is described in the scheme protocol (1). The assigned value for an analysis is calculated from the square root transformed results and is the square root of “Mean” in Annex A, and there denoted as mv. Hence, also the measurement uncertainty will be expressed in the square root form. The standard uncertainty of measurement (u) correspond to the standard deviation of the assigned value (s) divided by the number of results squared-root transformed, i.e.: u = s/√nmv where nmv is the number of results in Annex A, except the deviating ones. Here is the relative uncertainty (urel) used and expressed as per cent after multiplication by 100.
More about result processing and recommendations on follow-up work are given in the scheme protocol (1). A PDF of that document is available on the website
www.slv.se/absint.
Processing of methods data
The test material is primarily adapted to the EN ISO methods for analyses of drinking water referred to in the European Drinking water directive (4). Alternative methods acknowledged within EU may normally also be used without any problem, as is also the case with many other methods.
To be able to describe the results as fair as possible the results are grouped based on used method variant. The requirements to group results are found in the standard EN ISO/IEC 17043:2010, for which the proficiency testing schemes of the National Food Agency is accredited. This is the reason why it is mandatory for the participants to give information about the methods used in the analyses for which they send in results and that will be evaluated for performance. The method information can be reported after logging in on our website www.slv.se/absint.
References
1. Anonymous 2012. Scheme protocol, Microbiology, Drinking water & Food. The National Food Agency, Sweden.
2. Peterz, M., Steneryd, A.-C. 1993. Freeze-dried mixed cultures as reference samples in quantitative and qualitative microbiological examinations of food. J. Appl. Bacteriol. 74:143-148.
3. Kelly, K. 1990. Outlier detection in collaborative studies. J. Assoc. Off. Chem. 73:58-64.
4. Anonymous 1998. Council Directive 98/83/EC of 3 November 1998 on the quality of water intended for human consumption. Official Journal of the Eu-ropean Communities. 5.12.98, L 330/32-54 (national translations available). 5. Standard Methods for the Examination of Water and Wastewater,
Lab no. A B C A B C A B C A B C A B C A B C A B C 1131 1 2 3 30 1920 48 30 1410 48 - - - 12 0 24 28 1733 73 11 0 37 1132 1 3 2 - - - 28 0 38 12 0 0 26 2420 64 11 0 36 1149 2 3 1 21 1330 19 - - - -1237 3 2 1 - - - 10500 1700 45 - - - 0 0 30 19 1300 65 11 0 41 1254 2 1 3 32 2000 50 32 1600 50 20 0 36 12 0 25 - - - -1545 3 2 1 18 185 27 18 147 27 18 0 27 6 0 21 - - - -1594 1 3 2 18 2400 47 18 2400 47 25 1000 36 12 0 47 20 1800 55 12 0 34 1611 2 3 1 31 2100 44 31 1500 44 21 0 28 15 0 40 20 1414 62 11 0 26 1753 1 3 2 29 1714 39 29 1714 39 - - - 11 0 27 27 1961 59 11 0 36 1868 3 2 1 26 1300 55 26 1300 55 - - - 9 0 46 26 1658 83 10 0 55 1970 1 2 3 32 2200 53 32 1100 50 19 2200 53 19 0 0 - - - -2050 3 2 1 - - - 27 1927 32 - - - 14 0 23 29 1405 60 13 0 26 2386 3 1 2 28 220 57 28 0 57 - - - 6 0 42 - - - -2637 3 1 2 - - - 29 1120 66 10 <1 36 2670 1 3 2 20 440 27 20 440 2.7 0 0 0 0 0 27 - - - -2704 3 1 2 - - - 29 2100 52 - - - 15 0 50 29 1652 89 16 <1 41 2745 1 3 2 10 190 47 10 190 47 10 0 0 10 0 0 - - - -3055 2 3 1 - - - -3076 1 2 3 - - - -3159 3 1 2 - - - 16 1400 43 - - - 7 0 32 28.8 624 94.5 19.2 <1 38.4 3162 3 2 1 25 1800 58 25 1550 58 - - - 8 0 38 31 1553 73 8 0 33 3305 2 1 3 - - - 35 2000 55 - - - 11 <1 <1 38 1400 70 15 <1 34 3339 1 2 3 18 2100 42 18 2100 42 - - - 7 0 25 - - - -3475 1 3 2 - - - -3511 1 3 2 - - - 29 1652 70 15 <1 34 3533 1 3 2 0 70 27 0 70 0 - - - -3730 2 1 3 35 2100 50 - - - 33 0 41 - - - -3868 3 2 1 26 1600 42 26 1300 42 23 0 15 16 0 34 36 1700 53 25 0 24 4015 1 2 3 33 1373 49 33 1373 49 27 491 36 23 <1 38 36 1400 56 14 <1 39 4064 1 3 2 20 1650 67 20 1100 67 - - - 3 <1 28 - - - -4180 3 2 1 - - - 20 1100 23 - - - 7 0 23 - - - -4288 2 1 3 11 1010 49 - - - -4319 1 2 3 31 3350 45 1 2334 45 31 0 42 1 0 0 24 1357 80 13 0 37 4339 2 1 3 - - - 35 1400 56 28 0 37 12 0 41 35 1730 56 12 0 37 4343 1 2 3 14 1910 47 14 1676 47 - - - 9 0 33 11 1300 74 4 0 39 4356 1 2 3 33 1700 44 33 1700 44 26 0 28 15 0 0 26 2000 48 11 0 28 4539 1 2 3 - - - 34 1652 70 14 0 38 4633 2 3 1 - - - 17 1550 46 19 0 29 5 0 32 27 1596 52 11 0 25 4723 3 1 2 39 1364 44 39 1364 44 - - - 16 0 32 - - - -4889 2 3 1 - - - 32 1700 73 - - - 0 0 37 37 1700 74 17 0 34 4980 2 1 3 24 2300 40 24 2300 40 6 0 27 6 0 27 42.9 1676 69.7 22.2 <1 38.4 5018 3 1 2 23 1710 36 23 <1 <1 - - - 19 <1 <1 30 1414 63 20 <1 3 5094 3 2 1 400 142 62 400 142 45 21 0 33 0 0 33 - - - -5120 1 3 2 42 2600 59 42 2600 59 - - - 14 0 24 59 2573 152 35 0 74 5201 2 1 3 27 1450 41 27 1450 0 - - - 11 0 0 - - - -5220 3 2 1 - - - 23 0 25 - - - -5352 2 1 3 34 1750 49 34 1550 30 16 0 0 16 0 0 - - - -5447 2 3 1 27 200 54 27 200 54 - - - 15 0 35 - - - -5553 2 3 1 - - - 28 1230 35 - - - 12 <1,0 35 - - - -5893 2 1 3 - - - <1 <1 32 - - - -5950 2 1 3 - - - -6180 1 3 2 31 2350 70 31 1900 70 30 0 48 13 0 30 36 1730 62 19 <1 32 6253 2 1 3 - - - 33 1400 58 13 0 34 6456 1 2 3 - - - 33 1450 56 - - - 7 0 31 36 1625 52 13 0 34 6563 3 2 1 30 2382 60 30 1786 60 30 2382 60 15 0 15 25 1733 75 8 0 49 6731 1 3 2 - - - >1 >1 >1 >1 0 >1 6852 2 1 3 - - - 23 1400 62 13.7 0 27.2 7096 1 2 3 - - - 24 1860 50 26 0 31 16 0 34 - - - -7191 2 1 3 - - - -7248 1 3 2 57 2458 76 32 1827 57 40 0 33 16 0 74 31.4 0 83.3 14.2 2111 44.8 7302 3 2 1 24 1409 48 24 1409 48 - - - 15 <1 38 27 1900 82 15 <1 39 7442 2 3 1 32 1718 65 32 1718 65 - - - 16 0 50 25 1810 64 10 0 33 7596 1 2 3 29 2000 45 29 2000 45 12 0 57 12 0 36 18 1733 56 10 0 35 7626 1 2 3 20 1300 36 20 1300 36 26 0 40 10 0 30 28 1600 59 14 0 31 7688 3 1 2 - - - 10 1300 12 - - - 10 0 12 24 3300 54 11 0 26 7728 1 2 3 - - - 14 1448 29 - - - 0 0 29 - - - -7876 1 3 2 35 1791 33 35 1791 33 18 <1 21 15 <1 25 25 2420 70 12 <1 33
Sample Suspected coliform bacteria (MF)
Coliform bacteria (MF) Susp. thermotolerant E. coli (MF) coliform bact. (MF)
Coliform bacteria ("rapid" MPN)
E. coli ("rapid" MPN)
Annex A Results of the participants. Susp. = suspected on membrane filter before
confirmation. Results given as <1, <2, <10 and <100 are treated as zero. The fields with other results given as < 'value' and results given as > 'value' are yellow, and those results are not included in calculations or evaluations, as are also not results in shaded columns.
Empty hatched fields indicate that the result has been deleted due to misunderstanding of
instructions or use of improper method. A hyphen indicate that no result has been reported.
Figures written in bold in yellow fields indicate outliers, false positive and false negative
results. Underlined zero values indicate results characterized as 'False negative ?'. Crossed
out sample numbers in a row indicate that the samples probably are mixed up. False positive
Lab no. A B C A B C A B C A B C A B C 0 1450 0 - - - 99 17 57 1131 - - - 98 30 62 1132 - - - 104 24 47 1149 - - - 81 29 84 1237 - - - 23 0 0 180 0 0 97 25 62 1254 0 2000 0 0 2000 0 110 0 0 140 0 0 82 23 77 1545 - - - 80 0 0 160 0 0 109 23 58 1594 - - - 50 0 0 230 0 0 57 12 102 1611 0 1150 0 - - - 24 0 0 181 0 4 98 25 52 1753 0 1105 0 - - - 20 - - 160 - - 100 23 52 1868 0 1200 0 0 1200 0 0 0 0 230 0 0 82 21 55 1970 0 1318 0 - - - 27 0 0 177 2 0 100 28 83 2050 0 430 0 0 430 0 - - - 80 18 60 2386 - - - <1 1500 <1 - - - 102 18 51 2637 0 24 0 0 24 0 - - - 80 2 55 2670 - - - 0 600 0 - - - 99 19 56 2704 - - - 101 20 72 2745 - - - 110 60 60 3055 - - - 122 23 61 3076 - - - 0 930 0 - - - 11 24 60 3159 0 760 0 - - - 40 0 0 190 0 0 83 22 52 3162 <1 1100 <1 <1 1100 <1 - - - 100 12 74 3305 18 1000 39 0 1000 0 - - - 100 24 77 3339 - - - 3475 - - - 96 23 58 3511 - - - 3533 - - - 104 17 44 3730 0 1200 0 0 1200 0 100 0 0 110 0 0 85 22 58 3868 <1 1222 <1 - - - 32 <1 <1 230 <1 <1 114 16 63 4015 - - - 4064 - - - 94 10 60 4180 - - - 84 8 35 4288 - - - 92 23 75 4319 - - - 0 600 0 90 0 0 190 0 0 95 37 72 4339 0 937 0 - - - 7 0 0 65 0 0 66 22 69 4343 0 1200 0 0 1200 0 - - - 92 26 69 4356 0 187 0 0 187 0 - - - 107 20 66 4539 - - - 95 14 69 4633 0 1182 0 - - - 50 0 0 209 0 0 92 26 70 4723 - - - 0 470 0 - - - 110 22 72 4889 0 680 0 0 680 0 - - - 89 12 63 4980 <1 850 <1 <1 850 <1 30 <1 <1 230 <1 18 89 20 55 5018 - - - 0 0 0 131 0 4 96 19 76 5094 0 1800 0 0 1800 0 9 0 0 192 0 4 123 28 57 5120 - - - 93 16 52 5201 - - - 112 12 40 5220 0 1327 0 0 1327 0 18 0 0 150 0 10 72 18 58 5352 - - - 45 0 0 155 0 0 110 37 69 5447 - - - <1,0 1120 <1,0 - - - 105 53 42 5553 - - - 107 18 65 5893 - - - 5950 0 1100 0 0 1100 0 - - - 120 32 70 6180 - - - 104 30 70 6253 - - - 105 17 63 6456 0 1200 0 - - - 100 0 1 208 0 0 86 25 67 6563 - - - 136 10 53 6731 - - - 6852 - - - 0 1240 0 - - - 88 21 53 7096 - - - 7191 0 948 0 - - - 76 0 0 175 0 10 108 18 55 7248 <1 840 <1 - - - 24 <1 9 155 <1 <1 86 31 65 7302 - - - 15 0 0 170 0 110 96 20 51 7442 0 590 0 0 590 0 - - - 111 25 57 7596 Yeasts (MF) Total plate count
22 °C, 3 days Moulds (MF) Clostridium perfringens (MF) Presumptive C. perfringens (MF)
calculated results at the end of the table. The mean value (Mean) is the square of the mean value for the square root transformed results (mv). The coefficient of variation (CV) is the standard deviation (s) in percentage of the mean value for the square root transformed results. As means to calculate the z-values of your own, the appropriate values of mv and s are given at the end of the table. The x-values of a laboratory are obtained as the square roots of each reported result, respectively.
z = (x - mv) / s. urel,mv is the relative standard uncertainty of mv in per cent. For calculation see the scheme protocol (3); also briefly described in the text.