V¨
aster˚
as, Sweden
Bachelor Thesis in Computer Science
A MOBILE GRAPH-LIKE VISUAL
PROGRAMMING LANGUAGE
Sebastian Lindgren
sln13009@student.mdh.se
M¨
alardalen University
V¨
aster˚
as, Sweden
Examiner: Bj¨
orn Lisper
M¨
alardalen University
V¨
aster˚
as, Sweden
Supervisor: Rikard Lindell
M¨
alardalen University
V¨
aster˚
as, Sweden
Abstract
Visual programming is a programming paradigm commonly used for game scripting, it also has applications in other areas such as for example patcher languages for music and animation and even a few languages for general purpose programming. By using visual programming complex tasks can be made easier by abstracting the code and letting the user express a flow of commands instead. This also gives a better overview of the problem and how the different parts connect. By graphically connecting nodes the program flow will be made clear even for those new to programming. Unfortunately, visual programming is mostly limited to laptops and stationary computer systems. Touch enabled mobile devices which perhaps would be even better suited for a visual programming approach are left with textual programming environments, which doesn’t use the capabilities of the touch screen, and a few non-graph-like visual programming languages, which use interlocked blocks to represent code.
To explore how well graph-like visual programming would work on mobile devices a study will be conducted in which a lo-fi design is created and iteratively evaluated and improved using a modified NEVO process. The design will be created and improved based on existing visual programming interfaces and research in the area of visual programming, interaction design and information design, combined with the input from the test subjects. In this work a mobile, visual, graph-like, general purpose programming language has been designed. A lo-fi prototype of the language has been created to display how the language would look on a mobile system if realized. The lo-fi prototype was then tested with a method given by Rettig to give an indication of the systems usability measured by its task completion time compared to the task completion time of a mobile textual system. There is also a qualitative analysis on the responses from the test users. The tests were conducted both on people new to programming as well as people who have been programming for a while.
Contents
1 Introduction 6 2 Background 6 2.1 Visual programming . . . 6 2.1.1 Observations . . . 10 2.2 Programming languages . . . 10 2.2.1 Dataflow languages . . . 11 2.3 Interaction design . . . 112.3.1 Human computer interaction . . . 11
2.3.2 Mobile platforms . . . 12
2.3.3 Design processes . . . 12
2.3.4 Prototypes . . . 13
2.3.5 Testing a lo-fi prototype . . . 13
2.3.6 Evaluating interface design . . . 13
2.4 Information design . . . 14
2.4.1 Text organization . . . 14
3 Related Work 14 3.1 Classification of projects . . . 15
3.2 Graph-like and low-level . . . 15
3.2.1 Microsoft Visual Programming Language . . . 15
3.2.2 LUNA . . . 16
3.3 Graph-like and high-level . . . 16
3.3.1 Unreal Engine: Blueprints . . . 16
3.3.2 Backtracking Data Flow Programming Language . . . 16
3.3.3 Viola . . . 16
3.3.4 Connection Manager . . . 17
3.3.5 Pure Data . . . 17
3.3.6 Max 7 . . . 17
3.3.7 Quartz Composer . . . 17
3.4 Non-graph-like and low-level . . . 17
3.4.1 Blockly . . . 17
3.5 Non-graph-like and high-level . . . 18
3.5.1 Scratch . . . 18
3.5.2 Kodu . . . 18
3.5.3 Alice 3 . . . 18
3.5.4 Mac Automator . . . 18
3.6 Current mobile applications . . . 18
3.6.1 Codea . . . 19 3.6.2 Coda . . . 19 4 Problem Formulation 19 4.1 Research question . . . 20 4.2 Outcomes . . . 20 5 Method 20 6 Ethical and Societal Considerations 22 6.1 Usability tests . . . 22
7 Design iteration and evaluation 22
7.1 Seed idea . . . 22
7.2 First design iteration . . . 23
7.3 Evaluation of the first iteration . . . 26
7.4 Design iteration two, three and four . . . 28
7.5 Evaluation of iteration two, three and four . . . 29
7.6 Fifth design iteration . . . 30
7.7 Final usability test . . . 31
8 Results 32 8.1 Times for task completion . . . 32
8.2 User response to the system . . . 32
9 Discussion 33
10 Conclusions 34
11 Future Work 34
References 38
List of Figures
1 Example of an undirected graph . . . 7
2 Example of a flowchart . . . 7
3 An if-statement as it could look in a NSD . . . 8
4 An unskewered Nassi-Schneiderman chart . . . 8
5 Example of a PFD . . . 9
6 Example of a RGG parsing a PFD . . . 10
7 An overview of the work process used in this project. . . 21
8 The node-function-converter menu appearing after pressing a function node . . . . 24
9 The workspace when the code- and function- panes are hidden . . . 24
10 The workspace with the code pane visible . . . 25
11 The workspace with function pane visible and basic functions marked . . . 25
12 The workspace with function pane visible and compound functions marked . . . . 26
13 The workspace with user defined functions pane visible and the code pane visible . 26 14 How the system could look instead as a result of evaluation 1 . . . 27
15 How the system could look instead as a result of evaluation 1 . . . 28
16 Some of the design choices for the design of the nodes . . . 29
17 Some sketches and ideas cluttered down for the design after an early user test . . . 30
18 Some of the constructs in design iteration 4 . . . 30
List of Tables
1 Tasks and mean values for task completion times . . . 32 2 Reactions of the test subjects when using the visual programming language . . . . 33
1
Introduction
Visual programming is an ever growing field with a lot of emerging languages. There are many graph-like visual programming languages such as those for game scripting, for example Blueprints [1], FlowCanvas [2], Playmaker [3], Construct 2 [4] and Autodesk Stingray [5]. There are patcher languages such as Pure Data [6], Max [7] and Quartz composer [8] for those that wish to construct graphical, musical or animated works. There are even general purpose programming languages emerging such as Luna [9] and VPL [10].
Visual programming languages have the potential to be used exclusively with touch controls. Touch displays are present in modern mobile devices. Still visual programming languages don’t have much presence on the mobile market. Some block-interlocking visual programming languages such as Blockly [11], MIT App Inventor [12], CODE [13], Ozo Blockly [14] and others exist. These are primarily used for learning purposes and are focusing on people which do not know how to code. The style of the visual elements are very similar to the textual approaches. These non-graph-like visual programming languages are trying to bridge the users to textual programming languages and don’t try to use the concepts of visual programming to its fullest.
In this work a graph-like visual programming language will be designed and evaluated. The design process will follow a modified Non Embarrassing Version One, NEVO process [15]. The prototype will be lo-fi due to the limited time of this work and the process for creating it is taken from a process by Rettig [16]. The usability tests will also follow the process given by Rettig. These processes have been chosen since they are compatible with the motivations behind this work, to design an interface and measure its usefulness. The usefulness will be measured by a user test in which task completion time is measured. The usefulness will then be compared to a textual system for mobile devices in which users type with an emulated keyboard.
The aim of this work is to bring visual programming from desktops and laptops and into the realm of mobile devices with touch interfaces. By really using the capabilities of the touch screen, programming could be done on the fly, anywhere. Mobile devices could more easily be used as a tool for programming and could be used for working on projects even without bringing an external keyboard. In this way the users of mobile devices could program without sacrificing their mobility by bringing an external keyboard. In this work a design was conceived and a lo-fi prototype created and tested quantitatively on task completion time as well as analyzed qualitatively on user experience. The test showed that the visual approach worked better when programming on a mobile device than the emulated keyboard in most cases. This indicates that there is potential for a graph-like visual programming interface in the time perspective. The qualitative study further shows that the experience when using the visual approach is better experience-wise. Shared among all test subjects was that the visual graph-like interface felt better and smoother to use.
2
Background
The subjects in this work will mostly be about visual programming, interaction design and infor-mation design. Programming in general will also be brought up since the design artifact will draw some of it’s properties from there and since it is needed to understand the related works. In the background you will learn about the basics of visual programming, a little bit of the graph theory backing it up and about different diagrams and grammars that can be used to express it. In the part about interaction design you will gain some knowledge about human computer interaction, mobile devices and touch interfaces, design processes, prototyping and evaluation. The part about information design is quite short and is mostly about how the structure of information in computers can affect how the information can be used and generated.
2.1
Visual programming
Visual programming is a field which use a graphical representation of code. It is a big field which started back with the introduction of the graphical user interface. Visual programming often deals with new ways that programmers can manage code and build programs. Many visual programming languages are application specific which can be seen in the related works in this work. Still the languages build upon the same ground.
Underlying the concepts of visual programming is graph theory. In graph theory a graph is a set of nodes which are linked with edges which can be directed or undirected. The graph has some special properties such as having paths between the nodes. Meaning that a node A can be reached by a node B by traveling through the edges linking them. If the edge is directed the travel can only happen if the edge point towards the node of interest. There are some special properties of graphs such as the shortest path. This is the path which if traversed involves the lowest degree or amount of edges that need to be traveled to get from node A to B. The degree can for example be a value which is attributed to each edge or similar [17]. In the setting of programming the shortest path is interesting when there is need to optimize the amount of statements needed to get to a result for instance.
Figure 1: Example of an undirected graph
Graph theory can be made more concrete by putting it in the setting of charts. In flowcharts the nodes can for instance be individual components or subsystems of a system. The edges are arrows which points to different nodes showing how the system will interact [18]. In the context of a programming flowchart the nodes might represent input/output, processes, terminals, decisions, etc. and would be connected by flow lines. Flowcharts are used since they have easily identifiable logic paths, simple recognition of depth of decision levels and a structure which was easily followed and new code easily produced [19].
Figure 2: Example of a flowchart
simple a language to model program techniques in a good way. In these cases a more restricted version can be used called a Nassi-Schneiderman Diagram (NSD) [20], which theoretical basis is built upon a minimal flowchart by B¨ohm and Jacopini [21]. The NSD enforces the user to plan and create their programs in a structured manner and without go-to statements. This increases logical analysis of programs as well as program verification, optimization and debugging. Nassi-Schneiderman diagrams are used in some visual programming projects. This may be due to the ease of using it for describing program function [22].
Figure 3: An if-statement as it could look in a NSD
The if-statement is based on an example by Yoder, Cornelia and Schrag, Marilyn [22]. Apart from the if-statement other statements can be expressed as well such as a for- or while-loop etc.
Figure 4: An unskewered Nassi-Schneiderman chart
This example is also based on an example by Yoder, Cornelia and Schrag, Marilyn to see a variation of how the chart can be drawn. There are skewered and alternate versions as well. [22].
Some other structures which can be good to know about when venturing the realm of visual languages are the Process Flow Diagram (PFD) and Reserved Graph Grammar (RGG). A PFD is a graphical representation of a process model, which just like the flowchart is made up of nodes connected with edges. The edges called process streams represent the transfer of material between the edges. The PFD are often used in the industry to optimize the economics for process plants. They have also found applications in computer science projects such as for example a process flow diagram generator [23].
Figure 5: Example of a PFD
The PFD is based on an example by Da-Qian Zhang and Kang Zhang [24].
A RGG is a context sensitive graph grammar which can explicitly, efficiently and completely describe the syntax of diagrams using labeled graphs [24]. It can be used to aid in the implemen-tation and description of visual programming languages and its parsing algorithms of polynomial complexity in most cases. When implementing visual programming languages such a trait makes it well suited since parsing will be faster than other algorithms. The RGG can specify a PFD with the use of additional textual specifications.
Figure 6: Example of a RGG parsing a PFD
The RGG parsing example is based on an example from the work of Da-Qian Zhang and Kang Zhang, it parses the PFD in figure 5 [24].
2.1.1 Observations
There are two very similar but actually unrelated concepts called visual programming and program visualization. The difference between them are that in visual programming the graphics is the language itself. In program visualization, the graphics is a translation from a textual programming language. Sometimes the two are mixed up which may bring confusion [25]. Still the basis of a visual programming language can be a traditional textual language. A visual programming language could also be converted to another language and thus used kind of like program visualization although not as direct.
There are two observations about visual programming research [26]:
1. Since visual programming language isn’t restricted to be expressed as a sequence of textual characters it gives the language designers more choices.
2. Because of this the researchers want to use this to design better languages than possible before. Better here meaning that the programming languages increase the likelihood that a person correctly create understand or change a program than with a textual programming language.
2.2
Programming languages
A lot of different programming languages exists and some fit better than others as the basis for a visual programming language. The programming languages come from a lot of different program-ming paradigms. Some heavily used at the current date are imperative-, object oriented-, logical-,
and functional languages. Some of the members in the family of imperative languages include C, Pascal, Basic etc. Object oriented languages include Java, Javascript, Smalltalk etc. Logical programming languages consist of for example Prolog, Oz and Planner. Among the functional languages there are Haskell, F#, ML, Lisp etc.
Of course, there often occur combinations of different paradigms in a single language. A lan-guage can be both be logic based and at the same time functional such as Alice and Oz, or both imperative and object oriented such as C++. When languages are used as a basis for visual pro-gramming languages it is good if they can be used in combination with the dataflow propro-gramming paradigm (DFP). In these langauges the programs are modeled as a directed graph [27][28][29][30] where the data flows between operations. DFP have many similarities to functional programming and can easily be used to do parallel programming without increasing complexity. Dataflow pro-gramming is also perfect for representing visually and is perfect for visual propro-gramming languages [31]. Visual programming languages are generally high in abstraction and in them programmers ex-plicitly express what they want done using icons to represent data and arrows or edges to represent the flow of data [32].
2.2.1 Dataflow languages
Dataflow languages are an important part of visual programming development. The features in dataflow languages are specified as such [33][34][35]:
1. The absence of side effects; 2. locality of effects;
3. data dependencies are equivalent to scheduling; 4. any variable can only be assigned once;
5. an unusual notation for iterations due to features 1 and 4 similar to recursion; and 6. lack of history sensitivity in procedures.
These properties are shared with those of functional languages and because of this, one could easily be used to represent the other. These properties are well suited for a lot of areas such as for programming reliable and provable systems and for concurrent and parallel programming. In recent years there have been advancements in functional languages and there is even easily used GUI libraries for functional languages such as F#. Since dataflow languages have much in common with functional languages these attributes should also hold when programming with dataflow languages. This means that dataflow languages can be used for reliable and provable programming and could be used for graphical programming as well.
2.3
Interaction design
The area of interaction design is both a very broad and a very deep subject and in this background, there will only be room for a peek at its surface. The background needed for this work is primarily an introduction to Human-Computer interaction (HCI), touch interfaces, prototyping and design processes and prototype- creation and evaluation.
2.3.1 Human computer interaction
Human computer interaction, HCI, sometimes called Human Machine Interface is the means by which the human and computer communicates. It is a interdisciplinary field which operates both in design and science [36][37]. Some core concepts in HCI are usability, human input and machine output. The usability in HCI is the degree of system effectiveness, efficiency and user satisfaction. To reach this the system should build on an understanding of human physical, mental and behav-ioral capabilities [38]. Since humans mostly interact with the physical world using physical actions the input to computer systems are most often comprised of some motor activity, such as typing on a keyboard or moving a mouse etc.
In the history of HCI there have been a lot of different dominating user interfaces. In the beginning batch processing with punch cards were the norm. This was prone to failure and was later replaced with a terminal interface. This was better but as of the introduction of the graphical user interface, GUI in the 60s and 70s, it was succeeded with windows, icons, menus and pointers (WIMP). In modern times, there have been some post-WIMP models such as organic user interfaces which enabled new means of interaction [38]. Some interfaces like this could for example instead of the desktop metaphor used in WIMP display ever expanding spaces where objects can be linked or manipulated. A project which takes on this new approach is c3loops [39]
2.3.2 Mobile platforms
The domain of mobile devices is an ever growing area of interest and has the potential to make a big impact to research [40]. Since the addition of the touch screen to mobile devices as of the release of the original iPhone the general public now have access to touch-screens. Together with applications for mobile development such as XCode [41], Visual Studio [42] and Android studio [43], a lot of different research projects are made feasible. Although not a new concept [44] touch screens in mobile devices revolutionized application development for the mobile market by bringing a convenient way to interact with the system. Since the user isn’t limited to only pressing but can use several fingers in different combinations to achieve different results [45]. The touch screen can also adapt to different contexts enabling a person using the device to access the kind of tool needed, this makes the touch-screen a potent tool. Touch interfaces are generally available on smart phones, tablets and some other smart devices.
Mobile devices of today are powerful enough to run programs and work with projects. They use mainly two different architectures, x86 and ARM which both work well for mobile usage [46][47]. The current version of x86 and ARM are very power efficient and some mobile systems are even more potent than desktop computers a few years ago. The increased power efficiency and power comes from architectures using smaller die sizes and more cores [48]. This is the current trend for increasing computational power and is one of the reasons to why mobile devices can be so powerful. 2.3.3 Design processes
There are many different ways to go about when creating a design and good research proto-types. One is called theory based design (TbD) which proposes that successful HCI implemen-tation projects ”a believable illusion” [37]. There is Empirical Research through Design method [49] which lets the project take on experimental variability with the aim of proving or examining design hypotheses in working prototypes. To be truly useful the method has to use its recom-mended guidelines and for example carefully define the prototype variability. A really interesting and modern approach is called Non Embarrassing Version One NEVO [15] which builds on these other design methods. Simplified it works as follows:
1. You first start with a research aim, motivation and rationale; 2. from this you generate a seed idea;
3. from the seed idea, you decide defining characteristics and gather information about previous systems, user studies, experience, intuition etc;
4. this leads to an iterative gatekeeping phase where you evaluate, reject and eventually accept design ideas;
5. from here an iterative engineering phase takes place where the prototype design ideas gets tested by users and new prototype features are implemented and integrated in the research system; and
6. at the end user studies will lead to research results.
This model is good for producing new artifacts but its real aim and purpose is for revealing knowledge and understanding. The design process here serves as a process for research.
2.3.4 Prototypes
When creating the prototype of a system the amount of detail needed depends on how the prototype is going to be used. In the highest fidelity there are systems implemented in code which are basically a working version of a conceived system. In lowest fidelity there are quick sketches with a context which make up the system, these are not runnable programs but can still be used for a basis for scientific work and be used for evaluation [16].
There are many pros- and cons- with both hi-fi and lo-fi prototypes. Hi-fi prototypes are often created using demo-builders, multimedia tools or high-level languages. They can be used for detailed proof of concept or other areas where detailed testing is needed. But due to the amount of details in the hi-fi prototype it often takes a lot of time to create, which consequently brings the design team closer to deadline and limit the amount of design iterations that are possible to do in the available time spectrum. A lo-fi prototype is on the other hand not very detailed, but detailed enough for evaluations and improvements made from them. The lo-fi prototypes don’t take a lot of time to produce so the amount of iterations of evaluations and improvements can increase drastically. If quality can be measured partly by the amount of refinements made to an artifact, then lo-fi prototyping would then increase the overall quality of it [16]. When creating a lo-fi prototype Rettig lists a set of guidelines forming a method [16]:
1. Assembling a kit, to start with get thick white papers, markers, sketching tools etc; 2. set a deadline for when each iteration should be done; and
3. construct models not illustrations, each item which can be accessed or modified should be its own entity.
2.3.5 Testing a lo-fi prototype
When testing a lo-fi prototype Rettig proposes a few guidelines and a set of actions forming a method [16]. To start the preparations should include:
1. Select users with a correct background; 2. prepare test scenarios; and
3. practice so that the scenarios are correctly executed. After the preparations are complete the test itself is conduced:
1. First greet and prepare the test subject for the test;
2. a facilitator then takes over and ask the test subject to do certain actions with the system, tell what they think etc;
3. a team member acts as the computer and transition the model as the user interacts with it; and
4. observers comprised of the rest of the team takes notes. 2.3.6 Evaluating interface design
Prototypes are near worthless if they aren’t evaluated. To produce a quality result several iterations of evaluations and refinements needs to be done on the prototype. A method for evaluating the system is given by Hix and Hartson [50]. The evaluations can be made by putting the prototype in front of the team, then take each piece of it at a time to summarize and prioritize problems. This will then form the basis of a report regarding the findings of the test. The team discusses changes and then agrees on suitable changes for each part with sufficient priority. To revise the prototype the changes discussed and agreed upon will be made to the prototype, introducing a new version.
2.4
Information design
In the modern era there is one big flaw in how data is being dealt with. There are ways to store data which makes chunks of previously produced material easily attainable in the future or by others. Meaning that by storing data in a smart way a lot of duplicate code could be avoided by re-using chunks of old code which fits into new projects. This translates well to one of the important concepts in software engineering, namely reuse. To be able to cheaply and rapidly create new programs old programs, subroutines and pieces of code have to be incorporated [51]. 2.4.1 Text organization
To know how to store and be able to generate text or other media in a good way, there first needs to be an understanding of what text really is. According to Mann there are a few attributes that text organization model needs to have [52]:
1. Comprehensiveness, it is applicable to every kind of text; 2. functionality, informative in how text achieves its effects; 3. scale insensitivity, applicable to every size of text;
4. definiteness, susceptible to formalization and programming; and 5. generativity, capable of use in construction as well as description.
Some systems organize the content in a kind of What you see is what you get WYSISWYG fashion. A better model for organizing text in a computer is with an ordered hierarchy of content objects (OHCO) [53]. The content objects are for example paragraphs, quotations, etc. and they are ordered in a hierarchical fashion so paragraphs are inside chapters etc. But text organization is not limited to the written word but can be used with other media as well.
Using the OHCO model it is easy to identify logical text objects in a document. Some of the useful properties of the OHCO model include [53]:
• Alternative document views, since everything in the document is classified after its content object type it is easy to generate views where some of the information is hidden.
• It is good for collaborative work, it is easy to share documents written in the OHCO model with other software and devices.
• It can easily be turned into a database, since the OHCO model makes the document carry all the information with it which makes it easy to convert to a database and back.
• Information retrieval, related to its database property, since everything is tagged it is easy to search for any kind of information, from philosophical definitions to titles.
• Special processing, also related to tags and databases, content that require special processing can easily be marked as such and the relevant software can be used to process it when needed.
3
Related Work
There have been a lot of work in the field of visual programming and program visualization, both in the industry and in research projects. For example the Grail project [54] which in the year 1969 used a stylus to let the user work with a visual programming interface and which could compile a program from computerized flowcharts. PIGS [55] which is a system for programming with interactive visual support was created in 1983 and allowed the users to modify a program using NSD as a logical construct, and do so during execution. ProGraph [56] is a concurrent visual programming system in which you can program using a functional data-flow language. Even more visual programming systems and languages have been produced in modern times, filling different roles. Some used for high-level and some for low-level operations, some with a graph-like interface and some with a non-graph-like interface [57].
3.1
Classification of projects
To give a view of the programs and projects in visual programming a few of them will be listed. To relate them to this work the different programs and programming interfaces will be classified with regards to if it is:
1. graph-like visual programming; and 2. non-graph-like visual programing.
Since the goal with this project is to create a kind of low-level programming language in which traditional programming can take place, the different related works will also be classified as:
1. Low-level, traditional general purpose programming can be done on this system; and 2. high-level, the blocks do high-level operations and cannot be used for general purpose
pro-gramming.
It will be noted if the system is available for mobile devices, such as the iPad, traditional computers, such as laptops, stationary computers or both mobile devices and traditional computers. The programs with visual programming and program visualization are the ones that relates the most to this project, and these will be classified. However to later be able to compare the mobile visual programming interface design to the existing mobile programming interfaces, two textual mobile programming interfaces will be examined as well.
By using these different categorizations it will be clear what kind of systems that exists now and what they are used for. The different projects will now be listed and examined. They will be listed under their respective classification:
• Graph-like and low-level; • graph-like and high-level;
• non-graph-like and low-level; and • non-graph-like and high-level.
The different projects will later be compared with each other and interesting features will be exam-ined. The features that are particularly interesting in the context of bringing visual programming to mobile devices are controls that can be used with a touchscreen, a few but powerful tools, observability on a smaller screen, etc.
3.2
Graph-like and low-level
The projects most relevant to this work is in this category. The graph-like properties make them perfect for a 2D space with unlimited area. It is easy to for example manipulate variables with hand written functions. The low-level does not necessarily mean that the program must be able to be converted to executable program files. A script language which depend on a system to function, in this work is still to be considered a programming language of low-level, as long as the components and constructs used in the language are of low-level.
3.2.1 Microsoft Visual Programming Language
The Microsoft visual programming language (VPL) [10] is a system used for application develop-ment. It is based on the graphical dataflow model and instead of imperative commands it works like having a set of activities which interact by passing messages, much like a functional language. The produced output of the system can be called a dataflow orchestration or coordination of in-formation between a connected set of processes. This language can be used to create truly useful applications. It supports all the kind of functionality and concepts you would expect in a tra-ditional programming language, such as variables, functions, lists, if statements etc. Apart from these traditional building blocks you get some high-level functionality as well such as text-to-speak, timers and sound players to name a few. By using these in combination you can achieve remarkable results and create truly useful programs.
3.2.2 LUNA
Luna [9] is a visual and textual, functional programming language. It gives the user the power of both objective oriented and functional programming in the form of category oriented programming. By delivering both a textual and a visual feedback for the user the code can be edited in real time in the visual mode and the produced code can be seen as well. This allows for minor revisions being done textually if that would be needed. The system focus on development collaboration, by having a representation of the code much like a white board, team members other than programmers can more easily be a part of the process.
3.3
Graph-like and high-level
These languages provide the user with the ability to manipulate graph-like structures. More specifically a GUI with resemblance to nodes and edges. The language however is not always programming constructs but rather high-level operations that can be modified or combined by the user. The high-level let the user perform often incredible feats such as manipulating big chunks of data with specific operations or accessing web platforms etc. In some examples the language could have certain low-level properties but in these cases they appear to have a limited amount of such features.
3.3.1 Unreal Engine: Blueprints
Blueprints [1] is a visual scripting language used in Unreal Engine. This is a complex programming environment with many options and a lot of functionality. It is a visual programming language since the visual components are the language. It is very flexible and powerful and includes the tools which are needed to do real programming. It is typically used mostly for game programming, but it could find use in other programming situations. It supports things like nodes, events, arrays etc. The nodes can be connected to other nodes and the arrays can be of any type. As of Unreal Engine update 4.12 there is also the possibility to convert a Blueprint to a C++ file. This in turn would indicate that the programming done in Blueprint could in fact be as powerful as programming in C++, but that would depend on if the converted code was forced to follow a template or not. The system is primarily used for creating gameplay elements via events. Visual programming has become a widespread way to do this and Blueprints have competitors in products such as FlowCanvas [2] and Playmaker [3] for Unity, Construct 2 [4] by Scirra and Autodesk Stingray [5]. These all works in a similar way and for a similar purpose.
3.3.2 Backtracking Data Flow Programming Language
Backtracking Data Flow Programming Language, BDL [58] takes on an interesting approach by combining visual programming with logic based programming and backtracking. By using features from both visual languages and Prolog it manages to provide a means of generating programs with support of solving internal conflicts. The functionality available to BDL are comprised of mathe-matical operators, filter, function calls, data flow, in/out parameters and collectors. The programs generated always end with 1 or 0. It is therefor not usable for general purpose programming but shows of interesting concepts.
3.3.3 Viola
Viola [59] is a visual programming language aimed for modeling ecological problems. The system is intended for researchers which does not have much programming background to easily be able to develop complex ecological simulations. The language is based on a previously developed textual language called Biola, which is a object oriented programming language for creating simulations of behaviorally complex animals in heterogeneous landscapes. Viola is however designed with wider applicability such as developing systems of interacting agents.
3.3.4 Connection Manager
Connection Manager, ConMan [60] was one of the early answers to interactive programs being dif-ficult to build, edit and extend. It is a high-level visual programming language which in a dataflow manner is used to connect small C-snippets. Thus working just like the way small programs in the Unix world can be combined to solve different problems. The applications created with ConMan is visually represented and can easily be edited and modified. In later years many other systems have been created which works and is used for similar purposes.
3.3.5 Pure Data
Pure Data, PD [6] is an open source visual programming language primarily used for creating animation and music effects. It is a major branch of the patcher programming languages and uses a graph-like visual programming style to alter incoming data in interesting ways. The programming language has many interesting features such as functions called objects, data flow, mathematical operations and high-level audio and video manipulation. There is also an option to import externals which are PD-objects compiled from C or C++. Pure Data is available for several platforms and interestingly enough can be used on smart phones as an embedded library [61]. This is interesting since it can provide a graphical high-level programming environment to the mobile market. 3.3.6 Max 7
Max 7 [7] is a system for connecting virtual patch cords with the aim of creating interactive sounds, graphics and custom effects. Just like Pure Data it is a visual programming language from the patcher programming family, similarly it also has a lot of interesting features. The different patches in Max 7 can be of sound, graphics or another origin. Something really interesting about Max 7 is Gen which combines the visual patching environment with real time code generation. By allowing the user to see both the visual and the textual version of the program at the same time.
3.3.7 Quartz Composer
Quartz composer [8] is a very potent visual programming tool for creating graphic processing modules, called compositions. The main goal with it is to create quartz compositions which are procedural motion graphics programs, composed of preexisting modules (called patches). Mostly things like graphical effects and the like is made with Quartz composer but with a few plug-ins the language can be made extremely powerful and be used to for example create a neural network [62]. One of the interesting design features with this tool is that the code is built in layers. A block can in itself hold a lot of more blocks accessible by going into that block. This gives a clearer overview when managing the different patches.
3.4
Non-graph-like and low-level
These kinds of applications are visual programming languages but not in the form of graphs. It can instead be interlocking blocks, directly connected NSDs or similar. As a low-level language, it could be translated to actual code or in some other manner produce results comparable with the kind of results one could expect from a general purpose programming language.
3.4.1 Blockly
Google Blockly [11] is a library which adds visual programming to a webpage or application. It can be used on Android, iOS or a web page with JavaScript. It builds upon the concept of interlocking blocks and provides the means of learning programming in a more intuitive and visual manner. Blockly applications can export code in languages such as JavaScript, Python, Lua, PHP and Dart. Blockly is both very popular as well as open source, a combination which has resulted in that many applications has been built using Blockly, for example MIT App Inventor [12], CODE [13], Ozo Blockly [14] and many more.
3.5
Non-graph-like and high-level
As non-graph-like languages these languages are not in the form of graphs but instead interlocked blocks, directly connected NSDs or the like. As a high-level language, it must not be able to produce all the kind of results a general purpose programming language could. Instead they might excel at a particular field such as games, graphics, music etc.
3.5.1 Scratch
Scratch [63] is a visual programming language which in many ways resemble Blockly. It is primarily a means of learning targeting kids and those new to programming. You modify your code by interlocking blocks, which produce a very textual-code-like structure. The language has been widely used and has been around for over 10 years. Scratch is primarily used for programming animations and interactive games.
3.5.2 Kodu
Kodu [64] is a visual programming language in which you interlock blocks to model what you want to do. It is targeted mainly for Kids and those new to programming for creating games for the Xbox console. The program aims to be simple and is fully icon based. It’s still a potent high-level language which incorporate real world primitives such as collision, color and vision, a terrain builder and a lot more. Something really interesting is that the whole process only requires a xbox controller, no keyboard is needed. This means that advanced features can be achieved with a limited amount of input.
3.5.3 Alice 3
Alice 3 [65] is a programming language which is aimed for producing 3D animations and creating video games. The system is designed to be a student’s first exposure to object oriented program-ming, and has been used for teaching primary courses in programming with great success [66]. When running a program in Alice student gets immediate feedback to their actions and can see the relations of their different instructions. Alice has all the programming constructs that can be found in a traditional programming language but in the context of animation.
3.5.4 Mac Automator
Mac Automator [67] is a program for easily create workflows to simplify repetitive tasks. With Automator you use visual programming in the form of interconnecting blocks. The blocks consist of high-level actions such as manipulating a certain program such as extracting images out of a webpage in Safari or printing a image containing images from a certain folder or similar. These actions can be repeated etc. and result in a script which you can run any time you need it. Something interesting with Mac Automator is that the programs that are automated are existing programs. By using pre-existing programs functionality new software isn’t needed but by using scripting functionality old modal software can be used in interconnection to provide a desired service. This concept could be taken a bit further by imagining all programs and functions created as a program modal. The programs already created could then be used as a service to get the wanted results instead of re-writing all functions all the time.
3.6
Current mobile applications
These applications are not visual programming languages but instead represent two of the most popular programming interfaces on the iPad as of now. They are not the only mobile applications in which programming can be done, for example there are a lot of other textual interfaces as well as Blockly-based applications mentioned earlier in this section. To be able to compare the visual programming language design at a later stage these textual programming languages will be examined.
3.6.1 Codea
Codea [68] is a textual programming language which is used for general purpose programming, and can be used to program in Lua. It has a few visual options such as picking out colors and tailoring images and audio with a visual controller. Other than that Codea is entirely textual and relies on a virtual or external keyboard.
3.6.2 Coda
Coda [69] is a full fledged textual programming interface as well as a file manager. It has got a lot of features often found in desktop application interfaces. You can edit, preview and manage code written in web languages. You can edit files written in Java, Lua, Javascript, Objective-C, Ruby and many other. Bluetooth keyboards are supported and the application is intended to be used with either a virtual or external keyboard.
4
Problem Formulation
In the last 10 years there have been a drastic change to how mobile devices are used. Before 2007 there were no iPhone, no iPad, no Android and almost none of todays smart devices. Most people owned a stationary computer, some had a laptop and phones had small screens and had at most some kind of limited apps and internet. In the society of today there are a lot of different devices available for each person. Most people have a mobile phone and projects around the world increase the amount of people that owns one by the day even in developing countries [70]. Many also have a computer or laptop as well as a larger touch enabled device such as an iPad, Android tablet or other tablet [71][72].
With the introduction to such technologies there should also be a transition of programming development techniques. As new hardware makes new kind of concepts possible these concepts should be explored. So far the art of programming has not followed the advancement in hardware. The applications that exists now don’t use touch and multi-touch to its fullest potential. Instead emerging software for mobile devices still mainly use a textual approach or WIMP-like interfaces as can be seen in Codea and Coda [68][69]. There have been some applications which takes more interesting approaches such as the visual ones using Blockly as a base, for example MIT App Inventor [12], CODE [13], Ozo Blockly [14] etc. Although kind of on the right track these still keep in the safe zone, looking a lot like textual programming languages. Most of them target audiences that try to learn so called real or textual coding thus mimicking the structure of textual languages. Since we now have the equipment and power to program all around us even in budget phones and tablets, it is time to try on a new approach of programming where general purpose coding could be done on mobile devices. Any smart phone or tablet from today could easily be used to compile or interpret programs and work on projects, the only thing lacking is the option to do so without the hassle of internal or external keyboards. An approach that works well on standard computers but when using a mobile device is not optimal. There is a need to change the way documents containing programming code is modified when using mobile devices. One way to do it is to rely on another form for input information into the documents in which the devices native touch and multi touch functionality comes to its right. The input functionality should be simple as to not being overwhelming or requiring a lot of presses to gaining special symbols or the like, but still powerful enough to be able to be able to do general and low-level programming.
Visual programming has been around for a long time ever since the introduction of the GUI. Interestingly enough one of the first projects called the GRAIL project included a visual program-ming interface, manipulated using touch controls with the aid of a stylus [54], this was in year 1969. Today visual programming languages exists in the form of for example VPL [10], Luna [9], Blueprints [1], Scratch [63] and many others. These languages try to formulate programming in a different way. Instead of just coding with text you can draw diagrams of what you want to do and the code is automatically generated for you. Interestingly enough there are only a few visual programming languages created and implemented for mobile touch enabled devices. These are not graph-like as many of the programming languages for traditional computers, but are comprised of non-graph-like languages only.
The intention of this work is to bring graph-like visual programming and mobile devices to-gether. By doing this programming could be done everywhere without the need of a keyboard. This would require a powerful visual programming language with limited amount of available user input variations. Since many modern visual programming languages use extensive features, left-and right- click controls, drop down bars left-and menus. The language in this project would need to be scaled down so that only the needed functionality remain. To do this attributes from func-tional languages can be used. A limited language created which still have the properties needed for general purpose programming.
4.1
Research question
This thesis will explore alternative visualization techniques and the usability of visual program-ming in the domain of mobile interaction. In it the usability of such a design will be evaluated quantitatively by measuring task completion time. How much time does it take to complete a set of sample programs for standard algorithms with this design compared to traditional coding style on keyboard, mouse and computer? The design will also be the target of a qualitative analysis based on the reactions of the test subjects handling it. How does a graph-like visual programming language compare to using a mobile textual programming approach? Which do the test subjects prefer using and why?
4.2
Outcomes
The focus in this thesis work is to gain an answer to how a graph-like visual programming language can be realized for mobile devices. How such a design can look like and how programming would work using it. The purpose of this is to:
1. see what kind of feedback such a system gets by its’ users; and
2. evaluate how useful such a system would be in a time perspective compared to other mobile systems relying to text input.
This would give a qualitative answer to how interesting this alternate way of programming would be for potential users. And a quantitative answer to how feasible it would be to use such a system compared to textual systems. Since a system which takes to much time to produce code would be a waste of time for most users. The outcomes from this work will thus be:
1. a design produced from extensive research and an iterative design process, where the proper-ties of the design will be backed by existing scientific research and related works. The design should be a result of a NEVO process [15] modified to the limits of time and team size in this project; and
2. an evaluation of the design usability with regards to time completion time as well as a qualitative study of how the users like to use the system.
5
Method
Since the aim with this work is mostly rooted in HCI and the design and usability of a visual programming language, such a method is the logical choice. Therefor a model for design-oriented research has been picked and altered slightly to fit the limitations of this work. The process used is based on the NEVO-process [15], some parts have been removed due to the 10 week time limit and the fact that there is only one person performing the work and team processes therefor had to be limited. Although slightly altered most parts of the NEVO-process is still there and will still yield a prototype faithful to the rationale and idea being studied.
Figure 7: An overview of the work process used in this project.
The process starts with a research aim, motivation and rationale, this logical basis is used to generate a seed idea. Then the process continues with two parallel processes, the idea defining characteristics of the system is decided and necessary background, related work, user studies etc. is being researched and analyzed. The reason that these two processes happen in parallel is that idea defining characteristics often are found in external studies and related work and the related work to look after can depend on defined characteristics. In design good attributes and traits from a wide array of different sources can be merged into one even better design. All of this leads to a design idea. This design idea is then evaluated, in the case of this work often together with the supervisor. When a design idea is accepted a lo-fi prototype is created with the aid of sketching. The process for the creation of the prototype is given by Rettig [16] and involves:
1. Getting the required tools; 2. set a deadline; and
3. construct models.
The tools used in this project are thick white paper, sketch pencils, scissors, rulers and other tools used for the purpose of creating something with paper. The deadlines were set to 1 week for each prototype and the constructs created were models rather than illustrations.
The lo-fi prototype is then prepared and tested according to the test process also given by Rettig [16] but modified so that one person had all the roles except for being test subject. This person can be called test leader and had the role of greeter, facilitator, computer and observer. The test preparations consisted of:
1. Selecting users;
2. preparing test scenarios; and 3. practice.
The users selected had to be programmers so that they would be able to share some of the back-ground related to this work. The test scenarios were simple function building and design attribute tests. To be able to give a somewhat smooth experience to the users the different available actions were practiced.
During the tests themselves the test leader greeted and introduced the test subject to the project, the test subject then tried playing with the application as if it was a recently downloaded application. While simulating the use of the system the leader talked with the subject and got information about things that could be made different, or things that wasn’t clear for the test subject with the current design.
The whole process mentioned above was then iterated several times to produce a prototype of good quality. After 5 user evaluations the prototype was considered good enough for the limited time scope of this project and a formal study was conducted on the results from the usability tests. Here both quantitative and qualitative data was of interest. The quantitative data was represented by task completion time and the qualitative by user experience. How did they like using one system compared to the other?
6
Ethical and Societal Considerations
6.1
Usability tests
The usability tests were done with the aid of students at MDH. For ethical reasons their feedback will be presented in the project’s resulting data but the identities of the test subjects will remain anonymous. The author thanks the test subjects for their help and cooperation.
6.2
Programming for all
Developing countries are getting more and more smart phones [70] and in a few years a majority of the people in the world will own one. This is a good thing since it will enable human beings to reach the internet in remote areas or areas where computers are scarce. This can in turn help realizing article 26 and 27 in the universal declaration of human rights [73]. Since programming is a skill of ever growing importance an application where programming concepts can both be easily learned and used in practice would be good. The resulting design of this project is one which use a limited set of inputs and is still able to do general purpose programming. If it can be used both for teaching purposes and used by anyone which takes time to learn it, it could be a good bridge for any people wanting to learn technical skills.
7
Design iteration and evaluation
The work of this project in many ways followed the altered NEVO process given in the method section. The work started when the author realized that mobile technology had become really powerful. Phones were no longer just a tool for calling or sending texts. Smart phones of today running iOS and Android can run applications, tablets exist which run windows 10 and some Linux distributions are being ported to x86 as well as ARM based mobile devices. These devices are everywhere and there had to be a way to bring programming to them. There exist programming interfaces such as Codea and Coda for iOS and a few Blockly-based visual programming languages. But when used on the small screen of the iPhone it quickly gets difficult to use or require an external keyboard.
The rationale was that there exist visual programming languages out there which are used to simplify programming but which doesn’t need to compromise on the power to do general purpose programming. Since visual programming is graphical the touch surfaces of current mobile devices should fit perfectly for realizing a visual programming language. The motivation was that by doing this programming could be done on the go, anywhere. If you get a programming idea on the bus you can start scripting it on your phone and continue when you get home. It could be used when learning to program or to spread programming interest among smart phone users which might not have come in contact with programming otherwise. The research aim ended up being to see how such a system would look like and how well it would work compared to other textual systems.
7.1
Seed idea
The rationale, motivation and research aim together became a seed idea. The idea was a graph-like programming interface for the mobile device. An interface where touch was used for user input controls. A system which used only the basic functionality available in functional programming languages. A node in the conceived visual programming language would be a function which could be turned to either a simple, a special or a user defined compound function. To loop there were only recursion and use it all you’d need to do is to specify the base case and recursive case. The resulting idea defining characteristics were consequently:
• A graph-like visual programming language for a mobile device;
• it should be able to be used in larger projects and levels of abstraction is required; • a minimal but capable set of programming constructs; and
• a way to use and manipulate the set of constructs with the limited input from a touch-screen with limited use of the keyboard.
From here on the seed idea was created and from it followed a series of 5 design iterations. Due to the lack of test subjects during the first part of the work some evaluations were conducted with the supervisor as the only test subject.
7.2
First design iteration
Mainly from intuition and previous experiences a first version of the system was created and a lo-fi artifact was constructed very early in the project. This system was created before doing a lot of research of related projects to give an artist’s view of how the artifact could be created before starting the research. This could be compared to how a hypothesis is made before conducting an experiment. The design included how the different parts would be constructed including nodes, interface, and so on. Parts of this first design would later be extensively remade but some of its distinctive features would still be present in the final resulting design.
The first design included an interface which panes could be toggled on or off to see a code version of the program and to see the different available functions that were predefined or created by the user. The different functions were of the category basic including math operations and input, output etc. and compound which were functional functions such as map, filter, reduce etc. There are also user defined functions that were a mix of basic, compound and eventually other user defined functions. The data types used in this design are singular data and array data. The data unit can be any kind of primitive data type.
The different functions available are made so that all functionality of a general purpose language should be existent. By pressing slightly on the workspace, seen in figure 3, an empty node will appear. This node can then be pressed to highlight the node and assigned using the function pane, seen in figure 4, or pressed and hold upon a while to enter a node-function-converter menu seen in figure 2. If going with the node-function-converter option first the menu seen in the upper left in the figure would present itself. By clicking on the right menu item one of the other menus would present itself. To save the currently selected function the user could click the menu item with the arrow pointing downwards in the menu in figure 2, to save the program the arrow in the lower right of the workspace would be clicked.
To be able to add additional content to functions without increasing the visual complexity and introducing a lot of extra nodes, and to be able to use the design for larger scale projects, the design needed a good way to organize the code. By using multi-touch the user can zoom into the nodes themselves, add other nodes inside them and thus create sub-programs. These nodes can then be saved which will make them locally available in the current project but also globally available to other projects. This mimics the OHCO model by giving the user the possibility to hide information and later make it visible, but also by being able to reference to it, even in external projects, code that is written once can easily be reused.
Figure 8: The node-function-converter menu appearing after pressing a function node
The node-function-converter menus were slightly changed over time but the main purpose of them are still present in the final version. An altered version of the upper left menu is still used in the final design.
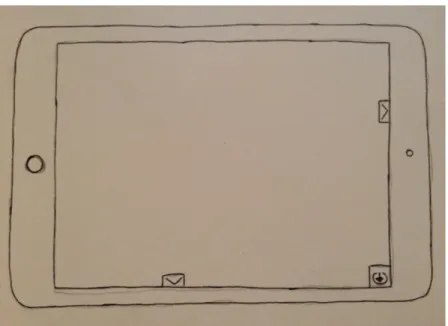
Figure 9: The workspace when the code- and function- panes are hidden
This workspace would be the ideal space for mobile phones since they have smaller screen sizes than tablets. The full workspace thus makes almost every bit of the small screen available for visual programming.
Figure 10: The workspace with the code pane visible
When using a tablet the code pane can easily fit on the side. By using this the visual programming language which actually would work fine on its own, suddenly becomes program visualization. With this mode, the user gets more freedom in the sense that textual programming can be executed if ever needed.
Figure 11: The workspace with function pane visible and basic functions marked
The basic functions give the user a means of low-level programming. Data can be passed to the basic functions which process it and then pass it on to functions connected to it. It could also do nothing if there are no functions connected with it.
Figure 12: The workspace with function pane visible and compound functions marked
The compound functions give good functionality in the form of actions which are used a lot such as map, filter, reduce etc. These often take a small function or if statement as one operand and an array as another.
Figure 13: The workspace with user defined functions pane visible and the code pane visible
When using both the function pane and code pane at the same time the environment could look something like this.
7.3
Evaluation of the first iteration
During the first prototype evaluation, the supervisor was the only test subject. After being pre-sented to and testing the system some feedback was given. Some of the results from the evaluation of this design were:
• The user interface doesn’t need to be full of additional features. Often less is more and since this application is targeting a mobile device this should be the case.
• Choose one of the variations of modifying functions and editing programs.
• Programs should save themselves when exiting the application or switching to other programs, the only information needed should be the name which it should have or if it should be discarded.
Additionally, two images displayed in figure 8 and 9 were created to see how the new system could look. Instead of a lot of panes and symbols cluttering the surface, the interface could just be a blank canvas. On it nodes could be created by touching and modified by clicking on the nodes. The nodes could be connected by pulling two of them together. The user could still zoom in on a node to see what content it had or zoom out from a node to see the content it was in.
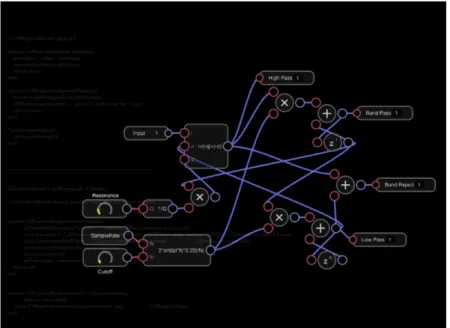
Figure 14: How the system could look instead as a result of evaluation 1
This would be the graph mode in which you can effortlessly work with the graph representation of the program while seeing a transparent version of the textual code in the background.
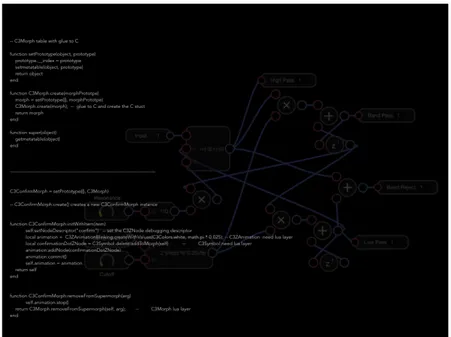
Figure 15: How the system could look instead as a result of evaluation 1
By pressing on the screen the textual version could appear. In this phase of the work the artifact was seen as providing visualization rather than being a visual programming language.
7.4
Design iteration two, three and four
With the comments from the first evaluation to go with a second version of the design was made. This time only part of the first system needed to be redesigned which lowered the effort needed for that. Instead effort was put into researching related works and looking into which features of other languages that could be used in the design created in this work.
A lot of inspiration was taken from LUNA [9], Microsoft VPL [10], Unreal Engine Blueprints [1] and patcher languages such as Max [7] and Pure Data [6]. From these languages some features and looks and feel were considered, sketched and evaluated with user tests concerning usability. The different features that really had an impact were:
Blueprints became the base of the new design and looked very much like the kind of system to strive against. The positive parts about it were the design of the system and the different concepts used in it. The negative parts were mostly that it features too much which could be a problem on mobile devices and that it was mostly focused on being used for gameplay scripts.
Microsoft VPL was also in the right direction regarding design but not as much as Blueprints was. Functionality wise it was even better than Blueprints since it features general purpose pro-gramming in a more accessible way. The negative parts about it was that the mindset in this language seemed to be more structural and imperative. It also had too much going on for a mobile device.
Luna was also one of the projects which were very close to what is being done in this work. It is a functional and visual programming language and seem to have the resources needed for general purpose programming as well as high-level programming. It also has a very sleek user interface. The main faults about it is that the abstraction levels aren’t adjustable so the programs can become all too big for efficient modification.
Patcher programming languages are high-level and mainly are not used for general purpose programming, even though it seems that with addons they can be. Some of the interesting features include snippets [74] which enable reuse of code by the help of information hiding or abstraction. Since visual programming is easy to do once it is tiresome to redo parts that have already been done. If these parts instead could be reused it would make the programming process much easier. In journals about visual programming there were general information about visual programming languages as well as more specific information about previous scientific research systems. There
were for example information about that visual programming languages was difficult to build from imperative languages [75]. Making it more clear that it was a good idea to base the visual programming language designed in this work from ideas of functional languages. Other systems were used as inspiration to how concepts could be done although they weren’t used directly. These systems served as a foundation to the choices made in the design evaluation.
7.5
Evaluation of iteration two, three and four
In lo-fi testing sessions, discussions and evaluations with the supervisor and students from MDH some new concepts for the artifact came up:
• There should only be one usable data type, the array;
• the array should be made of a unit data type which can be any type;
• if-statements should be a traditional function as well as a property of a recursive function; • all built-in functions, even basic ones like addition and modulo, should be able to take arrays
as input. Then they work as if used with a map function (or filter for if-statements) and do the basic functionality for all inputs;
• recursive functions can be created by connecting a node with itself. This will create a cyclic edge with a built in if-statement. If the same situation is created in another way such as first creating the if statement and then linking the edges from a function to it and back then the same result will happen; and
• the ability to create an if-statement by basing it from another function. Some points were made about the design and additions suggested were:
• A configuration menu accessible from the workspace;
• an info-button in the menu for when the programmer needs to learn to operate the applica-tion;
• tabs for seeing different variables and switching among them; and
• an additional way to reach the body of a function other than zooming in.
Figure 17: Some sketches and ideas cluttered down for the design after an early user test
Figure 18: Some of the constructs in design iteration 4
All this lead to the final design iteration in which the design was tested in a time perspective against a textual system and the usability evaluated by measuring task completion time.
7.6
Fifth design iteration
In the last design iteration the concepts from the previous iterations and related studies was put together. This resulted in the final design in which many of the issues in previous designs had been resolved. In the last design all functions were loops. Meaning that if you put two arrays into a + function, the the whole arrays would be processed and elements added together. If an array was put into an if function the if would work as an elementary filter which processed over the full
array and giving a filtered array as an output. The built in filter function thus only was different in that it could use other functions as a filter argument.
Some of the fixed design issues was:
• A configuration button was added to get to other projects, settings and information etc; • in the configuration information could be displayed by clicking the information button; • an additional way to reach the function body was added.
The graph-like design made it work just like a physical graph grammar. When used the nodes and edges connect making the flow looking just like it. This made it very clear and easy to use when used for programming and made it inherently executable. It simply gives a WYSIWYG representation of the code constructed by a user.
Figure 19: Some of the different parts of the design in the final system
7.7
Final usability test
The usability test conducted on the final lo-fi prototype was conducted as such:
1. Test subjects were chosen for the user tests, some relatively new to programming and some which had more experience of programming. Those new to programming having a few courses of programming experience and those with more experience having a lot of courses or several projects of their own.
2. Two tests were done by all the test subjects. One very simple and one a bit more extensive. 3. The times to completion was measured for both the textual and visual systems.
The first test for each user asks for two values to be added together and then divided by a third value. This would test how an basic snippet of code could be created. The second test were a little bit more extensive and asked for 5 values to be given by a user, filter away all values greater than 10 and then added together and printed to the screen. The textual language used was a C like pseudocode, the test subjects were asked to write C-like code and constructs but minor errors would be ignored.
These tests were designed to test the skills of the participants without being too daunting for those new to programming. The results taken was estimated to be a little bit different depending on previous skills. For both test groups some information about the systems and tasks were given. All