ACCIDENT EXTERNALITY AND VEHICLE SIZE – EVIDENCE
FROM SWEDISH COLLISION ACCIDENTS
Lina Jonsson & Gunnar Lindberg
Swedish National Road and Transport Research Institute (VTI)
ABSTRACT
Vehicle mass is a crucial factor for the distribution of injuries between occupants in involved vehicles in a two-vehicle crash. A larger vehicle mass protects the occupants in the vehicle while on the same time inflicts a higher injury risk on the occupants in the collision partner. This mass externality can be internalized to reach a situation where the drivers choose vehicle mass based on the social optimum instead of a private optimum that ignores the negative effects that a large vehicle mass has on the injury risk in presumptive collision partners.
Using a database including collision accidents in Sweden involving two passenger cars during five years, the influence of vehicle mass on the injuries and thereby the accident cost in both vehicles is explored. The database contains information on road infrastructure, vehicle characteristics including vehicle mass and characteristics of the occupants in the vehicles including their injuries. To get a measure of the accident cost the Swedish official economic valuation of slight injuries, severe injuries and fatalities are applied.
In each accident the two involved vehicles are divided into the lighter vehicle and the heavier vehicle and the effect of weight is examined separately for the two groups. The accident cost that falls on the lighter vehicle increases with the mass of the heavier vehicle and decreases with own mass. Given that a vehicle is the heavier one in the crash, neither the own mass nor the mass of the lighter vehicle significantly affect the accident cost.
The expected external accident cost is calculated and it is shown to increase rapidly with vehicle mass. The paper discusses different solutions to internalize this external accident cost and calculates a mass dependent multiplicative tax on the insurance premium in a no-fault insurance system.
1. INTRODUCTION
Accidents are a human tragedy which kills 1.2 million people worldwide annually (World Health Organization, 2004). The cost of traffic accidents are huge and recent estimates for US alone suggest the cost to be $ 433 billion in year 2000 or 4.3 percentage of GDP (Parry et al, 2007). A reduction of this cost can be done in two ways, either by reducing the number of accidents or by mitigating the consequences of the existing accidents. The active safety of a vehicle affects the probability of involvement in accidents and thereby the number of accidents, while the passive safety of the vehicle influences the consequences given that an accident occurs. This paper focuses on passive safety of vehicles and in particular how the masses of the involved vehicles in two-vehicle crashes affect the magnitude and distribution of the injuries.
To measure the consequences of an accident in the form of injuries and fatalities the accident cost is used. A part of the accident cost is external to the driver. Elvik (1994) classified the external cost in three components; the externality generated by changed accident risk due to higher traffic volume (traffic volume externality); the cost for the rest of the society (system externality) and thirdly, the increased risk a car driver imposes on other categories, such as pedestrians and cyclists (traffic category externality). The last component is here further refined and analysed as an externality between different car models.
For the injuries in two-vehicle crashes both the concept of crashworthiness and aggressivity is important to take into account. Using the terminology of Joksch (1998), crashworthiness reflects the injury or fatality risk to the car occupants in a specific collision situation while aggressivity is a concept that instead reflects the injuries and the fatality risk to the occupants in the collision partner. A third concept that complicates the analysis is that of compatibility. This reflects the fact that a given vehicle can pose a different injury or fatality risk to different vehicles with the same crashworthiness due to a mismatch between vehicle parts.
The change in velocity that a vehicle experience in a collision is a good measure of the severity of the crash and works as a predictor of the fatality and injury risk (Toy and Hammit, 2003). In a two vehicle collision where the vehicles move in the same or opposite directions, the change in velocity is a function of the masses of the involved vehicles and their initial velocities according to equation 1 where m are the masses of the vehicles and v are their initial velocities1.
(
i j j i j i v v m m m v + + = Δ)
(1)The velocity change will be greatest for the lighter vehicle which thereby also has higher fatality and injury risk. As the equation above shows, an increase in own mass will both lead to a lower velocity change for the own vehicle and a greater velocity change for the collision partner. Increased mass will thereby improve the vehicle’s crashworthiness while in the same time increase the aggressivity.
There is an ongoing debate on whether downsizing the vehicle fleet would be beneficial to overall traffic safety. Crandall and Grahams study from 1989 using aggregate data claim that the Corporate Average Fuel Economy (CAFE) program that requires a minimum fuel efficiency standard has led to lighter vehicles and thereby additional fatalities. Several studies have questioned Crandall and Grahams result (Ahmad and Greene, 2005) and especially emphasized that a replacement of cars by light trucks like SUVs has lead to more fatal accidents (White, 2004).
Besides change of velocity also mean and peak acceleration works as crash severity parameters (Stigson, 2009). While velocity change is a function of the masses of the involved vehicles the acceleration is also influenced by the vehicle structure, e.g. stiffness. The literature on vehicle crashworthiness versus aggressivity has to a large extent been focused on the difference between passenger cars and light trucks. Apart from the larger mass of Sport Utility Vehicles, Vans and Pickups, their stiffness and different geometry compared to passenger cars contribute to more severe injuries and fatalities to the occupants in the collision partner (Gayer, 2004; Joksch, 1998; Toy and Hammitt, 2003; White, 2004). This study will focus on the mass dimension and will thereby ignore the related influence of stiffness and geometry when analyzing the division of the accident cost between the involved vehicles.
The fact that the mass of a vehicle affects the injuries and fatalities in the collision partner implies that there is an external effect of vehicle mass that could be internalized to reach economic efficiency. Without internalisation, the driver will choose vehicle mass based only on the own beneficial effect of mass and ignore the disadvantageous effect on the injury risk in the collision partner.
Sweden and numerous states in the US have a no-fault insurance system. No-fault insurance is often used loosely to mean any insurance which allows the policyholder to recover financial losses from their own insurer regardless of fault. Sweden has a more strict no-fault system with very limited right to sue. In a strict system the premium will be based solely on the internal accident cost. Premium tax is common in many countries (Swiss Re, 2007) and Sweden recently introduced a tax of 32% on the premium (SFS 2007:460) which could be seen as one way to internalise the system externality. However, if the external cost differs depending on vehicle characteristics the government could do better with a differentiated premium tax that could also internalize the traffic category externality.
The paper will examine the external cost related to vehicle mass and discuss a premium tax based on Swedish data. The rest of the paper is organised as follows. After this introduction a model of the externality in a no-fault insurance system is presented in section 2. The dataset is presented in section 3 and the internal benefit and external cost of increased vehicle mass is estimated in section 4. Section 5 introduces the probability to be the heavier vehicle in an accident and generalises the result on the external cost. Section 6 examines the optimal insurance premium tax and section 7 offers some conclusions.
2. THE MODEL OF NO-FAULT INSURANCE AND ACCIDENT EXTERNALITY OF VEHICLE MASS
Accidents are assumed to be bilateral, i.e. they involve two vehicles. The accident probability (A) depends on the level of active care each driver takes and the annual driven distances. The severity of the accident in vehicle i is represented by λi where λi is a function of the traffic environment, occupant characteristics and vehicle characteristics including the masses of both involved vehicles, (zi,zj). It is assumed that δλi/δzi<0, δ2λi/δ2zi >0 while δλi/δzj> 0 and δ2λi/δ2zj >0. A larger vehicle mass
decreases the injuries in the own car but at the same time increases the injuries and thereby the accident cost that falls on the occupants in the collision partner. This is in concordance with the influence mass has on the velocity change in the involved vehicles (eq. 1).
The accident cost consists of economic losses l in form of medical cost and lost income and pain and suffering g. The total accident cost that falls on vehicle i is expressed as λi(g+l). All medical cost is assumed to be covered by the driver through full regress including regress from the social security system. Economic losses (l) are assumed to be fully insured. In a strong no-fault system no potential liability to cover the other driver’s loss occurs. The insurance premium for driver i will be:
(
e l A i i = λ 1+)
π (2)where e is the administrative cost of the insurer as a proportion of the expected loss. Drivers are expected to be risk averse and maximize their expected utility with the utility function U(W,z,π) where ∂U/∂W>0 and ∂2U/∂2W<0. Insurance is assumed to be available at actuarially fair rates. Two possible states are assumed, state of accident with a probability of A and a state where no accident occurs with a probability of 1-A. In case of an accident the wealth (W) will be reduced by the accident cost due to grief and suffering while the economic loss is covered be the insurance. The expected utility of driver i can be expressed as:
(
)
i(
i i)
z i ii AW AW g Pz
EU = 1− + −λ − −π (3)
where Pz is the price of mass, for example through higher fuel consumption. The first order condition for the choice of optimal level of vehicle mass for driver i gives:
( )
(
1)
⎥− =0 ⎦ ⎤ ⎢ ⎣ ⎡ + ∂ ∂ + ∂ ∂ − = ∂ ∂ z i i i i i i P e l z g z A z EU λ λ (4)and it can easily be verified that the second order condition holds. A larger vehicle mass will benefit the driver and passengers through a lower injury risk that is reflected both in a lower expected cost due to grief and suffering (g) and a lower insurance premium as also the expected economic loss (l) will decrease. The driver will choose vehicle mass so the marginal benefit of a larger mass equals the increased cost of a marginal increase in mass.
It is well known that a no-fault system will generate a lower level of care than a tort system (Cummins et al, 2001). The level of care with a no-fault system will be lower than the optimal level. Besides this, a no-fault system will also lead to a choice of vehicle mass that is higher than the social optimum if vehicle mass decreases the injury risk in the own vehicle and increases the injury risk in the collision partner. Assuming a society of two drivers the following first order condition for the first driver’s social optimal choice of vehicle mass can be derived:
(
)
(
)
0 ) 1 ( 1 _ _ = ⎥ ⎦ ⎤ ⎢ ⎣ ⎡ + ∂ ∂ + ∂ ∂ − − ⎥ ⎥ ⎥ ⎥ ⎦ ⎤ ⎢ ⎢ ⎢ ⎢ ⎣ ⎡ + ∂ ∂ + ∂ ∂ − = ∂ + ∂ 4 4 4 4 3 4 4 4 4 2 1 4 4 4 3 4 4 4 2 1 y Externalit Negative i j i j z Benefit Internal i i i i i j i e l z g z A P e l z g z A z EU EU λ λ λ λ (5)In a no-fault system the choice of vehicle mass will be made considering only the internal benefit of a large mass while the increased injury risk to other road-users will be ignored.
3. DATA
The dataset includes police reported personal injury accidents involving exactly two passenger cars in Sweden during 1999 to spring 2004. The dataset consists of information on the conditions at the occasion of the accident including speed limit, weather condition and information on involved vehicles including their mass (both total weight and kerb weight), model and existence of airbag. The dataset also includes information on the driver and passengers of the vehicles, their sex, age and their injuries if any. The injuries are categorised in three categories; slight injury, severe injury and fatality.
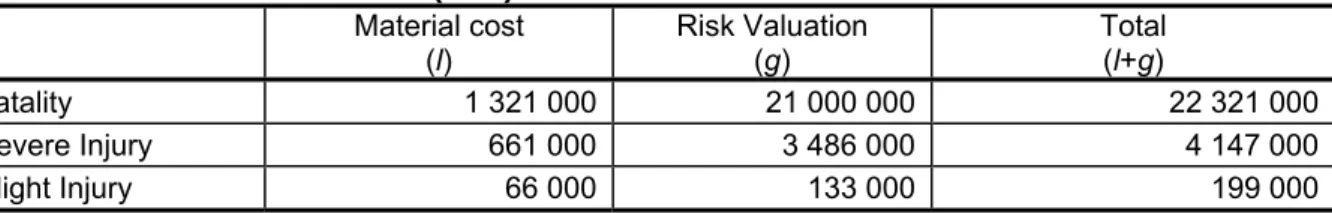
To construct a common unit for the accident cost the official Swedish valuation for fatalities, severe and slight injuries (SIKA, 2008a) in Table 1 is used. The valuation is split into material cost including mainly medical cost and lost production (l) and the risk valuation which we take equal to the pain and suffering loss (g). For each accident the total accident cost is calculated and attributed to the vehicle in which the victims where travelling. Since all injuries are categorised in only three levels, the accident cost attributed to the vehicles will in our dataset not be fully continuous but takes only a few values depending on the number of injured occupants and the category of their injuries.
Table 1 - Valuation of accidents (SEK)
Material cost
(l) Risk Valuation (g) Total (l+g)
Fatality 1 321 000 21 000 000 22 321 000
Severe Injury 661 000 3 486 000 4 147 000
Slight Injury 66 000 133 000 199 000
1 SEK ≈ 10 Euro cent
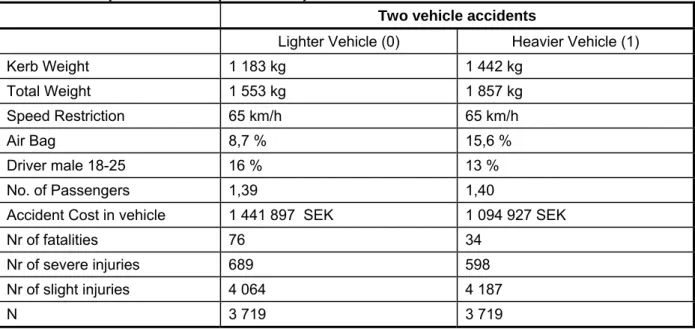
For each accident the lighter of the two vehicles is labelled vehicle 0 and the heavier labelled vehicle 1. Table 2 shows that the average total cost due to injuries and
fatalities is higher in the lighter vehicle in spite of the higher average number of passengers (including the driver) in the heavier vehicle. This is a result of the more than twice as many fatalities in the lighter vehicles. The original dataset included a few vehicles with a mass above what is normally recognized as passenger cars. Accidents including vehicles with a total weight exceeding 3000 kg have therefore been excluded from the dataset, thereby reducing the number of accidents with 4.
Table 2 Descriptive statistics (mean value)
Two vehicle accidents
Lighter Vehicle (0) Heavier Vehicle (1)
Kerb Weight 1 183 kg 1 442 kg Total Weight 1 553 kg 1 857 kg Speed Restriction 65 km/h 65 km/h Air Bag 8,7 % 15,6 % Driver male 18-25 16 % 13 % No. of Passengers 1,39 1,40
Accident Cost in vehicle 1 441 897 SEK 1 094 927 SEK
Nr of fatalities 76 34
Nr of severe injuries 689 598
Nr of slight injuries 4 064 4 187
N 3 719 3 719
4. INTERNAL BENEFIT AND EXTERNAL COST OF INCREASED MASS
Given that an accident occurs we are interested in how the characteristics of the different vehicles affect the injuries and thereby the accident cost and how this cost is divided between the involved vehicles. Separate models are being estimated for the total cost of fatalities and injuries in the lighter vehicle and the cost in the heavier vehicle as a function of the kerb weights of the involved vehicles. Earlier studies (White, 2004; Evans, 2001; Fredette et al, 2008) have examined how vehicle characteristics influence the probability for fatalities or severe injuries given an accident. By instead estimating the influence on the accident cost of different vehicle characteristics a more direct measure of the external cost of vehicle mass are being obtained.
For the costs in the lighter vehicle the following linear model is estimated: ε ν δ γ β β α+ + + + + +
= Mass Mass A N . SpeedRestriction
TC0 0 0 1 1 irbag0 oofPassengers0 (6)
The dependent variable is the total cost of fatalities and injuries λ0(l+g) in the lighter vehicle given a collision with a heavier vehicle. We model the accident cost in the lighter vehicle as a function of the lighter vehicle’s own kerb weight, the kerb weight of the heavier vehicle, the numbers of passengers in the lighter vehicle, the speed restriction at the place of the accident and a dummy for if the lighter car was equipped with an airbag.2 In an extended model dummies for if the driver is a male
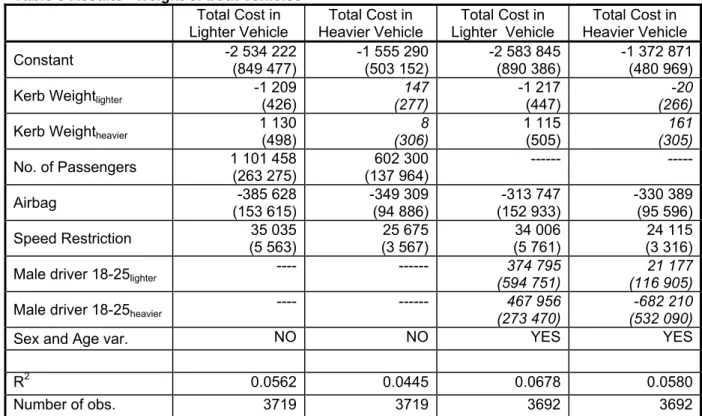
between 18 and 25 in the lighter car and the heavier car respectively is added together with variables measuring the sex and age of all the passengers in the lighter car. Results for both models are presented in Table 3.
As expected, the cost will be reduced with vehicle mass for the lighter vehicle and increased with the mass of the heavier vehicle. The number of passengers in the car as well as the speed limit increases the cost. Existence of an airbag decreases the cost. The own mass will reduce the cost for the lighter vehicle with around 1209 SEK per kilogram while every extra kilogram of kerb weight of the heavier vehicle will increase the cost imposed on the lighter vehicle by around 1130 SEK, a cost that is external to the heavier vehicle. Including dummies for a male driver between 18 to 25 for each of the vehicles and separate variables for different age and sex groups of passengers to capture that elderly people are more fragile than younger people and differences between men and women do not change the conclusions.3
Estimating the corresponding models for the cost of the heavier vehicle gives a quite different result. For the heavier vehicle the cost due to injuries and fatalities is not significantly affected by neither the own mass nor the mass of the lighter vehicle.
ε ν δ γ β β α + + + + + +
= Mass Mass A N . SpeedRestriction
TC1 0 0 1 1 irbag1 oofPassengers1 (7)
Table 3 Results - weight of both vehicles Total Cost in
Lighter Vehicle Heavier Vehicle Total Cost in Lighter Vehicle Total Cost in Heavier Vehicle Total Cost in Constant -2 534 222(849 477) -1 555 290(503 152) -2 583 845 (890 386) -1 372 871(480 969) Kerb Weightlighter -1 209(426) (277)147 -1 217 (447) (266)-20
Kerb Weightheavier 1 130(498) (306)8 1 115 (505) (305)161
No. of Passengers 1 101 458(263 275) (137 964)602 300 - ---Airbag (153 615)-385 628 -349 309(94 886) (152 933) -313 747 -330 389(95 596) Speed Restriction (5 563)35 035 (3 567)25 675 (5 761) 34 006 (3 316)24 115 Male driver 18-25lighter ---- --- (594 751) 374 795 (116 905)21 177
Male driver 18-25heavier ---- --- (273 470) 467 956 (532 090)-682 210
Sex and Age var. NO NO YES YES
R2 0.0562 0.0445 0.0678 0.0580
Number of obs. 3719 3719 3692 3692
Robust standard errors in parentheses; Results non-significant at the 5 % -level in italics
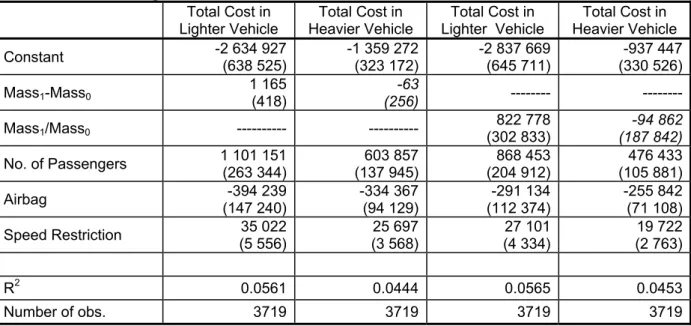
Models where the costs in the involved vehicles are estimated as functions of the mass difference instead of the kerb weights themselves are presented below (Table 4). The kerb weight difference is both expressed as the actual difference in kg between the heavier and the lighter vehicle and as the ratio between the heavier and the lighter vehicle.
Table 4 Results - weight difference Total Cost in
Lighter Vehicle Heavier Vehicle Total Cost in Lighter Vehicle Total Cost in Heavier Vehicle Total Cost in Constant -2 634 927(638 525) -1 359 272(323 172) -2 837 669 (645 711) (330 526)-937 447 Mass1-Mass0 1 165(418) (256)-63 ---Mass1/Mass0 --- --- (302 833) 822 778 (187 842)-94 862 No. of Passengers 1 101 151(263 344) (137 945)603 857 (204 912) 868 453 (105 881)476 433 Airbag (147 240)-394 239 -334 367(94 129) (112 374) -291 134 -255 842(71 108) Speed Restriction (5 556)35 022 (3 568)25 697 (4 334) 27 101 (2 763)19 722 R2 0.0561 0.0444 0.0565 0.0453 Number of obs. 3719 3719 3719 3719
Robust standard errors in parentheses, Results non-significant at the 5 % -level in italics
The model where the mass difference is expressed as a ratio instead of an absolute difference is harder to give an intuitive interpretation but is a common measure in the literature (Evans 2001, Toy and Hammit 2003, Joksch et al 1998). The estimates of the number of passengers, the speed restriction and the airbag are almost constant across specifications. The mass difference – expressed as a difference in kg or a ratio – is highly significant for the cost of the lighter vehicle but not for the cost of the heavier vehicle.
Models have been estimated including also the absolute mass of one of the vehicles resulting in insignificant estimates for the vehicle mass variable given the mass difference; i.e. given the mass difference the vehicle mass per see will not influence the consequences of an accident. This is in contrast to the results in Buzeman et al (1998) that concluded that a uniform mass increase would lower the number of fatalities and Evans (2001) that concluded that in any two-car crash a replacement of both cars with other heavier cars by either a fixed percentage or a fixed amount will reduce the total fatality risk.
5. THE EXPECTED EXTERNAL ACCIDENT COST
Increasing the mass of a vehicle both increases the probability to be the heavier vehicle in a collision and the expected mass difference given a collision with a lighter vehicle. Both these effects affect the expected accident cost in the collision partner. An increased mass also affects the expected internal accident cost. For every vehicle in our dataset both the expected external accident cost and the expected internal accident cost have been calculated. Since the effect of vehicle mass differs depending on if the vehicle collides with a heavier or a lighter vehicle the expected costs is the sum of the expected cost given a collision with a heavier vehicle and the expected cost given a collision with a lighter vehicle weighted with respectively probabilities (eq. 8 and 9).
Expected External Accident Cost
(
)
(
j g l e) (
P zi zj)
(
j(
g l e)
zi zj)
P(
zi zj)
(
j(
g l e)
zi zj)
E λ + (1+ ) = < λ + (1+ ) < + > λ + (1+ ) > (8) Expected Internal Accident Cost
(
)
(
i g l e)
P(
zi zj)
(
i(
g l e)
zi zj)
P(
zi zj)
(
i(
g l e)
zi zj)
E λ + (1+ ) = < λ + (1+ ) < + > λ + (1+ ) > (9) We use the estimated models excluding driver dummy for the total accident cost from Table 3 (column 2 and 3) using mean values for speed restriction, airbag and number of passengers for the lighter and heavier vehicles respectively from Table 2. For each vehicle the mean mass of all vehicles with a mass exceeding or below the mass of the vehicle in question is used as the mass of the collision partner. The probability to collide with a heavier/lighter vehicle is calculated as the proportion of vehicles in our dataset that is heavier/lighter than the vehicle in question.
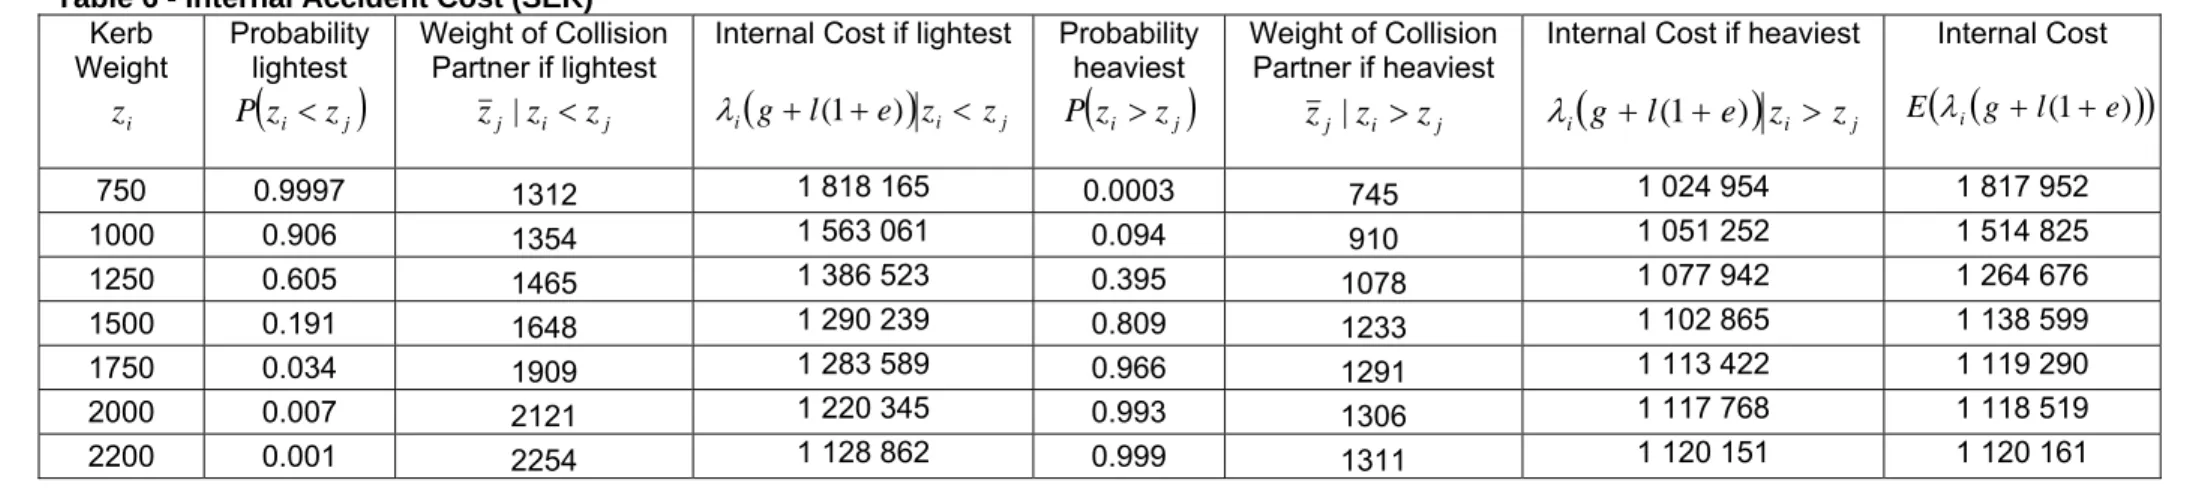
The probability to be the heavier part in an accident increases of course strongly with vehicle mass. Table 5 shows that the expected external accident cost doubles from around 1 million SEK for the lightest vehicles up to over 2 million SEK for the heaviest vehicles. At the same time will the expected internal accident cost decline from 1.8 million SEK for lightest vehicles to only 1.1 million SEK for the heaviest vehicles in the sample (in Table 6).
Table 5 - External Accident Cost (SEK) Kerb Weight i z Probability lightest
(
zi zj)
P < Weight of Collision Partner if lightest j i j z z z | <External Cost if lightest
(
)
i j j g+l(1+e) z < z λ Probability heaviest(
zi zj)
P > Weight of Collision Partner if heaviest j i j z z z | >External Cost if heaviest
(
)
i j j g +l(1+e) z > z λ External Cost(
)
(
g l(1 e))
E λj + + 750 0.9997 1312 1 030 394 0.0003 745 1 188 760 1 030 437 1000 0.906 1354 1 067 418 0.094 910 1 271 710 1 086 671 1250 0.605 1465 1 105 023 0.395 1078 1 351 439 1 202 324 1500 0.191 1648 1 143 223 0.809 1233 1 445 728 1 388 038 1750 0.034 1909 1 182 087 0.966 1291 1 658 417 1 641 991 2000 0.007 2121 1 220 532 0.993 1306 1 922 297 1 917 155 2200 0.001 2254 1 250 985 0.999 1311 2 142 411 2 141 332Table 6 - Internal Accident Cost (SEK)
Kerb Weight i z Probability lightest
(
zi zj)
P < Weight of Collision Partner if lightest j i j z z z | <Internal Cost if lightest
(
)
i j i g +l(1+e) z <z λ Probability heaviest(
zi zj)
P > Weight of Collision Partner if heaviest j i j z z z | >Internal Cost if heaviest
(
)
i j i g+l(1+e) z > z λ Internal Cost(
)
(
g l(1 e))
E λi + + 750 0.9997 1312 1 818 165 0.0003 745 1 024 954 1 817 952 1000 0.906 1354 1 563 061 0.094 910 1 051 252 1 514 825 1250 0.605 1465 1 386 523 0.395 1078 1 077 942 1 264 676 1500 0.191 1648 1 290 239 0.809 1233 1 102 865 1 138 599 1750 0.034 1909 1 283 589 0.966 1291 1 113 422 1 119 290 2000 0.007 2121 1 220 345 0.993 1306 1 117 768 1 118 519 2200 0.001 2254 1 128 862 0.999 1311 1 120 151 1 120 1616. OPTIMAL TAXATION OF THE MASS DEPENDENT EXTERNALITY IN A NO-FAULT INSURANCE SYSTEM
Section 2 showed theoretically that in a no-fault insurance system the drivers will choose vehicle mass in a way that ignores the effect on the injury risk on the collision partner. One way of internalizing the mass externality is to let the driver pay also for injuries in the other involved vehicle so that his utility function includes the
consequences of the accident for those sitting in the other involved vehicle, as in eq. 10.
(
)
(
)
(
)
4 4 3 4 4 2 1 partner collision the in t Accident Exp j i i z i i i i AW AW g Pz A g l e EU _ _ _ cos _ . ) 1 ( 1− + − − − − + + = λ π λ (10)The inclusion of the mass dependent externality can either be done ex post as a liability or ex ante as an additional insurance premium. The insurance premium in the no-fault system should in the latter case be supplemented by the expected total accident cost in the other vehicle so that the new insurance premium π’i equals:
(
)
(
(1 ))
'i=πi +Aλj g+l +e
π (11)
Using eq. 11 a multiplicative premium tax (t) on the insurance premium (π) can be introduced to internalize the external accident cost4:
(
)
) 1 ( ) 1 ( ) 1 ( ' e l e l g e l t i j i i i i + + + + + = = λ λ λ π π π (12)Where λil(1+e)is the expected economic loss that is compensated by the insurance company and λj
(
g+l(1+e))
is the expected total accident cost in the collision partner.The accident probability A for a two-vehicle collision accident, which varies between drivers depending on driven distance, behaviour and personal characteristics, will be calculated by the insurance company.
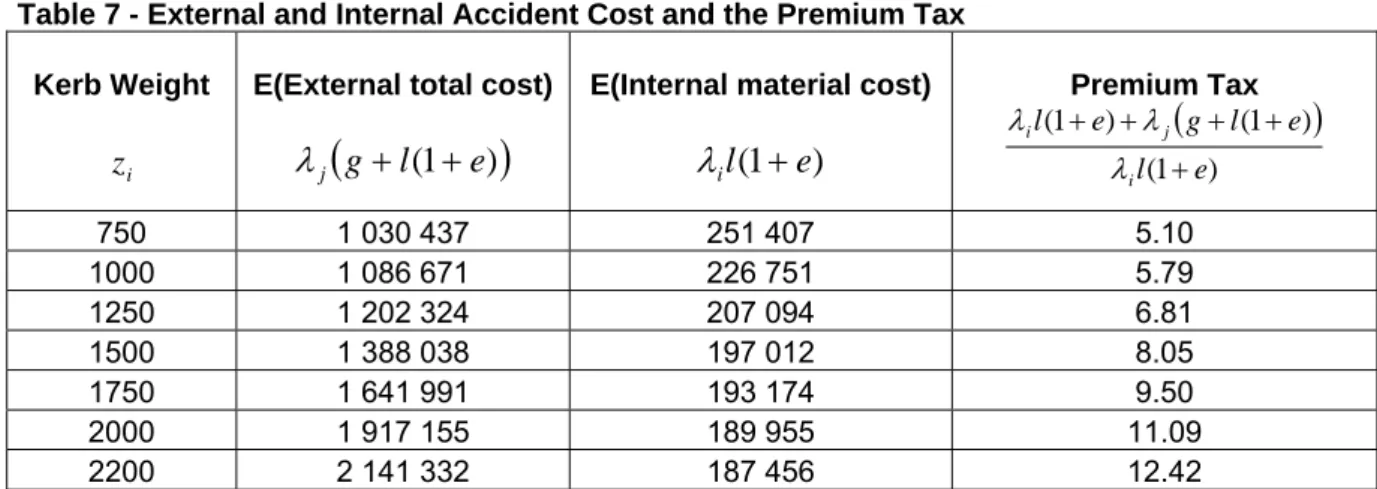
The expected economic loss λil(1+e) is estimated in the same way as the total cost but using only the material cost component in Table 1. The same models have been estimated as in eq. 6 and 7 with the only difference that the accident cost includes only the material cost. Using this expected internal material cost the premium tax for different vehicle masses can be calculated (Table 7).
Table 7 - External and Internal Accident Cost and the Premium Tax Kerb Weight
i
z
E(External total cost)
(
g l(1 e))
j + +
λ
E(Internal material cost) ) 1 ( e l i + λ Premium Tax
(
)
) 1 ( ) 1 ( ) 1 ( e l e l g e l i j i + + + + + λ λ λ 750 1 030 437 251 407 5.10 1000 1 086 671 226 751 5.79 1250 1 202 324 207 094 6.81 1500 1 388 038 197 012 8.05 1750 1 641 991 193 174 9.50 2000 1 917 155 189 955 11.09 2200 2 141 332 187 456 12.42The expected marginal external cost increases when the mass increases both because the aggressivity is higher and the probability of being the heavier vehicle increases with mass. At the same time the expected internal cost decreases. Consequently, the multiplicative tax will not be constant and increases strongly with mass (Figure 1).
Figure 1- Premium Tax as a function of Kerb Weight
4 6 8 10 12 14 Pr e m iu m Ta x 500 1000 1500 2000 2500 Kerb Weight (kg)
7. CONCLUSION
The literature shows that vehicle mass is a crucial factor behind how the injuries are distributed among the involved vehicles in a two-vehicle crash. A larger vehicle mass will protect the occupants in the vehicle while on the same time inflict a higher injury risk on the occupants in the collision partner.
We have shown on Swedish data that a kg of kerb weight of a vehicle will increase the accident cost in the collision partner with 1130 SEK given that the collision partner is lighter than the vehicle in question. At the same time, a kg of kerb weight will decrease the accident cost in own vehicle with 1209 SEK given a collision with a heavier vehicle. Given that a vehicle is the heavier one in the collision neither the own weight nor the weight of the other vehicle have any significant influence of the accident cost.
In a no-fault system, like in Sweden, the insurance premium is set according to the expected accident cost in the own vehicle and a larger vehicle mass that decreases the expected accident cost in own vehicle will thereby result in a lower insurance premium. Since the vehicle mass influences the injuries that occur in the collision partner, one way to internalize the effect of mass is to let each vehicle pay also for the injuries in the collision partner. In this study a multiplicative premium tax that depends on vehicle mass is calculated. The introduction of this premium tax will result in an insurance premium that includes both the expected material accident cost in own vehicle and the total accident cost in the collision partner. Such a premium tax will raise substantial revenue to the government that will equal the total accident costs due to two-vehicle accidents.
Many of the heaviest vehicles in the study are Sport Utility Vehicles or minibuses with a geometry and stiffness that differs from ordinary passenger cars. Since the dataset lacks a suitable measure for stiffness the effect of stiffness cannot be separated from the effect of mass. A part of the effect of mass estimated in this study might therefore be due to stiffness. As long as the relationship between stiffness and mass is constant between different car models this is a minor problem in setting a correct premium tax. This issue needs to be further investigated if a weight dependent premium tax should be introduced.
While most studies analyzing the effect of vehicle mass use the fatality or injury risk of the driver as the measure of crashworthiness or aggressivity this study instead looks directly at the accident cost due to injuries and fatalities of all occupants in the involved vehicles. The calculated premium tax and expected costs therefore cover the injuries and fatalities for also the passengers in the vehicles. Since the premium tax is multiplicative no assumptions are made considering the accident probability that still will be calculated by the insurance company in their premium setting. In real life two-car collisions are not the only type of accidents and the insurance premium is set also in relation to the expected loss due to single-vehicle accidents. This paper has given a first example, calculated from real accident data, on how the mass externality can be internalized by a premium tax. For a premium tax that also takes into account other types of accidents the model must be extended. For a comparison, of the 276 individuals that were killed in traffic accidents sitting in passenger cars in Sweden in 2007, only 72 were killed in accidents involving two passenger cars while
116 were killed in single vehicle accidents (SIKA, 2008b). Collision accidents between two passenger cars are thereby only a minor part of the total expected accident cost that the insurance companies base their premiums on.
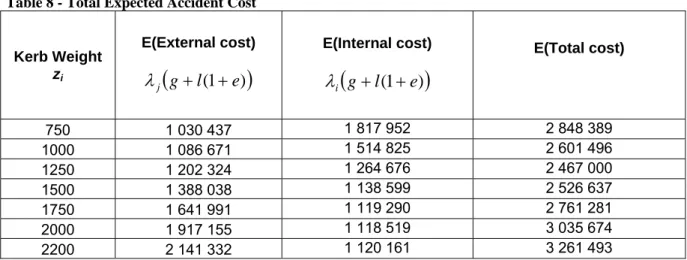
A higher mass will both increase the expected accident cost in the collision partner and decrease the expected accident cost in own vehicle. So what is the optimal vehicle mass to minimize the expected total accident cost in both vehicles? This depends on the mass distribution in the car fleet. Using the mass distribution in our dataset that consists of vehicles involved in two-vehicle accidents the expected total accident cost for different kerb weights can be seen in Table 8. The total accident cost due to the injuries in both involved vehicles is minimized at a kerb weight of 1310 kg according to our model. This is a kerb weight slightly below the median and mean kerb weight in the dataset.
Table 8 - Total Expected Accident Cost
Kerb Weight zi E(External cost)
(
g l(1 e))
j + + λ E(Internal cost)(
g l(1 e))
i + + λ E(Total cost) 750 1 030 437 1 817 952 2 848 389 1000 1 086 671 1 514 825 2 601 496 1250 1 202 324 1 264 676 2 467 000 1500 1 388 038 1 138 599 2 526 637 1750 1 641 991 1 119 290 2 761 281 2000 1 917 155 1 118 519 3 035 674 2200 2 141 332 1 120 161 3 261 493Finally, our model give no support neither to downsize the vehicle fleet nor upsize it but suggests that it is the mass difference that should be reduced.
NOTES
1 The formula originates from Joksch et al (1998), p 11.
2 It is not self-evident whether the kerb weight (vehicle weight including fuel and a
driver at 70 kg) or the total weight (kerb weight and maximum allowed load) best reflects the actual mass of the vehicle at the accident. Both mass variables have been tested and the effect on the premium tax is not affected by the choice.
3 The logic behind the driver dummy is the lack of information in our dataset on actual
speed of the vehicles at the time of the accident. Including a dummy for if the driver is a man age 18 to 25 is an attempt to capture the suspicion that young men drive faster than other groups and correct for this under the assumption that young men are overrepresented in certain vehicle and accident types. The driver dummy is not significant neither for the driver of the lighter nor the heavier car.
4 Using:
(
(
)
)
) 1 ( ) 1 ( 'i= Aλil +e +Aλj g+l +e πREFERENCES
Ahmad, S., Greene, D. L. (2005). The Effect of Fuel Economy on Automobile Safety: A Reexamination. Transportation Research Record: Journal of the Transportation Research Board, 1941, 1-7.
Buzeman, D. G., Viano, D. C. Lövsund, P. (1998). Car occupant safety in frontal crashes: a parameter study of vehicle mass, impact speed and inherent vehicle protection, Accident Analysis and Prevention 30, 713-722.
Crandall, R. W., Graham, J. D., (1989). The effect of Fuel Economy Standards on Automobile Safety, Journal of Law and Economics 32 (1), 97-118.
Cummins, D. J., Phillips, R. D., Weiss, M. A. (2001) The Incentive Effects of No-Fault Automobile Insurance. The Journal of Law and Economics 44 (2), 427-464.
Elvik, R. (1994) The external costs of traffic injury: definition, estimation, and possibilities for internalisation, Accident Analysis and Prevention, 26, 719-732.
Evans, L. (2001). Causal Influence of Car Mass and Size on Driver Fatality Risk, American Journal of Public Health 97 (7), 1076-1081.
Fredette, M., Mambu, L. S., Chouinard, A. Bellevance, F. (2008). Safety impacts due to the incompatibility of SUVs, minivans and pickup trucks in two-vehicle collisions, Accident Analysis and Prevention 40, 1987-1995.
Gayer, T. (2004). The Fatality Risks of Sport-Utility Vehicles, Vans, and Pickups Relative to Cars, The Journal of Risk and Uncertainty 28 (2), 103-133.
Joksch, H., Massie, D. Pischler, R. (1998). Vehicle Aggressivity: Fleet Characterization Using Traffic Collision Data, DOT-HS-808-679. Washington, DC: National Highway Traffic Safety Administration, U.S. Dep’t of Transportation, February 1998.
Parry, I. W. H., Walls, M. Harrington, W. (2007) Automobile Externalities and Policies, Journal of Economic Literature 45 (2), 373–399.
SFS 2007:460, Lag (2007:460) om skatt på trafikförsäkringspremie m.m. Svensk Författningssamling, www.riksdagen.se, 2007-06-07.
SIKA (2008a). SIKA PM 2008:3 Samhällsekonomiska principer och kalkylvärden för transportsektorn: ASEK 4.
SIKA (2008b). SIKA Statistik 2008:27 Vägtrafikskador 2007.
Stigson, H. (2009). Variation in crash severity depending on different vehicle types and objects as collision partners, International Journal of Crashworthiness, forthcoming.
Swiss Re (2007). European motor markets. Swiss Reinsurance Company, Zurich 2007.
Toy, E., L. Hammit, J. K. (2003). Safety Impacts of SUVs, Vans, and Pickup Trucks in Two-Vehicle Crashes, Risk Analysis 23 (4), 641-650.
White, M. J. (2004). The “Arms Race” on American Roads: The Effect of Sport Utility Vehicles and Pickup Trucks on Traffic Safety, Journal of Law and Economics 47 (2), 333-355.
World Health Organization (2004); World report on road traffic injury prevention: summary, Geneva, 2004