notat 43-1997
Variables and criteria for
evaluation causes by 4 0 of vehicle reactions railway alignment A /N 2 0 - - ---Author Research division Project number Project name Sponsor Distribution SSSSSSSSSSSSSSSS IIIIIIIIIIIIIII RRRRRRRRRRRRR Björn Kufver Transport Systems 70041
Interaction between track geometry
and railway vehicles
KFB, SJ, Banverket
and Adtranz Sweden
Free
Swedish National Road and Å Transport Research Institute
å'
www JÄRNVÃGSTEKNIK
,8,2%
msnwnoum rön umnxosnsxmx
KUNGL TEKNISKA HÖGSKOLAN
TRITA-FKT Report 1997:29
..
ISSN 1103 - 47OX
V39- ochtmnspart-'famkningsinstitutgt
ISRN KTH/FKT/FR -- 97/29 -- SE
VTI Notat 43-9741
9;
Variables and criteria for
evaluation of vehicle reactions
caused by railway alignment
Björn Kufver
Postal address Visiting Address Telephone Telefax
Royal Institute of Technology Teknikringen 8 +46 (0)8 790 76 57 +46 (0)8 790 76 29 Railway Technology
8-100 44 Stockholm VTI
S-581 95 Linköping Olaus Magnus Väg 37 +46 (0)13 20 40 00 +46 (O)l3 14 14 36 & \ ,////
Preface
This work has been carried out at the Division of Railway Technology, Department of Vehicle Engineering, Royal Institute of Technology (KTH), Stockholm and the Railway Systems Group, Division of Transport Systems, Swedish National Road and Transport Research Institute (VTI), Linköping.
The work is part of the joint project concerning track/vehicle interaction commissioned by Adtranz Sweden, the Swedish National Rail Administration (Banverket), the
Swedish Transport and Communications Research Board (KFB), the National Swedish ' Board for Technical and Industrial Development (NUTEK), the Swedish State Railways
(SJ), and the Swedish National Road and Transport Research Institute (VTI).
The financial support provided by Adtranz Sweden, Banverket, KFB, SJ, and VTI for the present work is gratefully acknowledged.
I would also like to thank Professor Evert Andersson at KTH for his support during the course of the work.
Linköping, May 1997
Cover illustration: Time history of simulated guiding force (Y-force) for the first external wheel of an electric multiple-unit set when entering a Circular curve with radius 3 00 m at a Speed of 50 km/h.
Abstract
This report describes criteria for the evaluation of different alignment alternatives. The
evaluation is assumed to be conducted with simulations of vehicle reactions. The reactions are described with variables correlated to safety, track fatigue, wear, and
passenger comfort.
Variables studied should normally be based on 99.85-percentiles, in order to avoid anomalies which may have influence on the maximum values. Since the interesting parts of the alignment are those where the curvature is not constant, median values should normally not be used.
When quantifying forces and climbing ratios, the speed of the simulated vehicles should correspond to a target speed, which is the lowest value of 110% of permissible speed and the speed which corresponds to 110% of permissible cant deficiency. When quantifying passenger comfort, the target speed may be 100% of permissible speed or the speed which corresponds to 100% of permissible cant deficiency.
Different levels of track irregularities should be analysed separately and not mixed in the statistical evaluation where confidence intervals are calculated.
If passenger comfort is to be maximised, passenger comfort on curve transitions (PCT) may be used as an object function, at least when the alignments in question contain the clothoid type of transition curve. There are no generally accepted limits for PCT.
The following variables have predefined limits and may be used as boundary conditions in the analysis:
Maximum vertical wheel forces,
maximum guiding forces,
track shift forces, climbing ratios,
low frequency accelerations, and low frequency jerks.
Wear index should be monitored but does not have any generally accepted limit. For
tracks with no passenger trains, wear index or an index derived from vertical wheel
forces, guiding forces, and/or track shift forces may be more suitable as an object function.
Keywords: Vehicle dynamics, simulation, track/vehicle interaction, track geometry,
alignment, transition curve, crossover, rail inclination, track stiffness, wheel forces, guiding forces, track shift forces, climbing ratios, wear index, passenger comfort.
TABLE OF CONTENTS
S h i -§9 9 ! Preface Abstract 1. IntroductionAnalysis of non-stationary situations Test speed
The use of regression analysis and confidence intervals Criteria concerning track fatigue, safety and rail wear
5.1 Quasi-static vertical wheel forces
5.2 Maximum vertical wheel forces 5.3 Guiding forces
5.4 Track shift forces 5.5 Climbing ratios 5.6 Wear index 6. Comfort criteria
6.1 Mean comfort
6.2 Comfort on curve transitions 6.3 Comfort on discrete events 6.4 Peak acceleration
6.5 R.m.s. acceleration
6.6 Quasi-static (or low frequency) lateral acceleration
6.7 Low frequency lateral jerk
6.8 Motion sickness
7. Conditions during test and simulation 8. Final discussion and conclusions References
Appendix 1 Variables and limit values for evaluation of railway
'
alignments
Appendix 2 Terminology and definitions Appendix 3 Notations iii _ 0 _ 0 _ 0 ©O O O O \ 1 0 \O \ O \ U1 -I Ä N 1-* l -k t -Ål -l b -d b -Ål -Ål -Ål -ÅH O in U I -l ä-I L N O O C N h -i r -t H \ D \ l
1.
Introduction
In the area of track - vehicle interaction, especially curve negotiation, the track aspect has not been studied as closely as vehicle aspects (ORE 1990). The track aspects which
influence track - vehicle interaction can be divided into different areas, such as
alignment and cant,
gauge widening, rail inclination and rail profile, track irregularities,
rail lubrication,
track stiffness and damping.
In this report, the focus is on evaluation of alignments. The reason for this is that many new railway lines are being planned, both in Sweden and abroad, and that the changes of alignment of existing lines are often associated with high costs. Therefore, the alignments of new railways should be adapted for future traffic demands, at least when this can be achieved without marginal costs.
The aim of this work is to define variables which could be used in the evaluation of different alignments. The variables could be used as object functions or definition of boundary conditions. In the latter case, the variables should have defined limits.
It has been concluded that, whenever possible, the same variables and limits should be used in the evaluation of alignments as in the evaluation of different vehicles. Recently, CEN TC 256 WG 7 (1995), CEN TC 256 WG 10 (1996) and UIC (1997) have been working on standardisation of evaluations, tests and approval of railway vehicles. Their procedures should be used whenever possible and relevant, but additional variables may
be used. In this document, comparisons are also made with the variables, procedures and
provisional limits used in the Swedish acquisition of high speed trains.
One major difference between the evaluation of vehicles and the evaluation of alignments is that the evaluation of vehicles is normally performed under stationary conditions regarding track geometry (straight lines or circular curves, with a constant level of track irregularities) while the evaluation of alignments most often concerns changes of radii, with or without transition curves.
It should also be noted that comparisons between different alignment alternatives must usually be made through simulations of vehicle reactions, rather than full scale testing.
2..
Analysis of non-stationary situations
In CEN TC 256 WG 10 (draft March 1996) and in UIC 518 OR (draft January 1997) it is stated that the tests should be made in the following three areas; straight lines, curves with large radius (R>600 m) and curves with small radius (250 ng_<_600 m). Each area should be tested in a minimum of 25-50 test sections, each with a length of at least
70 m. Transition curves and circular curves should be evaluated separately. CEN explicitly and UIC implicitly alsostated that maintenance status must remain the same over the entire length of a test section.
UIC 518 OR also recommended that tests should be made on turnouts (turnout route) at maximum permissible speed.
The statistical analysis prescribed is mostly related to stationary conditions. In the presented time histories, the measured variables are randomly distributed around a
constant value (constant Y-force, constant Q-force etc.). On transition curves and crossovers, such constant values do not exist. UIC 518 OR stated that median values should not be used on transition curves.
Both CEN TC 256 WG 10 and UIC 518 OR disregarded curves with smaller radii than
250 m. However, ORE B176 (1989b, 1989c) required tests on curves with radii down to 150 m and on crossovers with radii of 190 m.
Both CEN TC 256 WG 10 and UIC 518 OR avoided using minimum and maximum values since these may include anomalies. (Such anomalies may occur both in full-scale testing and in simulations). They stated that normally the centiles corresponding to the
statistical quantities for frequencies F1=0.15% (when the measured variable has a
negative sign) and F2=99.85% of the distribution function, should be used in the
analysis. In some cases, the median (F0=50%) should be used.
When comparing different alignments, the most interesting parts of the track are where the curvature is not constant. In these cases (for example on crossovers) the median value is not relevant. It should also be noted that the 99.85-percentile may systematically disregard the most interesting section of the track. For example in a clothoid circle -clothoid combination, the highest S-forces may be expected at the tangent point between a transition curve and the circle. At this point, the vehicle is running at the maximum lateral acceleration combined with yaw acceleration. (Such peaks will be even more obvious a few metres after a change of curvature without a transition curve.) For a
500 m long curve combination, use of the 99.85-percentile means that data from the
worst 0.75 m are neglected. In order to avoid biased results, all compared alternatives of non-stationary situations should have the same evaluation length.
In some studies, it may be relevant to compare alignments with slightly different radii. One such study might concern the net effect when a lengthening of the transition curves
requires a reduction of the radius of an adjacent circle (see Baluch 1983, Hashimoto
1989 and Kufver 1997a). In such studies, the median values in the circular part alone might be studied.
In Swedish test procedures for approval of new vehicles, the limit values for certain forces are compared with the medium value plus three standard deviations of the
measured forces (Andersson, von Bahr & Nilstam 1995). However, there is a major
difference between the standard deviations caused by irregularities on straight lines and on circular curves, and the standard deviations caused by changes in the alignment. If there were no standard deviations of the first type (caused by irregularities) the
measured force, on a circular curve with small radius, would be constant and would
represent the sought maximum force. In that case, it would be irrelevant to superimpose standard deviations, caused by another constant level of forces on the adjacent track elements and which do not reflect any dynamic behaviour.
Hence, when evaluating alignment alternatives, it seems more reasonable to compare the
3.
Test speed
According to CEN TC 256 WG 10, train speeds in the tests on straight track must be in the range 70% to 110% of permissible speed. On curves, the actual test speeds must generate cant deficiencies of 70% to 110% of permissible value (but the speed must not exceed 110% of permissible speed). The actual cant deficiencies in the tests must be evenly spread within this range. CEN stated that according to the state-of-the-art teChnology, permissible cant deficiencies of 130 mm apply to freight wagons and 150 mm to traction units and passenger coaches. Deviations are permitted but must be documented.
According to UIC 518 OR, the actual test speed on large radius curves must be in the
range from the vehicle operating speed limit (Vlim) minus 5 km/h to 110% of Vlim plus
5 km/h. On curves, a permissible cant deficiency (Iadm) from 130 mm to 165 mm,
depending on the speed and the type of train, must be used in revenue service. In tests and approvals, the cant deficiency must be in the range 70% to 115% of permissible cant deficiency.
In full scale testing, the actual train speed may be difficult to control. Both CEN and UIC stated that regression analysis must be used to analyse the measured data. According to CEN, for each variable studied, an upper limit for a confidence interval must be calculated for 110% of the permissible speed (or cant deficiency). UIC implicitly indicated that it is sufficient to study the upper limit for the confidence interval at 100% of the permissible speed (or cant deficiency).
In simulations, it is not difficult to control the speed of the train. It should be sufficient to calculate the vehicle reactions at the target speed. The target speed should be the lower of 110% of permissible speed and the speed which corresponds to 110% of permissible cant deficiency, in order to correspond to the evaluation according to CEN TC 256 WG 10. This target speed is slightly different to that stated in UIC 518 OR, and slightly different to possible operating speeds according to the Swedish ATP system. (The Swedish ATP system does not brake the train unless the driver exceeds the permissible speed by 10 km/h.) However, the evaluation of passenger comfort may be more adequate at a target speed related to 100% of permissible speed and 100% of permissible cant deficiency respectively.
ln certain studies, it may be relevant to compare alignments with slightly different radii
(see Chapter 2). In such studies, it may be reasonable to use the same test speed in all
4.
The use of regression analysis and confidence intervals
' The CEN TC 256 WG 10 and UIC 518 OR documents contain descriptions of how the scatter of results should be analysed with linear regression. The scatter of the measured percentiles in full-scale testing may be explained by differences in test speed, different track irregularities (and track stiffness) on different test sections and in different initial conditions when the test vehicle enters a test section.
In the suggested regression analysis, only the train speed, or radius and cant deficiency (or quasi-static lateral acceleration), are used as independent variables. Other influential variables are represented by the use of confidence intervals. (However, CEN TC 256 WG 10 stated that data points which exceed the confidence interval should also be taken
into account in the evaluation.)
In simulations, many of these differences are eliminated. It is not difficult to control the speed when analysing a particular alignment, so the same result will be achieved unless something is changed. It also seems better not to mix results from test sections with
different maintenance status, but to present the results for different levels of track
irregularities separately. The statistical analysis seems appropriate only for alignments with the same target speed and the same track quality. When using different data files containing track irregularities to superimpose the alignment, this statistical analysis may be done by using different phase shifts of the track irregularities. With this methodology, the confidence intervals are expected to be smaller than the confidence intervals from the analysis recommended by CEN TC 256 WG 10 and UIC 518 OR.
5.
Criteria concerning track fatigue, safety and rail wear
5.1
Quasi-static vertical wheel forces
According to CEN TC 256 WG 10 and UIC 518 OR, this criterion should be used when the radius is in the range 250 m5R5600 m.
The quasi-static vertical wheel forces are calculated by low-pass filtering with a 3 dB cut-off frequency within the frequency range 20-30 Hz. The gradient of the filter should be at least 24 dB/octave.
The median value of the filtered signal should be used in the regression analysis. UIC 518 OR explicitly stated that the median value should be calculated from the total of the external wheels. The medium value of the medians from different test sections should be calculated. CEN TC 256 WG 10 stated that an upper level for a confidence interval should be calculated with a confidence coefficient of 95%. In the case of a one-dimensional regression analysis, this confidence interval may be Simplified as medium value plus 22 standard deviations.
The limit for the quasi-static vertical wheel forces is provisionally 145 kN and takes into account 46 kg/metre rails with a strength of 700 N/mmz.
It was not stated why this analysis should be restricted to radii of 250-650 m. The use of median values is regarded as relevant only when elements with constant curvature are evaluated.
5.2 Maximum vertical wheel forces
CEN TC 256 WG 10 and UIC 518 OR stated that the same filtering should be
performed as for the quasi-static vertical wheel forces, see Section 5.1.
The 99.85-percentiles of the filtered signal should be used in the regression analysis.
UIC 518 OR stated that on curves, the centiles should be calculated from the total for
the external wheels. CEN TC 256 WG 10 stated that an upper level for a confidence interval should be calculated with a confidence coefficient of 95%. In the case of a one-dimensional regression analysis, this confidence interval may be Simplified as medium value plus 22 standard deviations. UIC 518 OR mentioned only the calculation of medium value plus 2.2 standard deviations.
According to CEN TC 256 WG 10, the limit for the maximum vertical wheel forces is provisionally 170 kN and is based on 46 kg/metre rails with a strength of 700 N/mmz. UIC 518 OR applied limits (Qlim) depending on the vehicle Operating speed limit (Vu-m):
Vlim5160 Qlim =
160 km/h<Vl,-m5200 km/h Qlim = 190 kN
200 km/h<Vlimg250 km/h Qlim = 180 kN
250 km/h<Vlim_<_300 km/h Qlim = 170 kN
In Sweden, the corresponding signals are low-pass filtered with a 90 Hz 3 dB cut-off frequency. An upper level for a confidence interval is calculated as the medium value plus 3 standard deviations (see Chapter 2). Although changes in alignment should generate almost no changes within the frequency range 30-90 Hz, it may be important to monitor the general level of the vertical wheel forces (caused by short-wave track irregularities and stiffness variations). It seems reasonable to follow the same calculation procedures as above. Hence, the 99.85-percentiles should be used and an upper level for the confidence interval should be calculated as medium value plus 22 standard deviations. Since the Swedish provisional limit for dynamic vertical forces is 170 kN and refers to 90 Hz low-pass filtered forces, this criterion is much more restrictive than the CEN and the UIC criteria, and may be need to be revised (Andersson
1997).
5.3
Guiding forces
According to CEN TC 256 WG 10 and UIC 518 OR, this criterion should be used when the radius is in the range 250 ng_<_600 m.
CEN TC 256 WG 10 and UIC 518 OR stated that the same filtering should be applied as
for the quasi-static vertical wheel forces, see Section 5.1.
The median value of the filtered signal should be used in the regression analysis. UIC 518 OR and CEN TC 256 WG 10 suggested the same statistical analysis as for the
quasi-static vertical wheel forces, see Section 5.1.
The limit for the quasi-static guiding forces is provisionally 60 kN and is based on 46 kg/metre rails with a strength of 700 N/mmz.
The CEN and UIC documents did not state why this analysis should be restricted to radii of 250-650 m. The use of median values is regarded as relevant only when elements with constant curvature are being evaluated.
In Sweden, the guiding forces are filtered with a low-pass filter with a 3 dB cut-off frequency of 90 Hz. An upper level for a confidence interval is calculated as the medium value plus 3 standard deviations. A provisional limit is 45 kN when curve radius is greater than 300 metres and 55 kN when curve radius is 300 metres or less.
Pfarrer (1990) has reported that the Swiss Federal Railways (SBB) have used both
dynamic and quasi-static guiding forces in the specifications of new vehicles. The limits were 110 kN and 70kN respectively. However, the filtering of the measured guiding forces and the associated statistical methods were not described.
Since neither median values nor medium values of a single time history are relevant where curvature is not constant, the most reasonable way of monitoring the guiding forces is to use the 99.85-percentiles of the 90 Hz low-pass filtered forces. In a subsequent statistical evaluation, the medium value plus 2.2 standard deviations could be used in analogy with the 90 Hz low-pass filtered vertical forces. The Swedish provisional limits of 45-55 kN are a much more restrictive criterion than the CEN and UIC criteria.
5.4 Track shift forces
CEN TC 256 WG 10 and UIC 518 OR stated that the same filtering should be performed as for the quasi-static vertical wheel forces, see Section 5.1. After the low-pass filtering, a sliding mean should be calculated over 2 metres. This sliding mean should be calculated at 0.5 metre intervals.
The 0.15 and 99.85-percenti1es of the filtered signal should be used in the regression analysis. UIC 518 OR stated that the centiles should be calculated from the total of the axles. CEN TC 256 WG 10 stated that an upper level for a confidence interval should be calculated with a confidence coefficient of 99%. In the case of a one-dimensional regression analysis, this confidence interval may be Simplified as medium value plus 3 standard deviations. UIC 518 OR mentioned only the calculation of medium value plus 3 standard deviations.
The limit for the track shift forces is k4'(10+2'Q0/3) kN, where 2 Q0 is the static vertical
axle load and [(4 is normally 1.0, except for freight wagons for which k4 is 0.85. The limit is based on 46 kg/metre rails in ballasted track with a maximum Sleeper spacing of 650 mm.
In Sweden, the track shift force has previously been calculated as the minimum value in
a 2 m rectangular window. The factor k4 has been set to 0.85. The CEN and UIC sliding
mean leads to a more restrictive criterion. This may be regarded as acceptable in combination with the less restrictive rules concerning test speed (see Section 3) and the
less restrictive k4=1.0.
5.5
Climbing ratios
CEN TC 256 WG 10 stated that this criterion should be used on curved track with radius Rz250 m, while UIC 518 OR stated that the criterion should be used on curved track with radius R_>_3OO m.
CEN TC 256 WG 10 and UIC 518 OR stated that the same filtering should be
performed as for the quasi-static vertical wheel forces, see Section 5.1. After the
low-pass filtering, a sliding mean should be calculated over 2 metres as for track shift forces,
see Section 5.4.
The 0.15 and 99.85-percentiles of the filtered signal should be used in the regression analysis. UIC 518 OR and CEN TC 256 WG 10 suggested the same statistical analysis
as for the track shift forces, see Section 5.4.
The limit for the climbing ratio is normally 0.8 (and according to CEN TC 256 WG 10
in some cases 1.2).
CEN TC 256 WG 10 explicitly stated that the criterion should be used on curves with radius Rz250 m. It was not clear why the criterion should not be used on curves with radius R<250 m. Even though main lines rarely have smaller radii, most railway companies have turnouts and single and double slips with radii of 185-190 m. It seems
reasonable to use the criterion in all alignments, including curves with radii R<250 m and straight lines.
5.6 Wear index
According to ORE (ERRI) B176 (l989a, l989b, 1989c) the rate of wear is a major
criterion for assessing performance on curves. The wear is assumed to be proportional to the energy dissipation in the contact patch. Hence, the wear index for the wheel and/or the rail may be calculated as the derivative of the energy dissipation with respect to running distance.
In Sweden, when evaluating different vehicles, the wear index is calculated as the
average index over a longitudinal distance on circular curves. No defined limit exists. When evaluating alignments, the wear on the rails instead of the wear on the wheels is in focus, especially since the wear may be concentrated longitudinally to locations
where the radii change (with or without intermediate transition curves). Hence, it seems
reasonable to calculate longitudinal series of wear index as the sum of the wear index for the right wheels and the left wheels respectively. These two longitudinal series of wear index should be smoothed (since the simulations may create insignificant
anomalies) but with care (since peak values are of interest).
It is suggested that the following filtering and statistical analysis be performed:
The wear index for the right rail and left rail respectively is averaged in a sliding 2-metre rectangular window. The 99.85-percentiles of the averaged signals should be used in the regression analysis. The medium. values for each rail should be calculated.
6.
Comfort criteria
6.1 Mean comfortCEN TC 256 WG 7 stated that evaluation of the comfort function NMV is mandatory and the comfort functions NVD and NVA are non-mandatory.
The functions consist of linear sums and root-sums-of-squares (r.s.s.) of band-pass filtered and weighted accelerations in the frequency range 0.4 to 80 Hz. These functions
were developed in ORE (ERRI) Committee B153.
No limits were suggested.
Since the three comfort functions NMV, NVD and NVA do not take into account accelerations with frequencies below 0.4 Hz, they will probably not contain any interesting differences in the comparison between different alignment alternatives. 6.2 Comfort on curve transitions
CEN TC 256 WG 7 stated that evaluation of the comfort on curve transitions, PCT, is
non-mandatory.
The PCT functions show the percentage of passengers who regard comfort as very uncomfortable or uncomfortable on a scale which also contained the three levels acceptable , comfortable and very comfortable . The comfort rating should take into account any aspects of the lateral ride (Chapell 1984).
The comfort tests were conducted by British Rail with HST and APT trains. According
to Harborough (1986) the comfort disturbances were located to transition curves
(clothoids) where the lateral acceleration increased, and to large misalignments. There were no comfort disturbances on transition curves where the lateral acceleration decreased and the comfort disturbances seemed higher on transitions within compound curves than in ordinary entry transitions. These differences may be explained by the expectations of the passengers.
Transition curves and misalignments were analysed separately. In the analysis of the transition curves, some of the transition curves were excluded since they contained large misalignments and it was not possible to judge the prime reason for the discomfort. For passenger comfort on curve transitions, British Rail derived the following functions for standing and seated passengers respectively:
where
[6.1] [6.2]
PCT = max(2.80- 33 + 203 y_ 11.1, 0) + 0.185- (ef-283
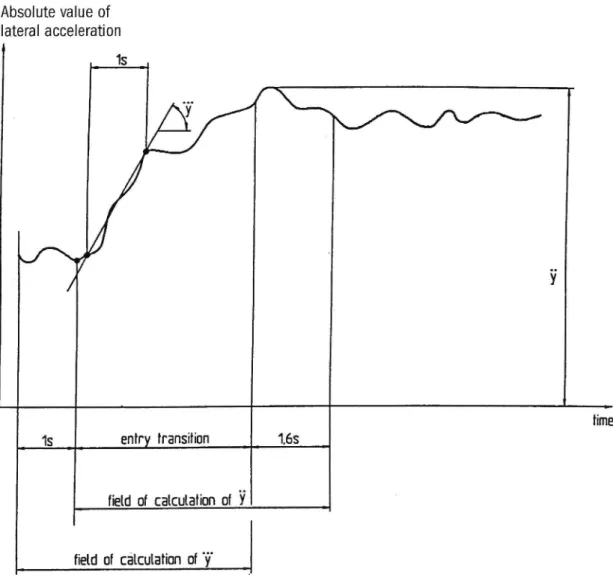
PCT = max(0.88 - + 095 . _ 5.9, 0) + 0.120 . (19)1.626y = maximum absolute value of lateral acceleration of vehicle body, in the time interval between the beginning of the transition and the end + 1.6 s, expressed in per cent of g
= maximum absolute value of lateral jerk of vehicle body, in the time interval between l s before the beginning of the transition and the end, expressed in per cent of g per second
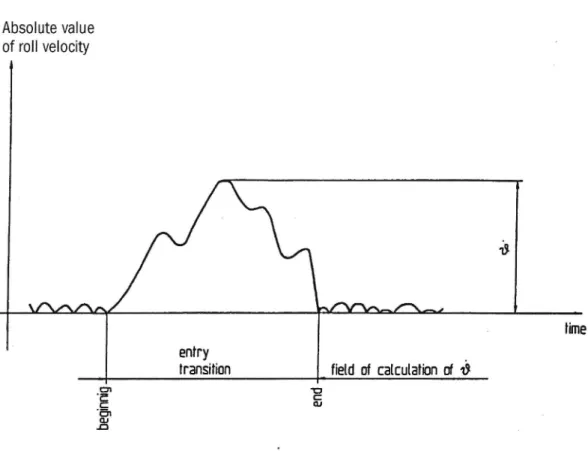
19 = maximum absolute value of roll velocity of vehicle body, in the time interval between the beginning and the end of the transition, expressed in degrees per second
(the signals are filtered with a low-pass filter with a 3 dB cut-off frequency of 2 Hz and a gradient of 3 dB/octave, and are averaged during l second)
Absolute value of Iateral acceleration 1S lime 1_s enlry transition 1.68
field of calculation ol Y
field of calculation of '9'Figure 6.1
Definitions of and
in the Performulas.
(Source: CEN 1995. Modified by the author.)Absolute value of roll velocity l AA] ' time entry .
transition field of calculation of 13
.'31 'U
.E
015
B
Figure 6.2 Definition of in the Performulas.
(Source: CEN 1995. Modified by the author.)
CEN TC 256 WG 7 suggested the same formulas with the addition that they should be applied on transitions with a duration of at least 2 seconds. CEN TC 256 WG 7 did not explain the origin of this 2-second rule, neither did they state how shorter transitions should be evaluated.
No limits were suggested.
The PCT functions takes into account three interesting variables (lateral acceleration,
lateral jerk, and roll velocity) which are dependent on the curve radius, transition length and gradient of the superelevation ramp (as well as on vehicle speed and roll
coefficient). Therefore, the PCT functions will be very useful when evaluating different
alignment alternatives, at least when the transition curves are of the clothoid type. 6.3 Comfort on discrete events
CEN TC 256 WG 7 stated that evaluation of comfort on discrete events PDE is
non-mandatory.
The PDE functions show the percentage of passengers who regard comfort as very uncomfortable or uncomfortable on large misalignments (see also Section 6.2). British Rail derived the following functions for standing and seated passengers respectively:
PD, = 1.63- y, + 2.65. ym - 37.0
[6.3]
PD, = 0.83- y, + 1.28- _ 21.7
[6.4]
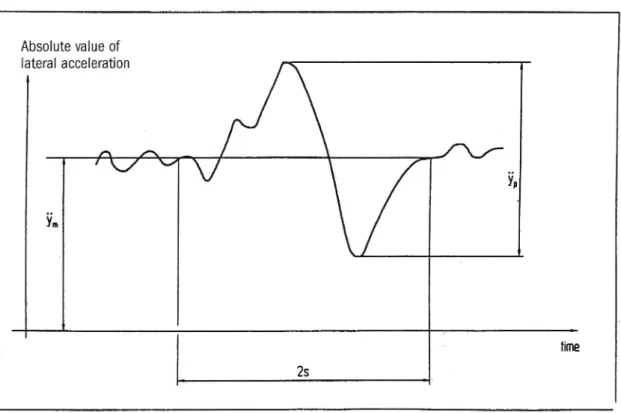
where F = maximum peak to peak value of lateral acceleration, and ym = absolute mean value of lateral acceleration,
expressed in per cent of g (the acceleration is filtered with a low-pass filter with a 3 dB cut-off frequency of 2 Hz and a gradient of 3 dB/octave, and ym and I) are evaluted within a 2-second rectangular window)
Absolute value of lateral acceleration l
Si...
lime 25Figure 6.3 Definitions of p and ym in the PDEformulas. (Source: CEN 1995. M0dified by the author.)
lt may be reasonable to assume that negative values of PDE should be neglected. It should be noted that transition curves were not included in the analysis, so it seems
reasonable to expect the PDE functions to be valid only on straight lines and circular curves. However, CEN TC 256 WG 7 stated that the PDE evaluation can be used in all
types of alignments, with the aim of easier application. No limits were suggested.
It should be noted that patterns of acceleration may be very complex and may differ in many ways. The use of the variables p and 53,, is a simplification that disregards many aspects of the lateral ride and in a 2-second long transition with a theoretically linear
increase of the lateral acceleration, the calculated PDE values may be higher than the PCT
values (Kufver 1997b). With this in mind, it is recommended not to use the PDE
functions outside the original area of application (straight lines and circular curves).
Therefore, the PDE functions are less relevant than the PCT functions when evaluating
alignment alternatives.
6.4 Peak acceleration
According to CEN TC 256 WG 10, accelerations should be measured on the floor above
the running gear on wagons, abovethe running gear and in the centre of the vehicle body on coaches and multiple units and in the driveras cab on traction units.
CEN TC 256 WG 10 and UIC 518 OR stated that the acceleration should be filtered with a band-pass filter with 3 dB cut-off frequencies of 0.4 and 10 Hz and gradients of at least 12 dB/octave. Vertical and lateral accelerations should be analysed separately. The absolute values of the 0.15 and 99.85-percentiles of the filtered signal should be used in the regression analysis. CEN TC 256 WG 10 stated that an upper level for a confidence interval should be calculated with a confidence coefficient of 95%. In the case of a one-dimensional regression analysis, this confidence interval may be simplified as medium value plus 22 standard deviations. UIC 518 OR mentioned only the calculation of medium value plus 2.2 standard deviations.
A provisional limit of 2.5 m/s2 for traction units, multiple units and passenger coaches was suggested.
Since this variable does not regard accelerations with frequencies below 0.4 Hz, it will probably not contain any interesting differences in the comparison between different alignment alternatives.
6.5 R.m.s. acceleration
CEN TC 256 WG 10 and UIC 518 OR stated that the same filtering should be performed for calculation of the r.m.s. acceleration as for peak acceleration (see Section 6.4). Vertical and lateral accelerations should be analysed separately.
CEN TC 256 WG 10 stated that an upper level for a confidence interval should be calculated with a confidence coefficient of 95%. In the case of a one-dimensional regression analysis, this confidence interval may be simplified as medium value plus 22 standard deviations. UIC 518 OR mentioned only the calculation of medium value plus 2.2 standard deviations.
CEN TC 256 WG 10 and UIC 518 OR suggested a provisional limit of 0.5 m/s2 for traction units, multiple units and passenger coaches, and a provisional limit of 1.3 m/s2 for freight wagons.
According to CEN TC 256 WG 10, the r.m.s. acceleration does not have to be
considered if running conditions are assessed according to the provisions of CEN
TC 256 WG 7 (see Sections 6.1 - 6.3).
Since this r.m.s acceleration does not pay attention to the frequency components below 0.4 Hz, it will probably not contain any interesting differences in the comparison between different alignment alternatives.
6.6
Quasi-static (or low frequency) lateral acceleration
UIC 518 OR stated that this variable should be evaluated on curves excluding the transitions. CEN TC 256 WG 10 stated that the variable may be used as an independent variable in the regression analysis.
According to CEN TC 256 WG 10, the acceleration should be filtered with a low-pass filter with a 3 dB off frequency of 4 Hz, while UIC 518 OR stated that the 3 dB cut-off frequency should be at least 20 Hz. The median value of the filtered signal should be used in the regression analysis. According to UIC 518 OR, the medium value of the medians from different test sections should be calculated.
No limit was suggested.
The Swedish State Railways (SJ) usually evaluate a low frequency lateral acceleration, but the SJ procedure differs from the UIC procedure.
The acceleration is filtered with a low-pass filter with a 3 dB cut-off frequency of 0.5 Hz and a gradient of 12 dB/octave. In the specification for tilting trains, the following limits were applied: The low frequency acceleration should always be lower than 1.0 m/s2 in tilting coaches (1.2 m/s2 in a tilting driving trailer in pushing service) and lower than 2.0 m/s2 in the power car.
The use of median values is regarded as relevant only when elements with constant curvature are being evaluated. The lateral acceleration according to the SJ procedure might be relevant to monitor, but ought to be processed by statistical methods. Firstly, in order to reduce the influence of anomalies, the 0.15 and 99.85-percentiles ought to be used instead of (minimum and) maximum values. Secondly, the upper level for a confidence interval should be calculated as medium value plus 22 standard deviations. Whether the limits should be used is questionable, since a low frequency lateral
acceleration is a component in the PCT function.
6.7
Low frequency lateral jerk
The Swedish State Railways (SJ) usually evaluate a low frequency lateral jerk. This jerk is calculated as the time-derivative of the lateral accleration. The jerk is filtered with a 3 dB cut-off frequency of 0.3 Hz and a gradient of 12 dB/octave.
In the specification for tilting trains, the following limits were applied: The low frequency jerk should always be lower than 0.5 m/s3 in tilting coaches (0.7 m/s3 in a tilting driving trailer in pushing service) and lower than 0.8 m/s3 in the power car.
This jerk function might be relevant to monitor, but ought to be processed by the same statistical methods as proposed for the low frequency acceleration (see Section 6.6).
Also a low frequency lateral jerk is included in the PCT function and hence the limits for the jerk alone could be questioned.
6.8 Motion sickness
Even though motion sickness is a rare phenomenon in railway traffic, it has been reported from Great Britain, Italy and Japan that tilting trains sometimes cause motion
sickness (ORE 1985). The motion sickness is probably not correlated to a single curve
but is rather an accumulated effect from several curves. According to ORE, JNR believed the problems to be associated with short transition curves. Problems with motion sickness in tilting trains have also been reported from Sweden (Förstberg & Ledin 1996).
The cause of motion sickness is not fully understood (Lawther and Griffin 1987).
Lawther and Griffin (1986, 1987), the British Standards Institution 6841 (1987), and a recent draft of ISO 2631-1 (1994) suggested the use of a motion dose value, MSDVZ,
which is the root of the time integrated, squared, filtered vertical acceleration. This motion dose is primary applicable to motion in ships. BS 6841 (1987) strongly recommended that motions in all axes should be measured and fully reported, even though no guidance was given for the evaluation of motions in the horizontal directions. ISO 2631-1 (1994) implicitly suggested the same, since they recommended the directions of motions to be reported.
Ueno et al (1986) pointed out that tilting trains have higher lateral accelerations in the frequency range O.5-l.0 Hz and suggested that this is the cause of motion sickness. Koyanagi (1985) suggested the time lag between entering transition curve and tilting action to be a cause of discomfort and physical fatigue. After comfort tests with different types of controlled tilting, he also suggested the limits 5 degrees/s for roll velocity and 15 degrees/s2 for roll acceleration (both quantities measured from the horizontal plane). These limits have beenslightly changed to 0.1 rad/s for roll velocity and 0.3 rad/s2 for roll acceleration, and since then the problems with motion sickness
have decreased, but are not totally eliminated (Ohno 1996).
In the absence of a generally accepted model for motion sickness, no guidance can be suggested in this document.
7.
Conditions during test and simulation
Some conditions during the tests need to be mentioned. According to CEN TC 256 WG 10, the wheel profiles of the vehicle should correspond as closely as possible to the theoretical wheel profile. The test tracks should correspond to the planned area of
operation in regard to track superstructure, rail inclination, maintenance status etc. The
on-track tests should mainly be carried out on dry rails. UIC 518 OR stated that vehicle tests should be conducted both with theoretical wheel profiles and wheel profiles naturally worn through service.
At a wheelset lateral displacement of +/- 3 mm, the equivalent conicity should be at least 0.1 and at a maximum 0.4 (or 0.3 if the test speed is above 200 km/h) (CEN TC 256 WG 10 and UIC 518 OR).
When studying the track/vehicle interaction by simulation, a friction coefficient must be specified in the input. It has been concluded that in this project, concerning optimisation of the alignment, a relatively unfavourable value of friction should be used. If the track/vehicle interaction is sufficient under unfavourable conditions, it will also be
sufficient under more favourable conditions. With this in mind, a friction coefficient of
0.4 is regarded as suitable for the analysis. A friction coefficient of 0.4 was also suggested by ORE B 176 (198%, 1989c) for the evaluation of different bogies and is the minimum value used in safety assessment tests in the USA (AAR 1993).
According to CEN TC 256 WG 10 and UIC 518 OR, the tracks for the testing of a vehicle should be chosen to reflect the condition of the tracks in the planned area of
operation. Furthermore, CEN TC 256 WG 10 stated that rail inclinations of 1:20, 1:30,
and 1:40 should be included if they exist in the planned area of operation, while UIC 518 OR stated that vehicles intended for international traffic should be tested on rail inclinations of both 1:20 and 1:40.
For evaluation of alignment alternatives within Sweden, it will be sufficient to use the Swedish rail inclination of 1:30.
In the evaluation of alignments, lateral and vertical stiffness and damping between track and ground should correspond to the values of CWR tracks with concrete sleepers. From measurements, it has been found that these values vary with preload and frequency, and that there is also a great variation in the values between different locations, caused by
different substructures and/or different rail pads (Andersson 1997, Davidsson 1990,
Köhler 1996). When the substructure is frozen, the track is considerably stiffer.
According to ORE B176 (1989a) vertical stiffness for new UIC60 track with 1600
sleepers per kilometre is 75 MN/m (per wheel) and lateral stiffness is in the range 24 -40 MN/m (as a sum of the two rails). In the evaluation of different bogies, vertical
stiffness should be 75 MN/m (per rail) with and lateral stiffness should be 20 MN/m
(per rail) (ORE 1989b, 1989c).
The following values have been chosen as reasonable for representing Swedish tracks with concrete sleepers, and are often used in simulations in Sweden (Andersson 1997):
Vertical stiffness 150 MN/In and vertical damping 300 st/rn. Lateral stiffness 20 MN/m and lateral damping 50 st/rn.
8.
Final discussion and conclusions
The aim of this document is to define variables which could be used for evaluation of vehicle reactions caused by the alignment (consisting of combinations of track elements such as circular curves and different kinds of transition curves). According to the discussions in Chapter 6, low frequency components of acceleration should not be neglected and, according to the discussion in Chapter 2, median values are not always useful, since it is not clear what they represent.
In order to avoid anomalies in the variables studied, it is recommended that the
0.15-and 99.85-percentiles be used. Since this means that the worst sections are systematically disregarded, it is recommended that the same evaluation length be used, when comparing different alignment alternatives. UIC 518 OR stated that on curves, the centiles should be calculated from a total of measured data from all external wheels. If the load on some wheels is significantly lower than on other wheels, this might lead to an exclusion of more than 015% of the values of the most relevant wheels. It therefore seems better to analyse the different wheels (or axles in the analysis of the track shift forces) separately.
In the procedures suggested by CEN TC 256 WG 10 and UIC 518 OR, test sections with different levels of track irregularities and where the train passes at different speed, will be analysed with linear regression. However, the evaluation of alignments will be made by means of simulation (rather than full scale testing), so the regression analysis with intervals for speed (or cant deficiency) is superfluous. It is recommended that the vehicle reactions at the chosen target speed be simulated directly.
It also seems better to analyse the vehicle reactions for different track qualities separately. This means that the confidence intervals for the studied variables will be smaller, compared with statistical analysis where different track qualities are mixed. When using data files containing track irregularities, the superimposing of these on the theoretical alignment should be done with some alterations of the phase shifts in order to avoid insignificant interferences between the alignment and the irregularities.
When analysing different alignment alternatives, it will be sufficient to use the rail inclination used in the area in question. In Sweden, the rail inclination is 1:30. Also track stiffness and damping should correspond to values in the area in question. For CWR tracks with concrete sleepers, the following values (for each rail) may be used:
Vertical stiffness 150 MN/m Vertical damping 300 st/m Lateral stiffness 20 MN/m Lateral damping 50 st/m
The vehicle reactions should be studied for conditions representing dry rails. The friction coefficient is recommended to be set to 0.4.
The following variables are regarded as relevant when evaluating different alignments:
Maximum vertical wheel forces,
maximum guiding forces,
track shift forces,
climbing ratios,
wear index,
comfort on curve transitions (PCT),
low frequency lateral accelerations, and low frequency lateral jerks.
Quasi-static vertical wheel forces and quasi-static guiding forces may only be relevant where curvature and cant are constant.
The following variables have defined limits which may be used:
Quasi-static vertical wheel forces, maximum vertical wheel forces,
quasi-static guiding forces,
maximum guiding forces, track shift forces,
climbing ratios,
low frequency lateral accelerations, and low frequency lateral jerks.
Some of these limits apply to rails of 46 kg/m, while the heavier UICÖO-rails should be able to accept higher limits. However, since it is not clear how far these limits may be raised, the conservative limits for rails of 46 kg/m are recommended. The low frequency lateral accelerations and the low frequency lateral jerks have defined limits which may
be questioned, since the accelerations and jerks are included in the PCT functions. The wear index and the PCT functions have no predefined limits.
It seems reasonable to choose the PCT function as an overall comfort function, at least
when the transition curves are of the clothoid type. In order to ensure good comfort for all passengers it seems reasonable to choose the PCT function for standing passengers. If the ride is acceptable for them, it will also be acceptable for the seated passengers.
When ride comfort is to be maximised, the PCT functions may be used as object
functions.
The variables with defined limits may be used as boundary conditions in the analysis. However, a situation may appear where a higher (than permitted) low frequency acceleration or a higher (than permitted) low frequency jerk leads to a lower PCT value. This may lead to a revision of the limits.
It seems relevant to supervise the wear index, but there is no generally accepted limit. For tracks with no passenger trains, the wear index or an index derived from vertical wheel forces, guiding forces and/or track shift forces may be more suitable as object function.
References
AAR. (1993). Manual of standards and recommended practices M-]001, Chapter XI, Service-worthiness tests for newfreight cars. Association of American Railroads,
Washington, DC.
Andersson, B. (1997). Private communication.
Andersson, E., von Bahr, H. & Nilstam, N.G. (1995). Allowing higher speeds on existing tracks - design considerations of the XZOOO train for Swedish State Railways. Proceedings of the Institution of Mechanical Engineers. ImechE (Vol 209), 93-104.
Baluch, H. (1983). Increasing the length of the transition curves by a reduction of the
main curve radius. Rail International (Vol 14 No 1) 10-15.
British Standards Institution. (1987). British standard guide to measurement and
evaluation of human exposure to whole-body mechanical Vibration and repeated
shock. BS 6841:1987. London: British Standards Institution.
CEN. (1995). Railway applications - Ride comfort for passengers - Measurement and evaluation. CEN TC 256 WG 7 (Final Committee Draft for official CEN-enquiry). Brussels: CEN.
CEN. (1996). Railway applications - Testing for acceptance of running characterstics of railway vehicles - Part 1: Testing of running behaviour. CEN TC 256 WG 10
(Final working draft). Brussels: CEN.
Chapell, T.A. (1984). Passenger comfort tests of June 1983- planning and conduct. BRR TR DOS 16. Derby: British Rail Research.
Davidsson, H. (1990). Ramsjö - Norrhög, Mätning av dynamisk styvhet och dämpning. (Ramsjö - Norrhög, Measurements of dynamic stiffness and damping). Banverket Internal Report IR-90-O4. Tomteboda: Banverket.
Förstberg, J. & Ledin, T. (1996). Discomfort caused by low-frequency motions - A literature survey of hypotheses and possible causes of motion sickness. TRITA-FKT Report 1996:39. Stockholm: KTH.
Hashimoto, S. (1989). Analysis of relationship between transition curve profile and
railway vehicle Vibration. Qaarterly report of RTRI (Vol 30 No 4) 207-214.
International Organization for Standardization. (1994). Mechanical Vibration and shock
- Evaluation of human exposure to whole-body Vibration. Part 1: General requirements. Draft International Standard ISO/D15 2631-]. Geneva: ISO.
Köhler, J. (1996). Gåsakulla 1995 - Spår- och slipersstyvheter - Kvasistatisk excitering.
(Gåsakulla tests 1995 - Track stiffness and Sleeper stiffness - Quasistatic
excitation) Banverket Report TE 96/16. Borlänge: Banverket.
Koyanagi, S. (1985). Ride quality evaluation of a pendulum car. QR of RTRI, (Vol 26
No 3) 89-92.
Kufver, B. (l997a). Mathematical description of railway alignments and some preliminary studies. TRITA-FKT Report 1997:30. Stockholm: KTH/VTI Report 420-97. Linköping: VTI.
Kufver, B. (l997b). Methods for evaluation of ride comfort as a function of vehicle reactions caused by railway alignment. TRITA-FKT Report 1997:31. Stockholm: KTH/VT] Report 421-97. Linköping: VTI.
Lawther, A. & Griffin, MJ. (1986). The motion of a ship at sea and the consequent
motion sickness amongst passengers. Ergonomics (Vol 29 No 4) 535-552.
Lawther, A. & Griffin, MJ. (1987). Prediction of the incidence of motion sickness from
the magnitude, frequency, and duration of vertical oscillation. J. Acoust. Soc. Am. (Vol 82 No 3) 957-966.
Ohno, H. (1996). What aspect is needed for a better understanding of tilt sickness? QR ofRTR] (Vol 37 No 1) 9-13.
ORE. (1985). Body tilt coaches - Operational experience with body tilt coaches (BT). ORE S]03 7 Rp] . Utrecht: ERRI.
ORE. (1989a). Bogies with steered or steering wheelsets. Preliminary studies and specifications. ORE B] 76 Rp] Vol ] . Utrecht: ERRI.
ORE. (l989b). Bogies with steered or steering wheelsets. Specifications and preliminary studies. Specifications for a bogie with improved curving Characteristics. ORE B] 76 Rp] Vol 2. Utrecht: ERRI.
ORE. (l989c). Bogies with steered or steering wheelsets. Specifications and preliminary studies. Specifications for a bogie with improved curving Characteristics designed for body tilt. ORE B] 76 Rp] Vol 3. Utrecht: ERRI.
ORE. (1990). Improved curve negotiation (Final Report for Phase 1). ORE C] 72 Rp]. Utrecht: ERRI.
Pfarrer, H. (1990). Ausbau- und Neubaustrecken für grosse Belastung unter besonderer Berücksichtigung der Unterhalturzg. Dokumentation der internationalen Tagung 1990 des Arbeitsausschusses Eisenbahntechnik der Österreichischen
Verkehrswissenschaftlichen Gesellschaft in Wien. ÖVG Spezial (Band 30)
177-202.
UIC. (1997). Test and approval of railway vehicles from the points of view of dynamic behaviour, safety, track fatigue and ride quality. UIC 5] 8 OR (Draft of January
1997). Paris: UIC.
Ueno, M., et al. (1986). Studies on motion sickness caused by high curve speed railway vehicles - evaluation of the swing and its effects on passengers and conductors. Jpn J Ino' Health (Vol 28) 266-274.
Appendix 1
Variables and limit values for evaluation of railway alignments
Quasi-static vertical wheel forces
Low-pass filtering with a 3 dB cut-off frequency in the interval 2051330 Hz (gradient224 dB/octave).
All wheels treated separately.
Median values (taken from elements with constant curvature). Medium value.
Limit 145 kN (provisional value).
Maximum vertical wheel forces, alternative 1
Low-pass filtering with a 3 dB cut-off frequency in the interval 20_<f_<_30 Hz
(gradient_>_24 dB/octave).
All wheels treated separately. 99.85-percentiles
Upper level of confidence interval as medium value plus 2.2 standard deviations. Limit 170 kN (provisional value).
Maximum vertical wheel forces, alternative 2
Low-pass filtering with a 3 dB cut-off frequency of 90 Hz (gradient224 dB/octave). All wheels treated separately.
99.85 -percentiles
Upper level of confidence interval as medium value plus 2.2 standard deviations.
Limit 170 kN (provisional value).
Quasi-static guiding forces
Low-pass filtering With a 3 dB cut-off frequency in the interval 205f_<_30 Hz (gradient224 dB/octave).
All wheels treated separately.
Median values (taken from elements with constant curvature).
Medium value.
Limit 60 kN (provisional value).
Maximum guiding forces
Low-pass filtering with a 3 dB cut-off frequency of 90 Hz (gradient224 dB/octave). All wheels treated separately.
99.85-percentiles (or 0.15-percentiles according to the direction of the curve).
Upper level of confidence interval as medium value plus 2.2 standard deviations.
Limit 45 kN (or 55 kN if curve radius is less than or equal to 300 metres) (provisional values).
Track shift forces
Low-pass filtering with a 3 dB cut-off frequency in the interval 20§f_<_30 Hz
(gradient224 dB/octave).
All axles treated separately.
Averaging in a sliding 2-metre rectangular window.
99.85-percentiles (or 0.15-percentiles according to the direction of the curve). Upper level of confidence interval as medium value plus 3 standard deviations.
Limit 0.85-(10+2°Q0/3) kN for freight wagons, and 1.00 (10+2'Q0/3) kN for other vehicles.
Climbing ratios
Low-pass filtering with a 3 dB cut-off frequency in the interval 2057330 Hz
(gradient224 dB/octave).
All wheels treated separately.
Averaging in a sliding Z-metre rectangular wind0w.
99.85-percentiles (or 0.15-percentiles according to the direction of the curve). Upper level of confidence interval as medium value plus 3 standard deviations.
Limit 0.8.
Wear index
The wear index is calculated for each rail as the sum of the wear indices for the right hand wheels and the left hand wheels respectively.
Averaging in a sliding 2-metre rectangular window. 99.85-percentiles.
Medium value.
NO limit.
Passenger comfort on curve transitions
Low-pass filtering (of acceleration and roll velocity) with a 3 dB cut-off frequency of
2 Hz (gradient 3 dB/octave).
Lateral accelerations and lateral jerks for each end of the coach treated separately. The lateral acceleration should be averaged in a sliding l-second rectangular window. The window should slide from the the start of the transition curve to 1.6 seconds after
the end of the transition curve. The maximum absolute value is used in the formulas below.
The lateral jerk should be calculated as the change in acceleration during l second. The l-second window should slide from 1 second before the start of the transition to the end
of the transition. The maximum absolute value is used in the formulas below.
The roll velocity used in the formulas should be the maximum absolute value in the
transition curve (from the start to the end).
Standing passengers;
PCT = max(2.80 - y + 2.03 - y - 1 1.1, 0) + 0.185- (2592283
[A1. 1]
Seated passengers;
PCT .-.-. max(0.88 . y + 0.95 - _'y" - 5.9, 0) + 0.120 . (MM)
[A1 .21
The units for maximum lateral acceleration maximum lateral jerk and maximum roll velocity are per cent of g (9.81 m/sz), per cent of g per second and degrees per second respectively.No limits.
Low frequency lateral accelerations
Low-pass filtering with a 3 dB cut-off frequency of 0.5 Hz (gradient = 12 dB/octave). Accelerations for each end of the coach treated separately.
99.85-percentiles (or 0.15-percentiles according to the direction of the curve). Upper level of confidence interval as medium value plus 2.2 standard deviations.
Provisional limits 1.0 m/s2 in tilting coaches, 1.2 m/s2 in tilting driving trailers in pushing service and 2.0 m/s2 in power cars. These provisional limits may be changed
since low frequency lateral acceleration is included in the PCT calculations.
Low frequency lateral jerks
' Low-pass filtering with a 3 dB cut-off frequency of 0.3 Hz (gradient = 12 dB/octave). Jerk for each end of the coach treated separately.
99.85-percentiles (or 0.15-percentiles according to the direction of the curve). Upper level of confidence interval as medium value plus 2.2 standard deviations.
Provisional limits 0.5 m/s3 in tilting coaches, 0.7 m/s3 in tilting driving trailers in
pushing service and 0.8 m/s3 in power cars. These provisional limits may be changed since low frequency lateral jerk is included in the PCT calculations.
Test speed
The lowest value of 110% of permissible speed and the speed corresponding to 110% of permissible cant deficiency when evaluating forces and climbing ratios. Otherwise, the lowest value of 100% of permissible speed and the speed corresponding to 100% of permissible cant deficiency.
Other conditions Rail UIC60. Gauge 1435 mm. Friction coefficient 0.4.
Rail inclination 1:30.
Vertical stiffness 150 MN/m (per rail).
Vertical damping 300 st/m (per rail).
Lateral stiffness 20 MN/m (per rail).
Lateral damping 50 st/m (per rail). Wheel profile S 1002.
Appendix 2
Terminology and definitions
Alignment ATP Cant Cant deficiency Climbing ratio Compound curve Curvature CWR track Element
Equilibrium cant
Gauge Guiding force JerkThe alignment is a mathematical description of the designed position of the centre line of the track. An alignment consists of elements which are connected at tangent points. An alignment can be divided into a horizontal alignment and a vertical alignment.
Automatic Train Protection, a signalling system which automatically brakes the train if the train speed exceeds the permissible speed by too great a margin.
The difference between the heights of the right and left rails, at the same longitudinal position, is called cant and/or superelevation. The cant is positive if the outer rail is higher than the inner rail.
When the cant is lower than equilibrium cant, the difference is
called cant deficiency.
Guiding force Y divided by the vertical wheel/rail force Q. A chain of elements consisting of at least two circular curves in the same direction, without any intermediate straight line.
The horizontal curvature is the derivative (with respect to longitudinal distance) of the direction of the track. On a straight
line, the curvature is zero and on a horizontal circular curve, the absolute value of curvature is the inverse of the radius. On a vertical curve, the vertical curvature is the derivative of
arcus tangens of the slope.
Track with continuouslywelded rails.
An element is a section of the track with specific mathematical characteristics. An element may be a straight line, a circular
curve or a transition curve.
The equilibrium cant is the amount of cant which eliminates the stationary lateral acceleration (in the track plane).
The lateral distance between the inner edges of the two rails is called gauge. Standard gauge is 1435 mm.
See Y-force.
Time derivative of acceleration.
Lateral direction Misalignment Octave band Permissible speed Q-force
Q0
Quasi-static R.s.s. Roll angle S-force SuperelevationThe lateral direction corresponds to the y-direction. See x, y and z-directions.
A misalignment is a track irregularity in the horizontal alignment.
A frequency interval where the upper limit is twice the lower
flow S f < fhigh : 2 . flow '
When evaluating vehicles: The (planned or real) maximum speed which the vehicle in question may have in revenue service. In UIC 518 OR, the corresponding term is vehicle Operating speed limit , while in CEN TC 256 WG lO the term is
permissible maximum speed of the vehicle .
When evaluating alignments: The (planned or real) maximum
permissible speed in the curve combination in question.
The vertical wheel/rail force, Q, is positive if the force acting on the wheel is directed upwards.
Half the static axle load.
The quasi-static level of a signal corresponds to the average level during stationary conditions (such as running at constant speed on a curve with constant radius and cant). However, CEN TC256WG10 and UIC 518 OR quantified this level by taking the median value of the signal.
Root-mean-square, an average quantity calculated from a time
JT2a2(t)dz.
T1
histor of a si nal, a ,=Y ?5 rms \/7; _ Tl
Root-sum-of-squares, a summation procedure for accelerations in different directions. If the accelerations are of the same type (translational or rotational) and if the directions are orthogonal, the r.s.s. procedure is equivalent to vector summation,
am = Jaf + af +aZ2 .
Roll angle (p defines rotation around x axis.
The track shift force, S, is the sum of the two Y-forces acting on
the same wheelset. The force is positive if the force acting on the wheelset is directed to the right. (According to older definitions of the Y-forces, where these forces are positive in the direction inwards to the track centre line, the S-force may be defined as
the difference between the two Y-forces.)
See cant.
Superelevation ramp Tangent point Target speed Test speed Track irregularity Track plane
Track shift force
Transition curve
x, y and z-directions
Y-force
A superelevation ramp is a section of the track where the cant changes gradually. (According to the standards of many railway companies, a superelevation ramp should normally coincide with
a transition curve.)
A tangent point is where two elements are connected to each other.
In this document, target speed is a term which describes the speed which Should be used in a test or a simulation. In a specific test, the actual speed (test speed) may differ from the target speed. In simulations, the test speed equals the target speed.
The actual speed of the vehicle in the test (or in the simulation). When the actual track position differs from the designed position, track irregularities exist. The mismatch between actual position and designed position could involve horizontal alignment, gauge, vertical alignment and/or cant. Track irregularities are more frequently described by deviations in the
first derivative (cant) or second derivative (alignment) of the
position, rather than by deviations in the position itself.
The track plane is a function of longitudinal distance. The instantaneous direction of the track centre line defines the x-axis
within the track plane, while the y-direction within the track
plane is a tangent to the designed positions of the top surfaces of the two rails.
See S-force.
A transition curve is a type of element where the curvature changes gradually.
When evaluating passenger COmfort, the directions refer to the vehicle body; the x and y-directions are longitudinal and lateral directions parallel to the floor, while the z-direction is perpendicular to the floor.
When evaluating wheel forces, the directions refer to the track plane (which may be superelevated); the x and y-directions are longitudinal and lateral directions parallel to the track plane, while the z-direction is perpendicular to the track plane.
The guiding force, Y, is the lateral force between the wheel and
the rail. The force is positive if the force acting on the wheel is directed to the right. (According to older definitions, the force may be positive if the force on the wheel is directed inwards to
the track centre line.)
Appendix 3
Notations
f Frequency (Hz)
i Accumulated relative frequency (-)
g Gravitational acceleration (m/sz)
I Cant deficiency (mm)
Iadm Permissible cant deficiency (mm)
[<4 Factor used in expression for limit for S-force (-)
NMV Comfort function (-)
NVA Comfort function (-)
' NVD Comfort function (-)
PCT Comfort in curve transitions (%)
PDE Comfort on discrete events (%)
Q-force Vertical wheel force (N)
Q0 Half static vertical axle load (N)
Qlim
Limit for Q-force (N)
R Radius in circular curves (m)
S-force Track shift force (N)
t Time (s)
T Time (s)
V Speed (km/h)
Vlim Vehicle Operating speed limit (km/h)
j) Maximum absolute value of lateral acceleration (% of g) im Absolute mean value of lateral acceleration (% of g)
33,, Maximum peak to peak value of lateral acceleration (% of g)
Maximim absolute value of lateral jerk (% of g per second)
Y-force Lateral wheel force (N)29 Maximum absolute value of roll velocity (degrees per second)