Index price volatility
during ban periods:
The case of KOSPI200
BACHELOR
THESIS WITHIN: Economics NUMBER OF CREDITS: 15 ECTS PROGRAMME OF STUDY:
International Economics
AUTHOR: Jesper Ervell and Gabriel Flores
JÖNKÖPING May 2021
A quantitative study on the effectiveness of short-selling
bans on index price volatility in the South Korean stock
market
i
Bachelor Thesis in Economics
Title: Index price volatility during ban periods: The case of KOSPI200 Authors: J. Ervell and G. Flores
Tutor: Andrea Schneider Date: 2021-05-23
Key terms: stock market volatility, short-selling, South Korea, KOSPI200, financial crisis, Covid-19 crisis
Abstract
Short-selling allows investors to profit from asset declines. In the events of market uncertainty, short sellers are frequently accused of abusing the increasingly volatile market by betting on declining stock prices. To prevent further market downturns and calm the volatile markets, regulators around the world have put constraints on the ability to sell short. During the financial crisis (2008) and Covid-19 crisis (2020), the restriction became a popular method amongst economies to stabilise volatile stock markets, with South Korea holding the most extensive ban during both crises. Although commonly used, the policy has been questioned for its effectiveness. This thesis studies the effectiveness of the ban by observing the correlation between the existence of ban and price volatility of South Korea’s biggest index, KOSPI200. We use an ordinary least squares (OLS) method and apply these in a two-stage analysis to disentangle the effects of crisis and ban. By doing this, enabling to isolate the effect of the ban. We find evidence contradicting regulators incentive to ban short selling as the effect of the ban is not strong enough to compensate for the effect of the crisis.
ii
Table of Contents
1
Introduction ... 1
2
Literature Review ... 3
3
Institutional Background ... 7
3.1 Financial Crisis 2008 ... 7 3.2 Covid-19 Crisis 2020 ... 8 3.3 Macroeconomic Shocks ... 104
Theoretical Framework ... 12
4.1 Short-selling and Short-selling Bans ... 12
4.2 Expected Effect of Short-selling Bans on Volatility ... 14
5
Data ... 17
5.1 Data ... 17
5.1.1 Dependent Variable: Index Price Volatility ... 18
5.1.2 Bans ... 18
5.1.3 Control Variables ... 18
5.2 Expected Result ... 21
5.3 Descriptive Statistics ... 22
6
Empirical Analysis ... 24
6.1 Full Sample Estimation ... 24
6.2 Event-Window Estimation ... 27
7
Discussion of Results ... 31
8
Conclusion ... 34
iii
Figures
Figure 1: Timeline of events ... 9
Figure 2: Volatility KOSPI200 (2007-2021) ... 23
Tables
Table 1: Key events ... 9Table 2: Variables used in model and expected signs of correlation ... 21
Table 3: Descriptive statistics ... 22
Table 4: Correlation analysis ... 23
Table 5: Regression results: Entire timeline included ... 27
1
1 Introduction
Short-selling refers to an investment strategy aimed to profit from future decline in stock prices by selling a borrowed stock with the intention to repurchase the stock in the future at a lower price, realising a profit. Economic crises cause increased stock market volatility. To correct for this, policymakers tend to introduce short-selling bans to calm the volatile market and protect market prices. Thus, two counteracting effects. However, the effectiveness of the policy is questionable, even if a ban is successful, there might be increased volatility due to the first effect. The effectiveness has been studied in the literature for previous periods of financial instability (Alves et al. 2016; Boulton & Braga-Alves, 2010; Frino et al. 2011; Helmes et al. 2017). The aim of this thesis is to provide additional empirical findings to the existing literature on the efficiency of short-selling bans. Examining two of the most severe global economic crises in recent years, we are able to analyse the consistency of the effect of the market intervention. Thus, determining whether the implementation of the ban shows desired results, i.e. decreased market volatility for both crises.
During the financial crisis (2008) and the Covid-19 crisis (2020), significant market declines triggered some regulators to ban short-selling as an investment strategy. During both crises, several economies responded by implementing the policy on either an entire stock market index or a restricted number of stocks, often in the financial sector, and for a shorter time, e.g. Belgium, France, Indonesia, Italy, Malaysia, Spain (Nunn & Kulam, 2021). However, South Korea has had a more extensive, and longer shortening ban than any other economy by placing constraints on their largest market index for over a year during both crises (Kim et al., 2021). Since South Korea maintains the most restricted short-selling ban, it becomes significantly interesting to observe whether or not it has resulted in the desirable outcome.
The purpose of this study is to examine if short-selling bans are able to reduce index price volatility during economic turmoil. Adding to the current literature, we are able to test the effects of the ban policy on index price volatility of KOSPI200, using an
ordinary least squares (OLS) method for both the financial crisis, and the ongoing Covid-19 crisis. Although the ban was active in the KOSPI and KOSDAQ markets in
2
both crises (Boesler, 2013; Financial Services Commission [FSC], 2020), this research will solely focus on KOSPI200 as it is a representative, value-weighted average spot price index, incorporating the stock prices of the 200 largest publicly traded companies on the Korean exchange. Thus, constituting a majority of all trading activity on the South Korean stock market (Bloomberg, 2021).
Analysing the volatility during ban periods provides the overall effect of crisis and ban. We run a full sample estimation over the period of 3456 trading days, starting the 20th of
February 2007, ending 17th of February 2021. To disentangle the effects of crisis and ban,
in a second step, we do an additional window analysis by running two event-window estimations. The first event-event-window estimation represents the financial crisis, consisting of 648 trading days, starting the 7th of June 2007, ending 31st of January 2010.
The second event-window estimation represents the Covid-19 crisis, consisting of 62 trading days, starting the 30th of January 2020, ending 29th of April 2020.
The structure of this paper is as follows: Section 2 will discuss prior research on short-selling and evidence from previous financial crises. Section 3 will give a background of the two crises observed. Section 4 will present the theoretical background of this paper. In Section 5, we discuss our data. Section 6 presents our results from running full sample- and event-window estimation. Section 7 displays a discussion of the results. Finally, Section 8 summarises our findings.
3
2 Literature Review
This chapter presents previous research about the relationship between short-selling and volatility. The structure of the literature review is as follows: the first paragraphs present the earliest research on the theoretical effectiveness of short-selling bans by Miller (1977) and Diamond and Verrecchia (1987). We later provide evidence from previous literature which supports regulator’s motivations for banning short-selling as an investment strategy during economic turmoil. Finally, we analyse the empirical findings from the financial crisis in 2008 when numerous economies temporarily restricted short-selling until markets were stable.
The legitimacy of short sale restrictions is widely debated in literature. One of the earliest papers on short-selling restrictions was conducted by Miller (1977). The research explores some of the implications of a market with restricted short-selling in which investors have heterogenous expectations of the returns from investing in a risky security. Dividing the market actors into two generalised groups, the optimistic and the pessimistic, Miller (1977) states that in a free market without short-selling bans, the pessimistic investors will make their private information publicly available through their investment strategies. Contrary, in a market with restricted or prohibited short-selling, the demand for a stock will come from the minority who holds the most
optimistic expectations about it. Miller (1977) further explains that by only constraining the pessimistic short sale investors who believes that a stock is overvalued, imparts an upward bias to stock prices. Hence, causing an asymmetric price discovery where information which drives stock prices up are dominating the stock market. From
Miller’s theory, Diamond and Verrecchia (1987) model effects of short-sale constraints on the speed of adjustment to private information of stock prices. In line with Miller (1977), Diamond and Verrecchia (1987) finds that limitations eliminate informative trades. However, they find no evidence that short-selling constraints would cause an upward bias on stock prices. Collectively, these two papers imply that the presence of short sellers increases informational efficiency. Miller (1977) and Diamond and
4
Verrecchia (1987), have provided the fundamental theories of how the presence of short sellers affects the stock market.
Although limited, empirical findings on short-selling bans prior to the financial crisis (2008), seems to conclude that short-selling restrictions increases stock market volatility. To find empirical evidence for the overvaluation theory by Miller (1977), Chang et al. (2007) analyses the cumulative abnormal return around the lifting and reinstatement of short-sales restrictions on the Hong Kong stock market. Consistent with Miller (1977), they find that short-selling restrictions tend to cause the stock price to not fully incorporate negative information which results into stock overvaluation. In addition, short-selling bans increased volatility and a less positive skewness of
individual stock returns. Charoenrook and Daouk (2005) analyse the effect of short-selling restrictions by putting option trading in 111 countries. Likewise, to Chang et al. (2007), they find that when short-selling is allowed, the volatility of aggregate stock returns is lower, and liquidity is higher. Additional research by Bohl et al. (2012) finds robust evidence that short-selling restrictions raised stock returns volatility in Taiwan from the date of implementation of the ban in 1998 until it was lifted in 2005. Coherent with Miller (1977), Bohl et al. (2012) argue that short-selling restrictions are
counterproductive as the restrictions limits investors’ ability to evaluate the intrinsic value of the stock.
Boehmer et al. (2013) provides direct evidence on the informativeness of short sales using a long panel of all short sale orders submitted electronically to the New York Stock Exchange (NYSE). In line with Miller (1977), they find evidence for short sellers to be extremely well-informed traders. The gross excess on shortening indicates that investors have identified and acted on important value-relevant information that has not yet been reflected in the stock price. Since price effects are permanent, short sellers would not manipulate or temporarily depress the share price. Instead, it is argued that short-selling is an important investment strategy which contributes to a more efficient market where the share price reflects its intrinsic value (Boehmer et al., 2013). In contrast to Miller (1977) and Boehmer et al. (2013), this thesis will not provide evidence of the price discovery process, but instead focus on the impact on market volatility.
5
Regulators tend to base their incentive for banning short-selling during periods of elevated market uncertainty on the notion that it offers investors the possibility to abuse the market. A notion shared by Goldstein and Guembel (2008). Goldstein and Guembel (2008) conclude that if a stock price incorporates all information available, it is possible for speculators to abuse this by establishing a short position with the intention to benefit from the decline in stock prices. Hence, providing false information to the market by taking short positioning on a stock. Thus, to avoid market abuse and support efficient allocative role of prices, restrictions on short-selling could be advantageous. The effect on stock prices is also examined by Shkilko et al. (2012). They argue that downward price reversals are accompanied with aggressive short-selling, creating pressure on prices, causing it to decrease further, and liquidity to deteriorate.
The data availability from the financial crisis (2008) has provided significant opportunities for empirically studying the effects of short-selling bans in certain markets. Findings from Frino et al. (2011) provide support to the proponents of short-selling restrictions. Their research showed that short sale restrictions are effective in temporarily stabilising the market. When restrictions were imposed, market prices become artificially inflated which are related to positive abnormal returns for the banned stocks. A finding which is coherent with the theory of overpricing provided by Miller (1977). This has further been supported by additional papers. Observing the effects by the American short-selling restrictions in 2008, Boulton and Braga-Alves (2010) find that abnormal returns at the announcement of the short-selling restrictions are positive for the affected stocks. A significant portion of these gains are returned at the expiration.
Using the Granger causality link, Baklaci et al. (2016) finds a significant bilateral causality between short sales and volatility of price changes. Based on their findings, Baklaci et al. (2016) suggests that regulators should intervene the market and even impose stricter short-selling restrictions to stabilise the market. Ho et al. (2021)
investigates the effect of short-selling on stock volatility on the Australian stock market during normal market conditions and finds some evidence suggesting that short-selling positively affects daily realised volatility measures. Contrary to Baklaci et al. (2016)
6
and Ho et al. (2021), numerous papers find no evidence that short-sale restrictions during the financial crisis provided support for stock prices in 2008, or that they reduced volatility (Alves et al., 2016; Boehmer et al., 2013; Boulton & Braga-Alves, 2010; Helmes et al., 2017; Kim et al., 2016). In addition, Helmes et al. (2017) find no evidence for a price bump on stock which were later added to the ban list. Thus, contradicting Miller’s theory that short-selling bans would create an information bias for optimistic investors and therefore result in an overvaluation of the stock.
Summarised, although short-selling bans are high on the political agenda and frequently used by regulators to calm a volatile market, previous literature finds only little support that this market intervention is successful.
7
3 Institutional Background
The chapter presents the institutional background of the South Korean short-selling ban during the two crises observed in this research; the financial crisis (2008), and Covid-19 crisis (2020). The structure of the institutional background is as follows: first, this section presents the financial crisis (2008), followed by the Covid-19 crisis (2020). Finally, we characterise the two crises based on macroeconomic shocks, to demonstrate how they differentiate from each other.
3.1 Financial Crisis 2008
Restricting short-selling as an investment strategy has been a recurring attempt for South Korean regulators to reduce market volatility during economic turmoil. As financial stocks fell sharply in 2008, several major banks, most notably Bear Sterns, Lehman Brothers, and Morgan Stanley, blamed short sellers for their woes. In response, international financial regulators took measures against short-selling (Brunnermeier & Oehmke, 2014). Bryan Song, research analyst at Bank of America Merrill Lynch
explains how the governing body of the South Korean financial market, FSC, prohibited short-selling on October 1st, 2008 for all listed stocks to arrest a slump in equities
triggered by the global credit freeze (Boesler, 2013). They subsequently lifted the ban on non-financial stocks on 1st of June 2009, whilst the ban on financial stocks continued
to be effective. Although, ban on non-financial stocks were temporarily revived for three months in 2011 during an increased volatile period, caused by the eurozone debt crisis. The motivation for exclusively maintaining the ban on financial stocks until November 10th 2013, was that they were presumed to be significantly affected by
external economic factors (FSC, 2013). Thus, making them vulnerable to the still weak and volatile global financial market conditions (Boesler, 2013; Jung-a, 2013). For simplicity, the crisis period 2007-2013 will further on be referred as the financial crisis as the crises are interconnected.
8
There is no consensus for the exact ending date of the financial crisis, thus we will use the South Korean inflation target as a reference point. The inflation target was at the 3% midpoint of the tolerance interval of 2-4% during 2010-2012, while the target range was 2.5-3.5% during 2013-2015 (Chang et al., 2016). Whilst an undesirable level of
inflation is observed following 2013, it can still be considered as relatively stable contrary the inflation rates following the start of the financial crisis in 2008 (International monetary fund, 2020). Thus, we will treat the last day of 2012
(31/12/2012) as the end of the financial crisis. Following the increased market stability, South Korean regulators lifted the ban for all stocks November 10th, 2013. This made
Korean regulatory measures one of the most comprehensive and restrictive short sales regulations among major stock markets around the world during the financial crisis (Jung-a, 2013). Thus, the ban was active from October 1st, 2008 to November 10th,
2013. We capture this later in the empirical analysis in Section 6. The main events during the financial crisis are also summarised in Table 1.
3.2 Covid-19 Crisis 2020
Following the outbreak of the Covid-19 virus, the South Korean government made the decision to tighten regulations on short-selling for three months beginning on March 10th, 2020 in response to recent market volatility. This time on the KOSPI200 and
KOSDAQ150 indexes. The government stated that it will continue to take appropriate measures based on contingency plans (FSC, 2020). Following the extension of the Covid-19 crisis, the South Korean government have further extended the ban until May 2nd, 2021 for the country’s largest stocks (FSC, 2021). The partial resumption on
short-selling is intended to minimise the impact on markets, given these stocks have large market caps and liquidity so that the resumption of short-selling would have limited impact on stock prices (FSC, 2021). Whether the ban has been a successful strategy has been a subject of debate between proponents and opponents of short-selling restrictions. We capture the ban during the Covid-19 crisis later in the empirical analysis in Section 6. The main events during the Covid-19 crisis are also summarised in Table 1.
9
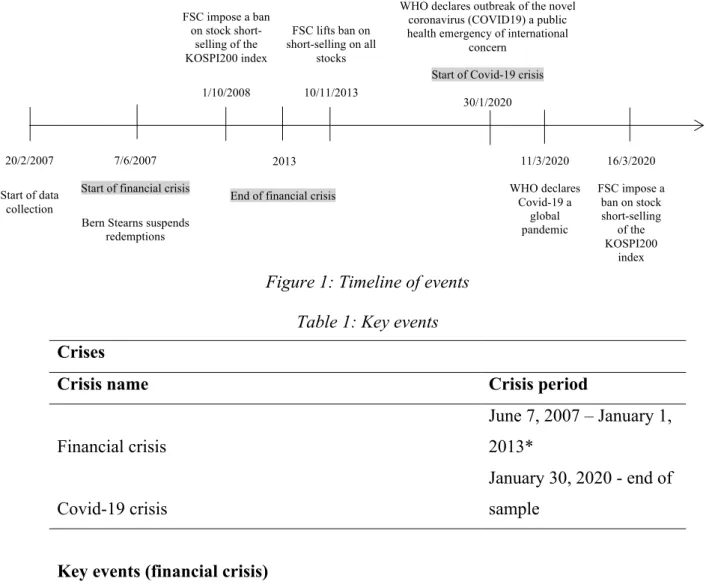
Figure 1: Timeline of events Table 1: Key events
Crises
Crisis name Crisis period
Financial crisis June 7, 2007 – January 1, 2013* Covid-19 crisis January 30, 2020 - end of sample
Key events (financial crisis)
Name Dates
Bear Stearns suspends redemptions June 7, 2007 FSC impose a ban on stock short-selling of the
KOSPI200 index October 1, 2008
FSC lifts short-selling ban on all stocks November 10, 2013
Key events (Covid-19 crisis)
Name Dates
WHO declares the outbreak of the novel coronavirus (Covid-19) a public health emergency of international
concern January 30, 2020
WHO declares Covid-19 a global pandemic March 11, 2020 FSC impose a ban on stock short-selling of the
KOSPI200 index March 16, 2020
20/2/2007 Start of data collection 17/2/2021 End of data collection 2013
End of financial crisis 7/6/2007
Start of financial crisis Bern Stearns suspends
redemptions 11/3/2020 WHO declares Covid-19 a global pandemic FSC impose a ban on stock short- selling of the KOSPI200 index 1/10/2008 FSC lifts ban on short-selling on all stocks 10/11/2013
WHO declares outbreak of the novel coronavirus (COVID19) a public health emergency of international
concern Start of Covid-19 crisis
30/1/2020 16/3/2020 FSC impose a ban on stock short-selling of the KOSPI200 index
10
*No official exact dates. Most sources focus on the timeline 2008-2013 with its peaks in 2010 and 2012. Sources:
financial crisis timeline (https://fraser.stlouisfed.org/timeline/financial-crisis), Eurozone sovereign debt crisis timeline (https://www.britannica.com/topic/euro-zone-debt-crisis#ref328829), Covid-19 crisis timeline (https://www.who.int/news/item/29-06-2020-covidtimeline), FSC press releases
(https://www.fsc.go.kr/eng/pr010101/22322?srchCtgry=&curPage=2&srchKey=sj&srchText=&srchBeginDt=202 0-03-01&srchEndDt=2020-03-31)
The data sample in this paper consists of periods of crisis and periods of ban, despite being highly correlated as the ban is a regulatory response to a crisis, it is important to note that an overlap exists, but the periods are not identical. As shown in Figure 1, there is an overlap between crisis period and ban period, however, the regulatory
implementation of short-selling restrictions began post-financial crisis and post-Covid-19 outbreak, albeit different time windows. The partly overlap between crisis and ban makes it difficult to identify the impact of the ban. However, the fact that the time windows do not perfectly overlap provides a possibility to compare crisis without ban and crisis with ban. The overlap of ban and crisis for the whole period is a mix of negative effect of ban, being a reduction in volatility, and positive effect of crisis, indicated by increasing volatility. Hence, the negative effect becomes mitigated. By conducting an event-window analysis we are able to isolate the first effect with a ban dummy. As a result, the negative effect should be larger because it is not mitigated by the effect of the crisis. We will make use of this comparison of the two crises in the empirical analysis when we disentangle the effects of crisis and ban, and analyse the policy implications made by South Korean regulators.
3.3 Macroeconomic Shocks
From an economic perspective, the financial crisis (2008) and Covid-19 crisis (2020) are defined by macroeconomic shocks. Whilst both are characterised by demand shocks, the latter is additionally described as a supply shock (Baldwin & Tomiura, 2020).
Investors are directly or indirectly influenced by macroeconomic announcements and base their investment strategies by valuing the overall market condition (Demir, 2019). Hence, observing macroeconomic shocks is important for understanding the impact on the overall stock market condition from supply and demand shocks. An index represents the average performance of the largest publicly traded companies on the stock
exchange, giving a benchmark for the overall market. Thus, by observing the
11
The global financial crisis (2008) resulted in the great trade collapse. Findings from data concludes that it is the steepest fall of world trade in recorded history, and the deepest fall since the great depression (1929) (Baldwin & Tomiura, 2020). The received wisdom is that the global collapse was due mostly to the demand shock, especially for “postpone-able” goods (Bénassy-Quéré et al., 2009; Eaton et al., 2016; Levchenko et al., 2010). Bems et al. (2010) use a global input-output framework to quantify US and EU demand spillovers during the global recession of 2008-2009. Their findings show that 20-30% of the decline in the US and EU demand was borne by foreign countries, Asia hit hardest. Park (2009) points out that the demand shock was significant in South Korea due to its heavy export-dependency, and lack of diversified export products. Similarly, Lee (2012) conclude that their high share of durable goods exports made them even more vulnerable to negative demand shocks.
In contrast to the financial crisis, the more recent Covid-19 crisis caused both demand shocks and supply shocks to the global economy. Baldwin and Tomiura (2020) explains the origin of the virus and which countries who had the most aggressive spread as the key factor to understand magnitude of the shocks. As the virus began to spread across the globe, large economies accounting for great shares of world supply and demand, reported the most cases causing heavy disruptions in international trade for goods and services. Due to their international presence, supply and demand shocks in these
countries created similar shocks worldwide. International supply chain distributions and decreases in aggregate demand from the contagion and the policies introduced to battle the spread slowed down world trade and global country output. The demand shocks were due to macroeconomic fall in aggregate demand from consumer and investment uncertainty, whilst shocks to the supply side were a product of international supply disruptions and production slowdown (Baldwin & Tomiura, 2020).
Although both crises are characterised by global recessions, volatile stock markets, and similar policy reactions, they are also structurally different in their macroeconomic shocks. Whereas both crises caused demand shocks, the Covid-19 crisis additionally triggered global supply disruptions. Thus, based on their differences it might be that the bans had different effects during the financial crisis and Covid-19 crisis.
12
4 Theoretical Framework
This chapter contains the theoretical framework of short-selling. The first sub-section gives a fundamental understanding of the trading strategy and provides an overview of the advantages and disadvantages of allowing it during market instability. The second sub-section explains the relationship between short-selling and price volatility. Finally, we introduce the hypothesis tested in this paper.
4.1 Short-selling and Short-selling Bans
Short-selling as a trading strategy allows an investor to engage in leveraged trading and potentially gain from any price movements by betting on its future value. The strategy enables a trader to borrow and sell a stock at current value without owning the security. The method relies on future price speculations and mispriced securities. In theory, an investor believes the price of a stock will decline in the future, hence, they borrow shares of a stock and then sells it at current market price. Before the stocks are returned to the lender and the short position is closed, the investor anticipates a decline in price, enabling them to repurchase the stocks at a lower cost, thus realise a profit from the difference in price. In addition to individual advantages, it has been argued that short-selling contributes to market efficiency (Boehmer et al., 2008; Boehmer et al., 2013; Bris et al., 2007). In contrast to short-selling, the opposite practice is known as long-selling, or having a long position. Going long is a trading strategy where an investment is made with a long-term horizon since the investor believes that the stock price will increase in the future, delivering a profit.
Financial regulators have been restricting short-selling as a response to market declines during economic crises, e.g. the Asian financial crisis (1997), the global financial crisis (2008), Covid-19 crisis (2020) (Daniel & Lhabitant, 2012; Ho et al. 2021). In the news of a potential global crisis, market participants have little time to absorb information about the extent of the crisis, evaluate securities based on the information, or trade according to those valuations. As market participants deal with uncertainty about future
13
stock prices, authorities identify short-selling as a potential threat to market stability (Frino et al., 2011). Thus, the main idea of banning short-selling as an investment strategy is to prevent traders from trading on imperfect information, betting on market turmoil. Thereby, contributing to an increase in market volatility.
When short-selling is allowed, it contributes to informational efficiency on the equity market by incorporating negative information into stock prices since traders can sell stocks without having ownership (Boehmer et al., 2008; Boehmer et al., 2013; Bris et al., 2007). In absence of such trading strategy, optimistic traders could inflate the stock price, pushing it above its intrinsic value. This being a result from not being able to react to private negative information about overvalued stocks (Jain et al., 2012). As discussed, the price discovery process from short-selling can result in overpricing and less efficient markets from divergence of opinion (Miller, 1977). In addition to assist price discovery (Boehmer & Wu, 2013; Boehmer et al., 2013; Chen & Rhee, 2010; Jung et al., 2013), short-selling might also provide additional liquidity to the equity markets (Boehmer & Wu, 2013). In a study Diether et al. (2009) showed that short sales made up a substantial amount of share volume for NASDAQ-listed stocks and NYSE-listed stocks in 2005. Evidence that short-selling enhances stock market liquidity have been supported by several empirical studies (Beber & Pagano, 2013; Charoenrook & Daouk, 2005; Jung et al., 2013; Li et al., 2018; Marsh & Payne, 2012). These results also support the theory developed by Diamond and Verrecchia (1987), that short sales decrease bid-ask spreads and increase liquidity by expanding the supply of stocks for sale through inclusion of traders willing to trade on private information.
Critics of short-selling argues that the practice leave the market vulnerable for market manipulation and bear raids, creating violent price fluctuations and stock prices below its fair value (Goldstein & Guembel, 2008). Such price declines trigger other investors to sell, resulting in further price declines (Jain et al., 2012). Heavy price fluctuations could expose a market for the risk of panic selling, causing a highly volatile stock market, thus destabilise the economy (Allen & Gale, 1991; Charoenrook & Daouk, 2005). In addition, there are some evidence that short-selling, in contrast to discussed literature, deteriorate liquidity (Blau & Whitby, 2018) and decreases informational efficiency (Kolasinski et al., 2013).
14
Furthermore, traders could face additional exposure of risk from short-selling. In addition to the standard risks faced by traders in the equity market, short sellers also face risks associated with identifying mispriced securities, loan fees and limited control over the price of covering their position if a broker recall the borrowed stocks. Further, there is also the danger of being short squeezed as a result of a sharp unexpected stock price spike. If short squeezed, short sellers will try to cover their position, pushing up the prices even further, forcing them to close out their position and realise a greater loss (Hull, 2015). In theory, there is no limit to the potential losses from practice short-selling, should the stock price appreciate, making it a risky business.
4.2 Expected Effect of Short-selling Bans on Volatility
Stock prices are constantly updated to incorporate latest available information about a publicly listed company. The new information causes people to revise their opinion about the value of the stock which results in changes of stock price volatility (Larsson, 2008). The uncertainty about the price makes investors uneasy about investing in the market. A fundamental understanding is that when we determine the price of an asset, we analyse the future profits of the company, i.e. the expected future cash flows. Therefore, new information about the prosperities of the company is crucial (Larsson, 2008). For example, with an ongoing economic crisis as seen both during the financial crisis (2008) and the Covid-19 crisis (2020), we are very curious which company will suffer from the recession, and to what extent. Hence, every piece of information about the company’s potential to survive the crisis is extremely important. This is likely to spur the volatility since speculations about future price changes may cause people to constantly revise their opinion about the value of an asset (Larsson, 2008; Shiller, 2014). In a press release highlighting the objective to support prices, the Technical Committee of the International Organization of Securities Commissions states “in the context of a credit crisis, where some entities face liquidity challenges but are otherwise solvent, a decrease in their share price induced by short-selling may lead to further credit tightening for these entities, possibly resulting bankruptcy” (Cox et al., 2008). Thus, motivating short-selling restrictions as an effective measure to decrease the volatility on the market.
15
Uncertainty and speculations about future price changes during economic turmoil is likely to spur volatility (Larsson, 2008; Shiller, 2014). This provides a theoretical reasoning for a positive correlation between short-selling and volatility. Volatility is also commonly used as a proxy for heterogeneous beliefs about stock prices (Boehme et al. 2006; Danielsen & Sorescu, 2001). Making it more difficult for investors to sell short might results in an increased volatility and an increased probability of stock market crashes, since these tend to follow stock market bubbles or booms (Abreu & Brunnermeier, 2002; Saffi & Sigurdsson, 2011; Scheinkman & Xiong, 2003).
Depending on the variability of information about final payoffs, the relaxation of short-selling constraints, may either increase or decrease volatility (Kraus & Rubin, 2003). Thus, introducing short-selling restriction as a market stabilising strategy may lead to increased volatility. This rise in volatility may not solely be observed around the implementation of a ban, but also around the relaxation.
There seems to be a consensus amongst the existing empirical research suggesting that short-selling contributes to market efficiency, providing important information and helps to dampen a volatile market. However, proponents of short-selling restrictions claim the opposite, constraints are put on selling short to promote stability and limit excessive market downsides. Whilst the existing literature studies the effects of short-selling restrictions during previous bans and financial crisis, this research has the possibility contribute to the literature by incorporate yet another crisis and periods of bans to further examine the legitimacy of policy makers to restrict short-selling. Based on the incentives from regulators, to combat increasing market volatility with short-selling bans, we are expecting to find a negative correlation between short-short-selling bans and index price volatility. Against this background, we have developed a null
hypothesis and an alternative hypothesis testing if whether short-selling ban does reduce index price volatility.
𝐻! = 𝑠ℎ𝑜𝑟𝑡 𝑠𝑒𝑙𝑙𝑖𝑛𝑔 𝑏𝑎𝑛 𝑑𝑜𝑒𝑠 𝑛𝑜𝑡 𝑑𝑒𝑐𝑟𝑒𝑎𝑠𝑒 𝑖𝑛𝑑𝑒𝑥 𝑝𝑟𝑖𝑐𝑒 𝑣𝑜𝑙𝑎𝑡𝑖𝑙𝑖𝑡𝑦 𝐻" = 𝑠ℎ𝑜𝑟𝑡 𝑠𝑒𝑙𝑙𝑖𝑛𝑔 𝑏𝑎𝑛 𝑑𝑒𝑐𝑟𝑒𝑎𝑠𝑒𝑠 𝑖𝑛𝑑𝑒𝑥 𝑝𝑟𝑖𝑐𝑒 𝑣𝑜𝑙𝑎𝑡𝑖𝑙𝑖𝑡𝑦
It is important to note that our research does not observe how short-selling bans have affected stock market volatility. We are not able to identify causal effects but only
16
correlation between the existence of bans and index price volatility. Due to the overlapping period of ban and crisis.
17
5 Data
This section will present data, variable description, expected result, and the descriptive statistics applied in this research.
5.1 Data
On the Korean Stock Exchange (KRX), the largest and most established companies are traded on the KOSPI market, covering the major firms in the country and regarded as the primary market. The KOSPI200 index represent stock prices of the 200 largest KOSPI listed companies and is the prime index in South Korea with a 93% market capitalisation of the whole KRX, (Bloomberg, 2021). Thus, it represents a vast majority of all trading activity on the whole market.
The main source of data collection was gathering secondary data from Thomas Reuters Eikon. The data collection for interest rate was collected from the central bank of the Republic of Korea, Bank of Korea.
With the aim to observe if the implementation of short-selling ban has proved to decrease index price volatility during the financial crisis and Covid-19 crisis, our time series ranges from 20/2/2007 to 17/2/2021, consisting of 3456 trading days. The data is collected daily to avoid the smoothing effect of using weekly or monthly data and get a more precise estimation of volatility. However, since interest rate is set monthly by the central bank, it has been generalised to daily data to match our remaining dataset.
Time dummies are included to allow us for observing if the policy has shown to have the intentional result during both crises. The first dummy, defining the time span of the short-selling ban during the financial crisis, ranges from its implementation 1/10/2008 to when it was completely lifted in 10/11/2013. The second dummy, defining the time span of the short-selling ban during the Covid-19 crisis, ranges from its implementation 16/3/2020 till the end of our data collection, 17/2/2021. In accordance with previous studies, macroeconomic variables have been chosen as control variables as they have had
18
documented significant effects on stock price movements in various markets (Alshogeathri, 2011; Hashim et al., 2018).
5.1.1 Dependent Variable: Index Price Volatility
The dependent variable in this research is a volatility measure of the South Korean index, KOSPI200, denoted as index price volatility. Following Jones et al. (1994), realised range is used as a measure of volatility. The use of realised range is supported by Andersen and Bollerslev (1998), Helmes et al. (2017), and Jones and Wilson (1989). A range estimator involves calculating the log of the ratio of the highest observed price to the lowest observed price for trading day t, which then becomes the volatile estimate for day t (Brooks, 2014).
𝐼𝑛𝑑𝑒𝑥 𝑝𝑟𝑖𝑐𝑒 𝑣𝑜𝑙𝑎𝑡𝑖𝑙𝑖𝑡𝑦# = 𝑙𝑜𝑔 7ℎ𝑖𝑔ℎ#
𝑙𝑜𝑤#9 (1)
The highest and lowest daily observed price of the index is directly conducted from Thomas Reuters Eikon.
5.1.2 Bans
We capture the short-selling bans by including dummy variables in the regression. The dummy variables represent the time period of which the policy has been active. From Figure 1, the first dummy variable (D1), capturing the ban during the financial crisis (2008), starts 1/10/2008, and expires 10/11/2013. The second dummy variable (D2), capturing the short-selling restrictions during the Covid-19 crisis (2020), starts
16/03/2020, and expires 17/02/2021. The ending date is only a representative of the end of our data sample and not an actual expiring date for the ban of short-selling in South Korea. The time dummy variables equal 1 for a given time period, and 0 for all other. Thus, it allows us to control for time-specific events. In this thesis, the time-specific events will represent periods of ban.
5.1.3 Control Variables
The relationship between macroeconomic announcements and stock price movements have been studied quite extensively and numerous studies claim that there is a strong
19
relationship between macroeconomic development and stock price level (Cassola & Morana, 2004; Keran, 1971; Officer, 1973; Pesando, 1974; Rogalski & Vinso, 1977) Following Reilly and Wachowicz (1979) we will include macroeconomic variables in our research to account for fluctuations in index price volatility. The following variables will be utilised as control variables: exchange rate volatility (USD/KRW), West Texas Intermediate (WTI) crude oil price volatility, and interest rate.
Exchange rate volatility
In macroeconomic theory, exchange rate volatility and stock prices variability are defined in the goods market. The effect of exchange rate, measured by price of domestic currency in terms of foreign currency, on stock prices were established by Dornbusch and Fischer (1980) and referred the effect to the current account or the balance of trade. When the domestic country engages in trade, the exchange rate is an indicator of the country’s competitiveness against foreign countries. If the domestic currency
depreciates, the value decreases and net exports rises. This will increase institutional and private flows into the domestic market and exporting firms will experience higher profits and expected future cash flows. As a result, stock prices increase. For importing companies, we would expect the reverse effect. The opposite holds for an appreciation of the domestic currency (Gottfries, 2013). The higher the exchange rate volatility, the higher the risk associated with the domestic currency. With an increase in risk, the country becomes less attractive for foreign investors. As a consequence, stock prices become depressed and volatility inflates (Marozva, 2020). Thus, theoretically, exchange rate volatility exhibits a positive relationship with index price volatility, in accordance with Lee and Ryu (2018).
Following Helmes et al. (2017) the volatility will be measured by the log of the ratio of the highest observed rate to the lowest observed rate for trading day t, which then becomes the volatile estimate for day t (Brooks, 2014). By logarithmic transformation, the time series data distribution becomes more normally skewed and stabilises the variance of the series.
𝐸𝑥𝑐ℎ𝑎𝑛𝑔𝑒 𝑟𝑎𝑡𝑒 𝑣𝑜𝑙𝑎𝑡𝑖𝑙𝑖𝑡𝑦#= 𝑙𝑜𝑔 7
ℎ𝑖𝑔ℎ𝑒𝑠𝑡 𝑜𝑏𝑠𝑒𝑟𝑣𝑒𝑑 𝑟𝑎𝑡𝑒#
20
Following Lee and Ryu (2018) and Marozva (2020), the exchange rate between an emerging and a developed market1 will be used in this research, more specifically, the
USD/KRW exchange rate. In line with macroeconomic theory, we expect a positive correlation between exchange rate volatility and index price volatility, where supply and demand shifts in foreign exchange market produces stock price fluctuations through shifts in a country’s terms of trade.
WTI crude oil price volatility:
It is well documented that there is a strong correlation between global crude oil prices and the equity market. (Aloui & Jammazi, 2009; Basher & Sadrsky, 2006; Miller & Ratti, 2009). The research shows that spill-over effects from volatility on the crude oil market has a significant effect on the equity market in both developed and emerging markets. Thus, oil market demand and supply shocks are shown to have an effect on the activity, hence, volatility of the global equity market. This is in line with findings from Apergis and Miller (2009). The relationship has also been confirmed for the South Korean stock market (Masih et al., 2011). In this research, crude oil prices are estimated using WTI crude oil index as a benchmark for the overall commodity price, which is common praxis (Chevalier et al., 2010). It will be measured as the log of the ratio of the highest observed price to the lowest observed price for trading day t, which then
becomes the volatile estimate for day t (Brooks, 2014).
𝑊𝑇𝐼 𝑣𝑜𝑙𝑎𝑡𝑖𝑙𝑖𝑡𝑦 = 𝑙𝑜𝑔 7ℎ𝑖𝑔ℎ𝑒𝑠𝑡 𝑜𝑏𝑠𝑒𝑟𝑣𝑒𝑑 𝑝𝑟𝑖𝑐𝑒#
𝑙𝑜𝑤𝑒𝑠𝑡 𝑜𝑏𝑠𝑒𝑟𝑣𝑒𝑑 𝑝𝑟𝑖𝑐𝑒#9 (3)
We assume a positive relationship between WTI crude oil price volatility and index price volatility since fluctuations in crude oil prices are highly correlated with movements of stock market prices.
Interest rate
From a theoretical perspective, interest rate as a function of changes in monetary policy is closely related to stock price fluctuations, causing direct and indirect changes to the
1 MSCI classifies South Korea as an emerging market in their 2020 annual market classification review.
21
stock and bond market. According to economic theory there should exist a negative relationship between interest rate and stock market prices since an increase in interest rates reduce investments and consumer spending (Gottfries, 2013). Due to the
assumptions of asset pricing, an increase in interest rate change expectations of future cash flows, the required rate of return and market risk will increase as a result as investors will seek returns to offset the increased cost of capital. From a reduction in expected future cash flows, profits will reduce and stock prices tend to follow.
(Gottfries, 2013). Thus, changes in interest rate affect investor confidence and market risk. Empirical evidence supports this relationship, Spiro (1990) found the interest rate to be a highly significant macroeconomic variable to explain stock price movements and responsible for most of the unrestrained short-term volatility on stock price indexes due to uncertainty of future cash flows and risk premiums. In line with these findings, Engle and Rangel (2008) suggest that interest rate volatility is an important factor driving movements in stock prices. Against this background we expect a positive correlation between interest rate and index price volatility as increase in interest rate discourage investments and increase investment risk (Gottfries, 2013; Spiro, 1990).
5.2 Expected Result
Table 2 below presents a summary of expected signs for the variables
Table 2: Variables used in model and expected signs of correlation
Variables Short Expected sign
Dependent variable
Index Price Volatility IPV
Independent variables
Ban Financial crisis dummy D1 -
Ban Covid-19 crisis dummy D2 -
Control variables
Exchange rate volatility XR +
WTI crude index volatility WTI +
22 5.3 Descriptive Statistics
Table 3 provides descriptive statistics of the dependent, and control variables of this research. The rows include mean, standard deviation, maximum value, and minimum value for all the variables used in this research.
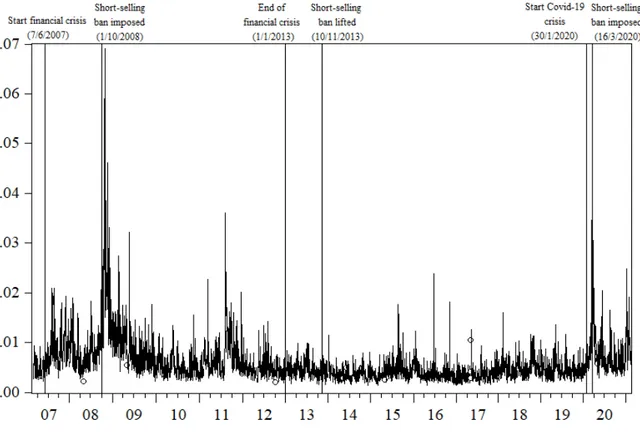
Observing Table 3, the mean daily volatility between 2007 and 2021 is 0.59 percent, with a range from 0.13 percent to 6.9 percent.
Table 3: Descriptive statistics
Statistics N Mean St. Dev. Min Max
Index price volatility 3456 0.005851 0.004333 0.001322 0.069092 Exchange rate volatility 3456 0.003723 0.003086 0.000428 0.074367 WTI Volatility 3456 0.014761 0.011690 0.002590 0.197831 Interest rate 3456 0.023283 0.012049 0.005000 0.052500
Table 4 provides a correlation analysis, explaining the statistical relationship between the dependent variable and control variables in this research. The aim of the correlation analysis is to reveal potential multicollinearity amongst the chosen variables, inflating the standard errors of the coefficients. From Table 4, the highest correlation can be observed between WTI volatility and exchange rate volatility (0.38). However, we do not perceive this as a potential problem of multicollinearity due to the relatively low percentage (Ravi Kumar, 2020).
23
Table 4: Correlation analysis
Index price volatility Exchange rate volatility WTI
volatility Interest rate Index price volatility 1 Exchange rate volatility 0.523030 1 WTI volatility 0.377294 0.376811 1 Interest rate 0.264399 0.068756 -0.064145 1
Figure 2 illustrates the daily realised volatility of the sample period 17/02/2007 to 20/02/2021, with realised volatility on the y-axis and the timeline on the x-axis.
24
6 Empirical Analysis
This section presents the empirical analysis of this research. First sub-section 6.1 focuses on the regression model, followed by a two-stage analysis, containing both full sample estimation and event-window estimation.
The empirical analysis is divided into two sub-sections. Sub-section 6.1 refers to the full sample estimation, whilst sub-section 6.2 refers to the event-window estimation. The full sample estimation contains a regression over the full sample period, providing the overall effect of crisis and ban on index price volatility. To disentangle the effect of crisis and ban, an event-window analysis is individually conducted for both crises, where the regression contains an equal amount of trading days without short-selling ban, as with short-selling ban. Both during times of economic crisis. By doing this, we enable to check if the effect of the ban was stronger than the contracting effect of the crisis.
To formally test the two hypotheses, a multiple linear regression using an ordinary least squares (OLS) method is used. This enables us to assess the econometric models with index price volatility as the dependent variable and exchange rate (USD/KRW) volatility, WTI crude oil price volatility, and interest rate as control variables. The regressions are performed using the software Eviews12, the result of the regressions is presented in Tables 5, 6 and 7. Further, the hypotheses are tested at 5% significance level. Since the purpose of the research is to observe the effects of restricting short-selling investments during economic turmoil, we will include dummy variables for periods of short-selling bans. This specification is used with the purpose to observe the effects of restricting short-selling investments during economic turmoil.
6.1 Full Sample Estimation
For model (1), exchange rate volatility, WTI volatility, and interest rate are included to account for factors which are expected to affect index price volatility.
25
𝐼𝑃𝑉#= 𝛽!+ 𝛽"𝐷"+ 𝛽$𝐷$ + 𝛽%𝑋𝑅𝑉#+ 𝛽&𝑊𝑇𝐼𝑉#+ 𝛽'𝐼𝑅#+ 𝜀# (1)
Where t refers to every trading day for the full sample estimation, from 20/02/2007 to 17/02/2021, a total of 3456 trading days. IPV is index price volatility, XRV is exchange rate volatility between the South Korean Won and US Dollar, WTIV is WTI volatility, IR is interest rate, and 𝜀 is the error term.
D1 = 1, if short-selling ban during financial crisis; D1 = 0, otherwise
D2 = 1, if short-selling ban during Covid-19 crisis; D2 = 0, otherwise
Initially we run a regression for model (1), for the entire sample including all our variables, and the results are shown in the second column in Table 5. Additionally, we run the same regression with interest rate omitted as it is a monthly variable which has been generalised to daily data. The reasoning for omitting the variable is that the daily generalisation becomes nearly constant when running the third model in our statistical program, violating the assumptions of the least squares method. Thus, the same procedure has been performed for the other models. From column 3 in Table 5, the estimation results from omitting the interest rate variable indicates that the results do no change qualitatively. Hence, we will run both event-window analyses without the interest rate variable.
The results from the initial regression indicate a significant positive correlation between the ban during the financial crisis and the index price volatility, not as anticipated. This result show that the index price volatility, contrary to the ban policy implications, increased during the financial crisis period for which the ban was active. A similar outcome is possible to observe for the Covid-19 crisis period, there is a significant positive relationship between period and the index price volatility, in line with previous literature but contradicting our expectations. The estimation results for model (1) concludes that, nor did the regulatory framework reduce volatility during financial instability, but the volatility on the Korean exchange actually increased during the periods, although small changes. These findings are aligned with previous empirical evidence, weakens the incentive for short-selling restrictions.
26
Further, from results in Table 5, all control variables have the expected sign and show a significant influence on the index price volatility at a 1% significance level. The
exchange rate volatility between USD/KRW captured by the control variable (Exchange rate volatility), has had a positive significant effect on the KOSPI200 price volatility of 0.601 units for one unit change in the exchange rate volatility. This outcome is in line with theory and expectations, swings in supply and demand of domestic currency affects competitiveness and enhances risk which directly and indirectly causes stock price fluctuations.Volatility on the global oil price market, estimated using a proxy as benchmark (WTI volatility), had a positive significant influence on the index price volatility of 0.062 unit for a one unit change in global oil price volatility. Consistent with initial assumption, oil price movements affect stock price activity on the South Korean equity market, although, the effect was relatively small. Furthermore, there is a positive significant relationship between interest rate and index price volatility. The interpretation of the effect on index price volatility from changes in interest rate
becomes more visual if we regard the percentual change, a 1 % increase in interest rate, increases the index price volatility by approximately 12%. This discovery finds support in literature and prior assumptions, an increase in interest rate reduce demand for capital and overall consumer demand which increase investor uncertainty and market risk premiums (Spiro, 1990).
27
Table 5: Regression results: Entire timeline included
Dependent variable:
Index price volatility
Dummy: ban financial
crisis 0.001*** 0.001***
(0.000) (0.000)
Dummy: ban Covid-19
crisis 0.004*** 0.002***
(0.000) (0.000)
Exchange rate volatility 0.601*** 0.614***
(-0.020) (0.021) WTI volatility 0.062*** 0.066*** (0.005) (0.006) Interest rate 0.117*** (0.005) Constant -0.001*** 0.002*** (0.000) (0.000) Time period 20/2/2007 – 17/2/2021 20/2/2007 – 17/2/2022 Observations 3456 3456 Adjusted R2 0.426 0.339 F Statistic 514.227*** 444.118***
Note: ***/**/* denotes significance at 1%/5%/10%; heteroskedasticity robust standard errors in parentheses.
6.2 Event-Window Estimation
We continue the analysis by running a second regression for an event-window estimation (2) representing an alternative specification-model for the financial crisis. Finally, we run a third regression for an event-window estimation (3) corresponding to an alternative specification-model for the Covid-19 crisis. This analysis approach is done due to the problem of overlapping periods between crisis and ban causing a mix of counteracting effects. By running an event-window analysis we are able to isolate the effect of the ban with the ban dummy. Resulted estimation output for event-window estimation (2) is presented in Table 6, whilst Table 7 demonstrates the estimation output for the restricted model (3). Since the length of crisis without ban and crisis with ban are unequal, we adjust the intervals to make a correct comparison. By creating a restricted window where we have an equal time of crisis without ban, and crisis with ban, we are
28
able to capture the most accurate impact of a ban policy on index price volatility during a period of financial instability.
Table 6 illustrates the estimation output for model (2), the resulted coefficients captures the effect of short-selling ban during the financial crisis. From the output table it is possible to observe that the ban period had an insignificant negative influence on index price volatility at 5% level of significance. However, the ban becomes negatively significant for a 10% level of significance. Thus, in line with our expectations the ban policy works, but is not strong enough to compensate the positive effect of the crisis. Moreover, from the estimation output we identify that all control variables are statistically significant at a 1% level of significance and have the expected sign. Exchange rate volatility, and WTI volatility show a similar positive relationship with index price volatility as in the full sample estimation (1). For one unit change in
exchange rate volatility, the index price volatility increased by 0.572 units illustrated in Table 6. For one unit change in WTI volatility, the index price volatility increased by 0.077 units illustrated in Table 6.
𝐼𝑃𝑉# = 𝛽!+ 𝛽"𝐷"+ 𝛽%𝑋𝑅𝑉#+ 𝛽&𝑊𝑇𝐼𝑉#+ 𝜀# (2)
Where t refers to every trading day for the event-window estimate for the financial crisis, from 07/06/2007 to 13/01/2010, a total of 648 trading days.
29
Table 6: Regression results: Financial crisis estimation
Dependent variable:
Index price volatility
Dummy: ban financial crisis -0.001* (0.000)
Exchange rate volatility 0.572***
(0,044) WTI volatility 0.077*** (0.021) Constant 0.005*** (0.000) Time period 07/06/2007 – 13/01/2010 Observations 648 Adjusted R2 0.322 F Statistic 103.230***
Note: ***/**/* denotes significance at 1%/5%/10%; heteroskedasticity robust standard errors in parentheses.
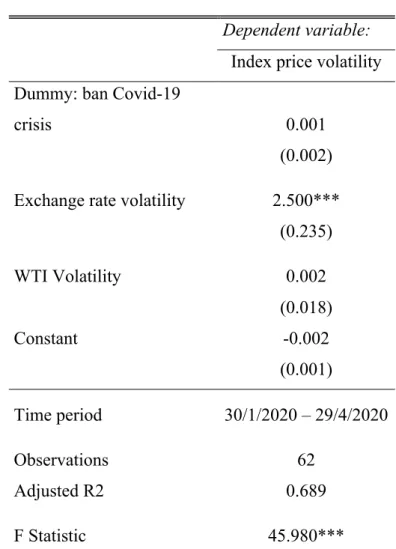
Finally, we run a regression for the event-window estimation (3), and Table 7 presents the estimation output. The event-window estimation (3) captures the effects of short-selling restrictions during the Covid-19 crisis. Having observed the output Table 7 we can conclude that the ban period for the Covid-19 crisis is statistically insignificant. Thus, during the Covid-19 crisis, there is no effect of the ban on the index price volatility. Hence, the ban does not work, contradicting our expectations.
In line with earlier estimation output, the exchange rate volatility has had a significant positive impact on the index price volatility. For a one unit change in exchange rate volatility, the index price volatility increases by 2.5 units. This means that our dependent variable is extensively influenced by the level of exchange rate volatility
30
between USD/KRW. Contrary to model (1) and (2), we find that WTI volatility is insignificant at a 10% level of significance.
𝐼𝑃𝑉#= 𝛽!+ 𝛽$𝐷$ + 𝛽%𝑋𝑅𝑉#+ 𝛽&𝑊𝑇𝐼𝑉#+ 𝜀# (3)
Where t refers to every trading day for the event-window estimate for the Covid-19 crisis, from 30/01/2020 to 29/04/2020, a total of 62 trading days.
Table 6: Regression results: Covid-19 observation
Dependent variable:
Index price volatility
Dummy: ban Covid-19
crisis 0.001
(0.002) Exchange rate volatility 2.500***
(0.235) WTI Volatility 0.002 (0.018) Constant -0.002 (0.001) Time period 30/1/2020 – 29/4/2020 Observations 62 Adjusted R2 0.689 F Statistic 45.980***
31
7 Discussion of Results
The results are somewhat counterintuitive. From a policymaker’s perspective, short sellers destabilise the market. By restricting the investment strategy, the result would be a reduction in volatility. Contrariwise, short sellers act as the opposite, providers of essential information to the stock market. Thus, contributing to a more efficient market, in line with the fundamental theory in this research area developed by Miller (1977). Hence, preventing short-selling may theoretically cause movements from its intrinsic value and might increase the volatility. In this research, the act of the policymakers appears to have shown undesirable results as the ban did not only fail to reduce index price volatility. Moreover, it has increased.
Firstly, our empirical result for the full sample estimation show a positive effect on index price volatility for both the financial crisis (2008) and the Covid-19 crisis (2020). This means that short-selling ban have a positive relationship with the stock price volatility on KOSPI200. The result is in line with prior empirical findings (Chang et al., 2007; Charoenrook & Daouk, 2005; Boehmer et al., (2013); Bohl et al., 2012; Helmes et al., 2017). As previously mentioned in the paper, the index price volatility from our estimation results seems to increase during the period of ban. Intuitive, one might draw the conclusion that the ban was both an insufficient policy to reduce the market
volatility, and a contributing factor to increased market volatility. A limitation in this study is to address the potential endogeneity problem of which changes in index price volatility may be a consequence of deviations in overall market conditions during the crises rather than changes in short-selling regulations. Whilst our results indicate that short-selling restrictions were accompanied by increased volatility, we cannot confirm that the policy itself directly caused this increase in volatility. Thus, although a positive effect is observed for the full sample estimation, this might be because the effect of the crisis was stronger than the ban itself. Hence, it is not necessarily that the ban does not work. It could be the case that the significantly increased volatility post-ban, as
observed in Figure 2, was a result of the peak of the ongoing global crisis and was strictly coincidental. Morales-Zumaquero and Sosvilla-Rivero (2015) presents empirical evidence supporting this notion. They found whilst there was an effect on stock
32
be triggered by exogenous factors in Europe. Thus, it is possible that we would experience even greater price swings if the policy would not have been implemented.
Secondly, our empirical results for the event-window estimations expectedly shows different outcomes regarding the significant impact of the ban policy between the two crises. Despite their similarities, the crises are characterised by key differences of macroeconomic shocks, highlighted in Section 3.3. Additionally, they are characterised by different length of crisis and reaction time of policymakers. Primarily observing the financial crisis, model (2) does not support the empirical findings from the initial
regression (1). The regression output reveals that the ban works as the effect is shown to be negative. However, the statistical insignificance of short-selling ban on index price volatility shows that it is not strong enough to compensate for the effect of the crisis. Secondarily observing the Covid-19 crisis, model (3) lack statistical significance. Hence, during the Covid-19 crisis, the ban does not work as the result show no effect on index price volatility from ban. From this we can conclude that the positive effect found for model (1) can be explained by a very strong positive effect of the crisis. Which strengthens our previous arguments that the effect of the crisis might be stronger than the counteracting effect of the ban. The lack of significance for the Covid-19 crisis could be explained by the differences between the crises in terms of macroeconomic shocks as discussed in Section 3.3. Further the event-window analysis suffers from data restrictions due to the fast reaction time of South Korean policymakers.
Statistically, the ±0.001 percentage change in index price volatility from the ban is relatively small with its effect close to zero. However, the economical perspective is of interest to discuss. An increasing stock market volatility indicates a growing uncertainty which would reduce its attractiveness for investments. Hence, although statistically small, a 1% incline in uncertainty, will theoretically cause investors to require a higher risk premium to cover the additional risk, or choose an alternative market which is perceived as more stable. As discussed, although the statistical significance is small, the economic significance has a greater impact on the financial market, which is of interest for regulators to analyse when considering intervening in the equity market as a
33
Our results for the event-window specifications are non-consistent, which is anticipated as the crises has shown to be structurally different. As discussed in section 3.3, both crises were largely characterised by the decreased demand for goods and services due to economic recession. Since the rapid growth of the Covid-19 virus was centred in heavy global exporting economies, the result was a disruption of essential international supply chains, causing a supply shock. Hence, different results shown in this thesis might be dependent on the dissimilar characteristics of macroeconomic shocks and their impact on global economy.
Ultimately, a noticeable difference between the regressions is their sample size. Where model (2) consists of a larger amount of data. Whereas the latter model (3) have a smaller sample size due to South Korean regulators’ fast response to market volatility, in comparison to the financial crisis. A statistical issue of having a small sample size could be an inflated risk of committing a type 2 error, i.e. the probability of accepting a false hypothesis (Gujarati & Porter, 2009). A probability of making correct decision is determined by the statistical power, which is largely dependent on sample size, whereas a small sample size could increase the likelihood of a type 2 error. Thus, with the small sample size in model (3), we should be aware of the likelihood of a type 2 error
(Gujarati & Porter, 2009). Logically a solution would be to increase the sample size. However, in this research we are unable to increase our sample length, due to data restrictions for the Covid-19 crisis, as our sample length is dependent on the reaction time of South Korean regulators.
34
8 Conclusion
The aim of this thesis was to evaluate the policy response made by South Korean regulators to combat increasing market volatility. Our thesis shows that the
implementation of short-selling restrictions fails to reduce index price volatility during the financial crisis (2008) and Covid-19 crisis (2020).
We divided our full sample (1), into 2 subsamples; the financial crisis (2) and the Covid-19 crisis (3), and utilised a series of daily stock data for 3456 trading days from the South Korean stock market index; KOSPI200. For the full sample (1), a positive effect was observed. However, it is not necessarily that the ban did not work, but might be because the effect of the crisis was stronger. This contradict regulators incentive for implementing short-selling bans as a response to significant increases in market
volatility. The results for the event-window estimations (2) and (3), showed that
although the ban worked during the financial crisis, the effect of the ban was not strong enough to compensate for the effect of the crisis. For the Covid-19 crisis we found that the ban did not work. The difference in the empirical evidence might be that although similarities, the effect of the ban might work differently under certain macroeconomic shocks, as highlighted in the thesis. Another possible explanation could be a function of the data restrictions for the Covid-19 crisis which might cause for statistical errors.
To our knowledge, prior research on the subject has mostly focused on the financial- and debt crisis (2008-2013) (Bohl et al., 2012; Bohl et al., 2016; Helmes et al., 2017). Although the market has historically experienced numerous volatile periods, the severity of the financial crisis trigged regulators to intervene in the stock market, with the intention to reduce market volatility. The ongoing Covid-19 crisis has enabled us to extend the scope of this research area by including yet an additional time period which similarly to the financial crisis (2008), has been characterised by both an economic crisis and short-selling restriction policies. In addition, this thesis also provides a theoretical explanation on why the bans might work asymmetrically under structural differences, i.e. demand and supply effects.
35
This paper contributes to the large pile of empirical evidence that short-selling constraints does not reduce volatility, which was the main goal of FSC. Although evidence points on the opposite, government still defend their decision implementing them during financial turmoil. According to Hwang Sei-Woon, researcher at the Korea Capital Market Institute, opponents of the policy speculates that it might be heavily influenced by political pressure rather than theoretical argumentation (Yoon, 2020).
Based on our empirical findings we conclude that the effect of the ban worked
differently during the two observed crises. Hence, the response by policymakers should not be solely based on significantly increased market volatility. Instead we would recommend policy decisions to be influenced by other important macroeconomic variables as well, as highlighted in this thesis. Decisions are advised to be influenced by the structural effect of the crisis. As we detected a possible correlation between the structure of macroeconomic shocks and the effectiveness of short-selling bans, further studies in this field could test the hypothesis that the macroeconomic structure of a crisis affects the outcome of a short-selling ban. In line with this study, future research could observe the effect of selling bans on several markets experiencing short-selling restrictions during both the financial crisis (2008) and Covid-19 crisis (2020). Thus, enabling for observing a potential consistency of the effectiveness of short-selling restrictions due to macroeconomic shocks.