Mälardalen University Press Dissertations No. 202
FROM PASSIVE TO ACTIVE ELECTRIC DISTRIBUTION NETWORKS
Javier Campillo 2016
School of Business, Society and Engineering Mälardalen University Press Dissertations
No. 202
FROM PASSIVE TO ACTIVE ELECTRIC DISTRIBUTION NETWORKS
Javier Campillo 2016
Copyright © Javier Campillo,2016 ISBN 978-91-7485-271-4
ISSN 1651-4238
Copyright © Javier Campillo,2016 ISBN 978-91-7485-271-4
ISSN 1651-4238
Printed by Arkitektkopia, Västerås, Sweden
Mälardalen University Press Dissertations No. 202
FROM PASSIVE TO ACTIVE ELECTRIC DISTRIBUTION NETWORKS
Javier Campillo
Akademisk avhandling
som för avläggande av teknologie doktorsexamen i energi- och miljöteknik vid Akademin för ekonomi, samhälle och teknik kommer att offentligen försvaras
fredagen den 17 juni 2016, 09.15 i Paros, Mälardalens högskola, Västerås. Fakultetsopponent: Professor Wu Jianzhong, Cardiff University
Akademin för ekonomi, samhälle och teknik Mälardalen University Press Dissertations
No. 202
FROM PASSIVE TO ACTIVE ELECTRIC DISTRIBUTION NETWORKS
Javier Campillo
Akademisk avhandling
som för avläggande av teknologie doktorsexamen i energi- och miljöteknik vid Akademin för ekonomi, samhälle och teknik kommer att offentligen försvaras
fredagen den 17 juni 2016, 09.15 i Paros, Mälardalens högskola, Västerås. Fakultetsopponent: Ph.D. Ritwik Majumder, ABB Corporate Research
Abstract
Large penetration of distributed generation from variable renewable energy sources, increased consumption flexibility on the demand side and the electrification of transportation pose great challenges to existing and future electric distribution networks. This thesis studies the roles of several actors involved in electric distribution systems through electricity consumption data analysis and simulation models. Results show that real-time electricity pricing adoption in the residential sector offers economic benefits for end consumers. This occurs even without the adoption of demand-side management strategies, while real-time pricing also brings new opportunities for increasing consumption flexibility. This flexibility will play a critical role in the electrification of transportation, where scheduled charging will be required to allow large penetration of EVs without compromising the network's reliability and to minimize upgrades on the existing grid. All these issues add significant complexity to the existing infrastructure and conventional passive components are no longer sufficient to guarantee safe and reliable network operation. Active distribution networks are therefore required, and consequently robust and flexible modelling and simulation computational tools are needed for their optimal design and control. The modelling approach presented in this thesis offers a viable solution by using an equation-based object-oriented language that allows developing open source network component models that can be shared and used unambiguously across different simulation environments.
ISBN 978-91-7485-271-4 ISSN 1651-4238
Acknowledgements
This thesis was carried out at the School of Business, Society and
En-gineering at Mlardalen University in V¨aster˚as, Sweden. First, I would
like to thank my main supervisor, Erik Dahlquist for all his support and guidance throughout these years as well as Fredrik Wallin for all the fruitful discussions. I would also like to thank the Tecnologica de Bo-livar University, in Colombia, for all your support to start my doctoral studies as well as my colleagues there for encouraging my research.
Furthermore, thanks to all the members of the PLEEC project for everything you taught me about how to make our cities more sustain-able and all the great memories from our workshops. I want to express my gratitude to Alberto Traverso, Stefano Barberis and the amazing team at the thermochemical power group at Genoa University, for their hospitality during my research stay, all the stimulating discussions and pizza Tuesdays!.
My most sincere thanks to Iana Vassileva for her invaluable support, Ivo Krustok and Richard Thygesen for our endless talks that sometimes ended up in productive collaboration. To Nathan, Lukas, Pietro and all the fellow PhD students and colleagues at MDH for all the fun moments, fikas and of course, random conversations that helped taking the edge o↵ where simulations were not working out.
Special thanks to my family: my mother, for encouraging me to pursue my dreams, my father, for teaching me to always move forward, my sisters and niece, Carolina, Elizabeth and Gabriela, for their fun presence via Facetime, Nurys, for her unconditional support and my cousin, Patricia, for being a role model who taught me how to enjoy life. I would also like to thank all of my friends in Colombia for their support over the distance and those in Sweden who became my family here and helped me stay sane throughout these years.
Last but not least, I would like to thank my beloved wife, Lisette, for being my partner in crime, who spent sleepless nights while I was writing and always motivated me to strive towards my goal.
Summary
Existing and future electric distribution networks face great technical challenges from several directions: on one hand, increased penetration of distributed generation (DG) changes the top-down unidirectional power flow; on the other, electricity markets are becoming more flexible to re-spond to price fluctuations introduced by larger penetration of variable renewable energy sources, which in turn offers new possibilities for cus-tomers to play an active role by adjusting their consumption patterns to market variations; finally, the electrification of transportation will increase the electricity demand rapidly, and therefore an active infras-tructure that can supply reliable power at all times must be available.
This thesis studies the roles of two major actors involved in the de-velopment of these new active distribution networks: active customers and DG. Making use of data obtained from the mature automated me-ter reading infrastructure available in Sweden, this work started with an analysis of electricity consumption patterns in a large residential area located in Sollentuna, near Stockholm, with two distinct groups of cus-tomers; one group connected to the district heating network and another group with its own heat pump based heating system. This information allowed electricity consumption patterns of both customer groups to be evaluated. Furthermore, in order to determine strategies that would increase consumers’ demand flexibility, the Swedish electricity market was studied to identify opportunities from existing electricity contract options that offered variable pricing schemes. Different pricing schemes were evaluated, with special focus on real-time pricing (RTP), to deter-mine the economic impact on customers from both groups. It was found that RTP offered economic benefits on both groups, especially on those that used heat pumps, even without adopting demand-side management strategies.
Additionally, a library was built using the open source, object-oriented modelling language Modelica, to carry out steady-state simulations of low-voltage distribution networks with large penetration of DG.
Fur-thermore, this library was used to simulate different penetration levels of electric vehicles (EVs) to evaluate the impact of different scenarios on electricity consumption and network performance. It was found that with uncontrolled charging, voltage violations occurred with EV pene-tration levels as low as 30%. Therefore, optimal load shifting strategies should be developed in order to prevent overloading the distribution network during peak hours. Furthermore, the approach used opens new possibilities for unambiguous modelling and simulation of active distri-bution networks by allowing reuse of model components and sharing of libraries across different simulation platforms.
Sammanfattning
Dagens elnät står inför stora utmaningar: ökad andel distribuerad pro-duktion gör att dagens enkelriktade kraftflöden allt oftare kommer vara dubbelriktat; elmarknaden behöver bli mer flexibel för att svara på för-väntade ökade prisfluktuationer på grund av ökad lokal förnybar elpro-duktion, vilket i sin tur ger nya möjligheter för kunden att spela en mera aktiv roll genom att anpassa sitt konsumtionsmönster till marknadens ökade prisvariationer; slutligen kommer den förväntade elektrifiering av fordon att öka efterfrå gan på el och behovet av en aktiv infrastruktur som kan leverera vid alla tillfällen.
Denna avhandling studerar de två främsta aktörerna som är engage-rade i utvecklingen av allt mera aktiva distributionsnät: aktiva kunder och distribuerad elproduktion. Detta arbete började med att analysera elförbrukningsmönster i ett stort bostadsområ de som ligger i Sollentu-na utanför Stockholm, med en blandad grupp av konsumenter. Konsu-menterna klassificerades i en grupp som är anslutna till fjärrvärmenätet och en andra grupp som har egen värmepump. Elförbrukningsmönst-ret utvärderades på skilt för dessa bå da kundgrupperna. I syfte att fastställa strategier som kan öka konsumenternas förbrukningsflexibili-tet, har kontrakt tillgängliga på den svenska elmarknaden undersökts. De elkontraktens olika prissättningssystemen utvärderades, med fokus på realtidsprissättning, för att fastställa de ekonomiska konsekvenserna för konsumenterna frå n de bå da undersökta grupperna. Det konsta-terades att realtidsprissättning erbjuder ekonomiska fördelar för bå da grupperna, särskilt för de konsumtenter som använder värmepumpar.
För att analysera den roll som distribuerad elproduktion har i ak-tiva distributionsnät, har ett modell-bibliotek utvecklats med hjälp av det objektorienterade och öppna källkodssprå ket Modelica. Modeller-na används för att utföra jämvikts (steady-state) simuleringar av låg-spänningsdistributionsnät med stor andel av distribuerad elproduktion. Därtill har modellerna använts för att simulera olika penetrationsnivå er av elfordon, för att utvärdera effekterna av olika scenarier på
elför-brukning och distributionsnätets stabilitets. Resultatet visar på att med okontrollerad laddning av elfordon inträffar spänningsstörningar redan vid penetrationsnivå er så lå ga som 30 %. Strategier för att flytta en del laster behöver utvecklas för att förhindra överbelastning av distribu-tionsnätet under topplastperioder. Därtill öppnar den använda metoden för nya möjligheter för modellering och simulering av aktiva distribu-tionsnät, genom å teranvändning av modell-komponenter och delning av modell-bibliotek mellan olika simuleringsplattformar.
List of Papers
Publications Included in the Thesis
I J. Campillo, E. Dahlquist, F. Wallin, I. Vassileva. (2016). Real-Time Electricity Pricing in Sweden: is it economically viable for users without demand-side management? Energy Journal
DOI:10.1016/j.energy.2016.04.105
II J. Campillo, I. Vassileva, E. Dahlquist, and L. Lundstrm. (2016). Beyond the Building Understanding Building Renovations in Rela-tion to Urban Energy Systems. Journal of Settlements and Spatial Planning, vol. 2016, pp. 3139, DOI:10.19188/04JSSPSI052016 III J. Campillo, F. Wallin, I. Vassileva, and E. Dahlquist.(2012).
Elec-tricity demand impact from increased use of ground sourced heat pumps. in 2012 3rd IEEE PES Innovative Smart Grid Technologies Europe (ISGT Europe), 2012, pp. 17.
DOI:10.1109/ISGTEurope.2012.6465876
IV I. Vassileva, J. Campillo. (2016). Adoption barriers for Electric Ve-hicles: Experiences from early Adopters in Sweden. Energy Journal. (*Submitted Feb 2016)
V J. Campillo, S. Barberis, A. Traverso, K. Kyprianidis, I. Vassileva (2015). Open-Source Modelling and Simulation of Microgrids and
Active Distribution Networks. In Sustainable Places 2015 (pp.
9199). Sigma Orionis.
VI I. Vassileva, R. Thygesen, J. Campillo and S. Schwede. (2015). From Goals to Action: The Efforts for Increasing Energy Efficiency and Integration of Renewable Sources in Eskilstuna, Sweden. Re-sources 2015, 4, 548-565; DOI:10.3390/reRe-sources4030548
Publications not included in the Thesis
I Vassileva, I., & Campillo, J. (2016). Consumers Perspective on
Full-Scale Adoption of Smart Meters: A Case Study in V ¨aster˚as,
Sweden. Resources, 5(1), 3. DOI:10.3390/resources5010003
II J. Campillo, E. Dahlquist, E. Lindhult and I. Vassileva. (2016). Technology Capacity Assessment for Developing City Action Plans to Increase Energy Efficiency in Mid Sized Cities in Europe. Energy Procedia, 2016.
III I. Vassileva, E. Lindhult, J. Campillo (2016). The Citizen’s Role in Smart City Development. Energy Procedia, 2016.
IV M. Kullman, J. Campillo, E. Dahlquist, C. Fertner, J. Grosse, N. B. Groth, G. Haindlmaier, F. Strohmayer, J. Haselberger (2016). Note : The PLEEC Project Planning for Energy Efficient Cities, Journal of Settlements and Spatial Planning, vol. 2016, no. 8992, p. 3, 2016. DOI:10.19188/09JSSPSI052016
V Qie Sun, Zhanyu Ma, Hailong Li, Chao Wang, Javier Campillo, Fredrik Wallin, J. G. (2015). A Comprehensive Review of Smart Meters in Intelligent Energy Networks. IEEE Internet of Things Journal, 4662 (Special Issue on Large-Scale IoT), 16.
DOI:10.1109/JIOT.2015.2512325
VI J. Campillo, N. Ghaviha, N. Zimmerman and E. Dahlquist. (2015). ”Flow batteries use potential in heavy vehicles,” Electrical Systems for Aircraft, Railway, Ship Propulsion and Road Vehicles (ESARS), 2015 International Conference on, Aachen, 2015, pp. 1-6.
DOI:10.1109/ESARS.2015.7101496
VII I. Vassileva and J. Campillo. (2014). Increasing energy efficiency in low-income households through targeting awareness and behavioral change. Renewable Energy, 67, 5963.
DOI:10.1016/j.renene.2013.11.046
VIII I. Vassileva and J. Campillo. (2014). Eskilstuna (Sweden) as an ex-ample of a smart city from an energy efficiency perspective. World Renewable Energy Congress. University of Kingston, London 3-8 August, 2014.
IX J. Campillo, E. Dahlquist and I. Vassileva. (2014). Smart Grid Flexible Modeling and Simulation using Modelica. World
Renew-able Energy Congress. University of Kingston, London 3-8 August, 2014.
X J. Campillo, E. Dahlquist and R. Sp¨ath. (2014). Smart Homes
as Integrated Living Environments. Volume 4 Intelligent Energy Systems. Handbook of Clean Energy Systems. John Wiley and Sons. DOI:10.1002/9781118991978
XI I. Vassileva, F. Wallin, E. Dahlquist and J. Campillo. (2013). En-ergy consumption feedback devices impact evaluation on domestic energy use. Applied Energy, 106, 314320. DOI:
10.1016/j.apenergy.2013.01.059
XII I. Vassileva, J. Campillo, F. Wallin and E. Dahlquist. (2013) Com-paring the characteristics of Different High-Income Households in Order to Improve Energy Awareness Strategies. 5th International Conference on Applied Energy Pretoria, South Africa, 1-4 July, 2013
XIII J. Campillo, F. Wallin, I. Vassileva and E. Dahlquist. (2013). Eco-nomic Impact of Dynamic Electricity Pricing Mechanisms Adoption for Households in Sweden. In World Renewable Energy Congress 2013. Perth, Australia.
XIV I. Vassileva, J. Campillo, E. Dahlquist. (2013). Increasing en-ergy efficiency in low- income Swedish households through targeting awareness and behavior. World Renewable Energy Congress 2013, Murdoch University, Western Australia, 14-18 July, 2013.
XV J. Campillo, D. Torstensson, F. Wallin, I. Vassileva. (2012). Energy Demand Model Design for Forecasting Electricity Consumption and Simulating Demand Response Scenarios in Sweden. July 5-8, 2012, Suzhou, China.
XVI D. Torstensson, F. Wallin, I. Vassileva, J. Campillo. (2012). Large-Scale Energy Intervention Scenarios as a Method Investigating De-mand Response Potentials. July 5-8, 2012, Suzhou, China.
Contents
1 Introduction 1
1.1 Background and motivation . . . 1
1.2 Main Research Question . . . 3
1.3 Research Questions . . . 4
1.4 Structure of the Thesis . . . 4
2 Literature Review 6 2.1 Active Electric Distribution Networks . . . 6
2.1.1 Main Components . . . 7
2.1.2 Topologies . . . 8
2.1.3 Network Operation and Control . . . 9
2.2 Distributed Generation . . . 10
2.2.1 Solar Photovoltaic . . . 10
2.2.2 Micro-gas turbines . . . 11
2.3 Demand side Management . . . 11
2.3.1 Electricity Markets . . . 11
2.3.2 Smart Metering . . . 12
2.3.3 Variable Electricity Pricing . . . 13
2.3.4 Demand side Management Strategies . . . 14
2.3.5 Heat Pumps . . . 14
2.3.6 Electric Vehicles . . . 15
2.4 Mathematical Modelling . . . 16
2.4.1 Modelica Language . . . 16
2.4.2 Power Systems Modelling in Modelica . . . 17
3 Methodology 18 3.1 Demographic and Consumer-related Data . . . 18
3.2 Case Studies . . . 19
3.3 Electricity Consumption & Pricing Data . . . 19
3.5 Data Processing . . . 20
4 Results and Discussion 23 4.1 Electricity Demand . . . 23
4.1.1 Heat Pumps . . . 23
4.1.2 Impact on the Energy Supply System . . . 25
4.2 Opportunities from Electricity RTP . . . 26
4.2.1 Electricity Time of Use (TOU) . . . 28
4.2.2 Annual Analysis . . . 29
4.3 Electric Vehicles Adoption in Sweden . . . 30
4.4 Distributed Generation . . . 32
5 Conclusions 36
List of Figures
1.1 Structure of the thesis . . . 5
2.1 Radial topology . . . 8
2.2 Loop topology . . . 9
2.3 Price formation in the Nordpool Spot Market . . . 13
4.1 Annual electricity consumption for DH-based households and GSHP-based households. . . 24
4.2 Monthly electricity consumption for DH and GSHP-based households . . . 25
4.3 Monthly cost difference between pricing contracts 2001-2007 for customers with District Heating . . . 27
4.4 Monthly cost difference between pricing contracts 2001-2007 for customers with Heat Pumps . . . 27
4.5 Total cost difference between pricing contracts 2001-2007 for DH . . . 29
4.6 Total cost difference between pricing contracts 2001-2007 for HP . . . 30
4.7 Correlation between cost difference with standard devia-tion and annual energy usage . . . 31
4.8 Load increase with different levels of EV penetration . . . 32
4.9 Impact of charge scheduling . . . 33
4.10 Simulated (solid) vs real (dotted) results for a daily profile for the C65 ICHP . . . 34
4.11 Simulated (Solid) vs Real (doted) power (in kW) output from the PV array . . . 34
Abbreviations
AMR Automated Meter Reading
AVR Automated Voltage Regulation
BACS Building Automation and Control Systems
CHP Combined Heat and Power
CVR Conservative Voltage Regulation
DSM Demand-side Management
DER Distributed Energy Resources
DG Distributed Generation
DSO Distribution System Operator
EV Electric Vehicle
ECM Energy Conservation Measures
EMS Energy Management Systems
GHG Green House Gas
GSHP Ground Sourced Heat Pumps
HV High Voltage
IEA International Energy Agency
kWe Kilowatt Electric
kWp Kilowatt Peak
LV Low Voltage
MV Medium Voltage
uGT Micro Gas Turbine
OECD Organization for Economic Co-operation and Development
PHEV Plug-in Hybrid Electric Vehicles
PF Power Factor
RTP Real-Time Pricing
PV Solar Photovoltaic
TOU Time of Use
TSO Transmission System Operator
vRES Variable Renewable Energy Sources
Chapter 1
Introduction
1.1
Background and motivation
Electric power has been described by the National Academy of Engineer-ing as the greatest engineerEngineer-ing achievement of the 20th century, because the use of electricity has changed our societies to the extent that liv-ing without it is almost unthinkable [1]. We need electricity to operate most of our buildings’ subsystems, route our traffic, provide security at night, run our factories, preserve our food and filter our water, among other basic needs. Furthermore, in the last decade, our communications needs and the explosion of Internet-connected mobile devices have in-creased the electricity usage in this sector significantly. If all the server centres required to run existing cloud services were put together, their consumption would rank sixth among all countries [2].
This intertwined relationship creates a direct connection between electricity demand and economic growth. From 1990 to 2013, both global electricity demand and global gross domestic product (GDP) doubled, and so too did coal and gas demand in the power sector, and with that,
the related carbon dioxide (CO2) emissions. In 2013 alone, the power
sector accounted for over 60% of the coal and 40% of gas global demand,
producing 42% of global energy-related CO2 emissions. Consequently,
the power sector plays a critical role, not just in economic growth, but also in global climate change and local air pollution [3].
Furthermore, according to the International Energy Agency,
electric-ity demand and its associated CO2emissions are expected to increase by
more than 70% by 2040 compared to 2013 levels [3]. In order to mitigate this impact, renewable energy has received strong support in a growing number of countries, for instance as governmental incentives, tax
2 Introduction
ductions, feed-in tariffs (FiTs) and changes in the electricity markets, among others.
As a result, renewable power is expected to be the largest contributor of net additions to power capacity over the medium term. As a matter of fact, it experienced its largest growth to date, 130 GW in 2014, and accounted for more than 45% of the net additions to the world’s power capacity [4]. While this trend can help mitigate the environmental im-pact of electricity generation, it does not come without challenges for the system; large penetration of utility-scale variable renewable energy sources (vRES) introduces larger fluctuations on the supply side, and therefore existing prime movers have to ramp up and down their pro-duction capacity, often operating in derated mode at lower efficiencies. This operation can lead to increased operation costs and in general, adds more complexity to the operation and control of the power system [5, 6, 7].
On the consumer side, the reduced cost of solar photovoltaic (PV) combined with local incentives for end users (e.g. FiT) has facilitated the penetration of solar PV in residential and commercial areas, connected to low-voltage distribution networks. In 2014, the global PV installed capacity was 176.2 GWp, and it is expected to reach 429 GWp by 2020 [8]. Slightly over 40% of this corresponds to utility-scale PV while nearly 60% corresponds to residential and commercial installations [4].
While the trend is to increase the share of utility-scale PVs in devel-oping markets, such as Western China, India, the Middle East, Africa and countries in the Americas that are not member of the Organiza-tion for Economic Co-operaOrganiza-tion and Development (OECD), in Europe, development is more likely to focus on residential and commercial in-stallations. For instance, in Germany, the share of utility-scale PV is only about 15%, while the remaining 85% corresponds to residential and commercial rooftop mounted installations connected to Low Volt-age (LV) and Medium VoltVolt-age (MV) distribution networks [9].
These medium and low-voltage distribution networks were originally designed as passive networks to allow power transfer from the transmis-sion network to the end consumer. Distribution networks will contain increasing amounts of distributed generation (DG), which will result in a paradigm shift in the operation of these networks, since the power flow becomes bi-directional and thus active measures such as voltage control using power generation from the PV inverters and automated demand response for increasing self-consumption of PV power during peak hours, among others, should be included [10, 11].
1.2 Main Research Question 3
While all these active systems are not yet in place, in the last few years several countries have started the large scale deployment of digital electric meters with bidirectional communication capabilities or smart
meters in order to measure hourly electricity consumption and transmit
the information back to the distribution system operator (DSO) every day and in some cases, in near real time. These, in combination with deregulated electricity markets have provided electricity customers with high contract flexibility and multiple retailer options. For example, resi-dential customers in Sweden can choose different pricing contracts from approximately 200 different retailers, including, in some cases, real-time pricing contracts, where the cost per kWh is determined by the Nordic spot market price.
This brings new possibilities for customers as an active component of distribution networks. Customers can supply power to the network from rooftop PV systems, but in addition, can adjust their own consumption demand based on the output of the PV system (e.g. to maximize self-consumption of electricity) or according to the electricity market spot price. Moreover, customers can make use of demand side management (DSM) automation equipment, such as smart thermostats connected to the spot price and weather forecasts, for controlling the operation of heating systems.
Furthermore, similar technological advances to those that favoured the development of renewable energy technology have also provided a significant boost for the electrification of transportation. For instance, battery technology has improved while its cost has reduced. Similar ad-vances have occurred in power electronics and electric motor technology. Additionally, primary energy reduction and emission reduction tar-gets have also helped increase the interest in adopting electric vehicles for urban transportation (both private and public). All these new electric vehicles represent itinerant loads that will require a robust and active distributed recharging infrastructure, thus adding extra complexity to the LV distribution network.
1.2
Main Research Question
The main objective of this thesis is to understand the role of the differ-ent actors involved in electric distribution systems, and develop simula-tion models that will enable evaluasimula-tion of different future scenarios that include large penetration of distributed generation, active customers, demand-side management and the inclusion of new itinerant loads in
4 Introduction
the system, (e.g. electric vehicles).
1.3
Research Questions
The research questions studied in the included papers were as follows: 1. What are the main advantages for households from adopting hourly
spot market electricity pricing agreements? (Paper I)
2. Could households benefit from hourly spot market electricity pric-ing agreements without adoptpric-ing demand-side management (DSM) strategies? (Paper I)
3. What are the main impacts on the energy supply system from adopting different energy conservation measures and increasing DG penetration in residential areas? (Paper II)
4. What is the electricity demand impact on detached households in Sweden from using ground-sourced heat pumps? (Paper III) 5. What can be learned from early EV adopters in Sweden, to
de-velop strategies that support the penetration of electric vehicles in other countries and what are the potential impacts on local electric distribution grids from large adoption of EVs? (Paper IV)
6. What are the benefits and challenges from using an equation-based, object-oriented modelling language to model DG compo-nents in LV distribution networks? (Paper V)
7. What are the best strategies to integrate DG and e-mobility to increase urban sustainability in mid-sized cities in Sweden and its implications on the existing distribution infrastructure? (Paper VI)
1.4
Structure of the Thesis
The doctoral thesis is comprised of six scientific papers (papers I-VI). The main topic of the thesis is Active Distribution Networks, which in turn, is divided in two domains: Demand Side Management (DSM) and
Distributed Generation (DG).
Papers I-IV fall in the domain of Demand Side Management (DSM), where the impact on the distribution system was analyzed from the end
1.4 Structure of the Thesis 5
consumer point of view. Two sub-domains were identified: consumer-based DSM and technology-consumer-based DSM, consumer-based on the active motivator for DSM. Papers I and IV correspond to the first subdomain, while papers II and III correspond to the second subdomain.
Papers V and VI correspond to the domain of Distributed
Genera-tion, where the analysis was focused on the interaction between different
energy sources and local distribution networks.
A general diagram showing how the papers are related is presented in Figure 1.1.
Chapter 2
Literature Review
2.1
Active Electric Distribution Networks
The main function of electric distribution networks is to transfer power between the bulk power system and end customers as well as to carry out the required voltage transformations. This section of the power system is also responsible for integrating the power supply from distributed generators and maintaining the voltage levels and power quality within regulatory limits. Consequently, this section of the power system plays the largest role in the power quality perceived by the consumers [12].
More recently, this network has gained a more active role and has be-come responsible for integrating the power production from distributed generators installed across the network. Moreover, further developments are expected, including automated voltage regulation (AVR), extensive use of distributed energy storage devices (e.g. electric vehicle-to-grid concept) and more importantly, bi-directional power flow as shown in Figure 1.1.
The term smart grid has also been used extensively to refer to the evolution of electric distribution networks. While both terms can be used interchangeably, active distribution networks focus on the integration, operation and control of large penetration of DGs and storage in electric distribution networks. The term smart grids is often used to address a larger domain including bulk generation, transmission and the use of advanced monitoring systems (e.g. synchrophasors) for early fault detection that can provide the network with self-healing capabilities to minimize outages.
2.1 Active Electric Distribution Networks 7
2.1.1 Main Components
The main components of an active distribution network are [12]:
• Distribution substations • Primary distribution feeder • Distribution transformers • Distribution cabling
• Metering & Control equipment • Distributed generators
The distribution substation connects the main transmission to the sub-transmission network and converts the HV to MV for use on the primary distribution feeder, where several distribution transformers are connected to convert from MV to LV, suitable for connecting residential and commercial users in the secondary distribution system. This net-work is connected using a combination of four-wire, three-phase over-head and underground cables according to the required topology and operation voltage and current.
All the variables involved in the operation of the distribution system are measured and monitored in multiple locations across the network; all electric variables (e.g. maximum power, voltage and current, etc.) are continuously measured in the substation, and it is becoming more common to extend the monitoring system down to the distribution trans-formers, secondary feeders and end-of-line points in order to facilitate outage detection and monitor the power quality on the entire network at all times. Moreover, changes in metering requirements from electricity market regulations, increased contract flexibility and the reduced cost of micro-controllers and communication technologies have made it possible to deploy automated meter reading (AMR) systems where power and energy usage is measured and recorded at every consumption point in real time.
While the primary purpose of AMR is for billing, several authors have suggested using the additional capabilities of the infrastructure to provide operational data in real time from each consumption point for online diagnostics, outage detection and network management [13, 14, 15].
8 Literature Review
Figure 2.1: Radial topology
2.1.2 Topologies
In secondary distribution networks operating at LV, overhead and under-ground lines connect end consumers with primary MV feeders through distribution transformers, switches, section breakers and other equip-ment, mounted on poles or in distribution cabinets. The most common topologies used in these distribution systems are radial, loop and several combinations of both [12].
Radial Topology: This topology is the simplest and most econom-ical, and is often used in low-density areas (e.g rural distribution net-works). Its main limitation is that in case of failure in any point of the network, all the customers connected to the branch would suffer a power outage. In order to reduce the duration of interruptions, automatic re-closers can be used along the network together with sectionalizing fuses on branches, to allow unaffected sections to remain in service in case of temporary failure. A simple radial topology is shown in figure 2.1. More complex radial feeder models are presented by Kersting et al. [16].
Loop Topology: Loop topologies offer a higher level of service reli-ability, but also require the use of redundant equipment which can make it more expensive to implement. In its most basic form, two feeders form a closed loop, open at one point so that in case of a failure, the section-alizer switch closes in one location while another opens at a different location. This topology offers higher reliability and it is commonly used in urban MV distribution networks and some LV networks in dense res-idential and commercial areas. A diagram of this topology is shown in Figure 2.2.
2.1 Active Electric Distribution Networks 9
Figure 2.2: Loop topology
2.1.3 Network Operation and Control
The distribution system was designed to operate as a perfectly balanced three-phase system. This means that the voltage of each phase is equal in magnitude but 120 degrees out of phase from the others. In reality, unbalanced loads, large penetration of DG, power electronics and other components connected to the network introduce perturbations that re-quire the use of active and passive components to maintain the system operation as close to nominal conditions as possible. When these condi-tions are not met, the reduction in power quality can a↵ect satisfactory operation of the network components (e.g. overheating of transform-ers, faulty tripping, etc.) as well as customers’ equipment (e.g. faulty operation of heat pumps).
Voltage is one of the parameters that has to be controlled and main-tained within a narrow operating range. In Europe and the US, the voltage levels in primary and secondary distribution networks should be
maintained within ± 5% - 10%, based on national regulations [17, 18].
Several voltage control techniques are typically used. For instance, the DSO regulates the primary voltage at the substation and the feeder that connects to the first group of customers, usually by employing tap changers in the transformers that connect the primary and secondary distribution levels. These tap changers can be changed manually (for seasonal load variations) or automatically (using automatic voltage regu-lators, AVRs). Furthermore, if AVRs are not sufficient, shunt capacitors are installed in order to provide the additional reactive power required to maintain the operation voltage within the required limits. Lately, a large penetration of inverters from DG has introduced additional volt-age fluctuations that were not originally accounted for. For instance, in networks designed to control the voltage operation using AVRs, large penetration of DG and the increased demand from electric vehicles (EVs) have forced AVRs to switch hundreds of times per day, instead of just
10 Literature Review
a few times as they were designed for. This has caused some of these systems to reduce their operation lifetime substantially [19].
Consequently, in large distribution networks with large penetration of DG and EVs, AVR and shunt capacitors alone may no longer be suffi-cient to provide the required support to maintain the operation voltage within the required limits. Fortunately, the same equipment that has introduced these perturbances can also help mitigate them. Several au-thors have investigated the potential use of the PV systems inverters’ capabilities to inject reactive power into the system, in order to provide the required support to maintain its operation within the required lim-its [20, 10, 21, 22]. Therefore, new active distribution networks need to use these capabilities to maintain the networks’ reliability, as well as to allow larger DG penetration. On the demand side, new technologies can also provide grid support by controlling their demand according to the network’s operation conditions. On one hand, building automation technologies (e.g. lighting control, smart thermostats, etc.) can adjust their operation in response to weather forecasts, price signals or simply network signals. On the other, EVs can control their charging process, according to the network’s capacity, and in some cases, supply power from the batteries in what is known as vehicle-to-grid (V2G) operation.
2.2
Distributed Generation
Distributed generators (DG) produce energy locally and can use either conventional or renewable energy technologies. Several reasons motivate their wide adoption: DG increases distribution efficiency by reducing the distance and power conversions between production and consumption; it can also help postpone upgrades on the existing grid by increasing the locally available power capacity; but ultimately, the strongest motivator for large DG adoption is their ability to effectively integrate renewable energy technologies, with the environmental advantages they offer, such as the reduction of greenhouse gases (SOx, NOx, CO2), pollution re-duction from large prore-duction plants as well as reduced environmental impact for extraction, refining and transportation of fossil fuels [23].
2.2.1 Solar Photovoltaic
Solar photovoltaic (PV) is a technology that converts light directly into electricity. The individual photovoltaic element is the solar cell, which is made out of semiconductor materials.
2.3 Demand side Management 11
Depending on their power output capacity, solar PV system instal-lations can be classified as utility scale or commercial/residential. The former are characterized by being centralized and offering large power output capacities (>1MWp), and are often connected to the transmis-sion grid at MV or HV. Residential and commercial installations offer smaller power output capacities (<20kWp for residential and <1MWp for commercial) and are scattered, usually located close to the consump-tion loads and directly connected to LV or MV distribuconsump-tion networks.
2.2.2 Micro-gas turbines
Micro-gas turbines are small energy generators usually ranging from 15 to 300 kWe, and are based on the standalone joule cycle [24]. Micro-gas turbines are commonly used as backup generators, with an average fuel to electricity conversion efficiency between 22-30%, although several models can operate in combined heat-and-power (CHP) mode to pro-duce both electricity and heat, increasing the overall efficiency to over 80%. This characteristic makes them very attractive for applications where both electricity and heat are required, for instance in residential neighbourhoods, hospitals, commercial facilities, etc. In general, micro-gas turbines offer several advantages, for instance: high-speed operation, high reliability, low maintenance and low NOx emissions [25].
2.3
Demand side Management
Demand side management usually refers to changes on the consumption side of the network in response to requests from the system’s operator, for instance, to shut off non critical loads during peak power consump-tion times. However, newly introduced flexible pricing contracts offer customers the possibility to voluntarily modify their electricity consump-tion patterns in response to changes in the market by shifting heavy consumption loads to low-cost times.
2.3.1 Electricity Markets
Different power sources have to be dispatched based on demand fluctu-ations in order to maintain the balance between load and supply at all times. Each power source has a different cost structure and runs un-der different operation conditions. The transmission system operators (TSOs) and balance providers decide which power sources to include in
12 Literature Review
the system at any given time based on several parameters: running costs, electricity demand forecast, weather conditions and reservoir capacities. These power production costs are highly variable and thus, effec-tive ways to charge end users for a product that is highly variable in nature, has been debated since the beginning of the electric power in-dustry itself. DSOs defined the optimal pricing regime for this service as Hopkinson’s differentiated rates based on time-of-day use [26] and since then, additional dynamic pricing schemes have been developed. Today, different pricing methods include critical peak pricing (CPP), critical peak rebate (CPR), demand based tariff and real time pricing (RTP) [27, 28, 29, 30, 31].
In Scandinavia, the electricity market was deregulated on January 1 1996, meaning that both electricity production and retail have been sub-ject to competition since the reform. The wholesale price of electricity is determined by supply and demand on an hourly basis on NordPool’s spot market (Elspot) for the next 24 hour period. Due to physical trans-mission restrictions between countries, the Nordic electricity market is divided into bidding areas (Elspot areas) [32]. The network operation still remains as a regulated monopoly in Sweden. The distribution net-works are operated by about 160 different distribution system opera-tors and the transmission network is governed and operated by Svenska
Kraftn¨at, the Swedish TSO.
For each hour of the following day, the players in the spot market specify the amount of electricity they wish to sell or buy. All the bids are aggregated both as price and quantities and the demand curve is built from the sum of all purchase bids. The combination of price and quantities where supply and demand curves match establish the market price as shown in Figure 2.3 [32].
NordPool Spot’s market share of all the electricity traded in the Nordic and Baltic area in 2014 was 501 TWh [33], the largest part of all the electricity produced and consumed in the area. In Sweden, the total electricity produced in 2014 was 149.5 TWh, with a net export of 10 TWh, leaving a total of 139.5 TWh of electricity for domestic use [34]. Almost all electricity generated and consumed in Sweden was traded through NordPool Spot.
2.3.2 Smart Metering
Smart meters are electronic devices that measure and record electricity consumption mainly for billing purposes. Most modern smart meters of-fer two-way communication capabilities to send electricity consumption
2.3 Demand side Management 13
Figure 2.3: Price formation in the Nordpool Spot Market
and production (e.g with installed PV systems) information back to the DSO, as well as additional parameters (e.g. power quality, alarms, etc.) that can be used for advanced network monitoring.
2.3.3 Variable Electricity Pricing
Variable pricing schemes are implemented to encourage users to shift power consumption from peak use to lower use times, in order to help balance the load in the power system. This is accomplished by applying dynamic pricing mechanisms that are closer to the real cost of electricity supply. The most common methods are: monthly variable pricing, where the cost per kWh is based on the electricity spot market average price for the month; Time-of-Use (TOU), where two or more tariffs are used for high peak and low peak times; Critical Peak Pricing (CPP), where a flat rate is used unless there is a high peak critical situation when a very high price per kWh is applied; Critical Peak Rebate (CPR), where users are paid to lower their consumption under critical peak times; and Real Time Pricing (RTP), where an hourly spot market price is applied. One of the main advantages for residential users of a deregulated market together with smart metering technology is the contract flexi-bility and options provided by electricity retailers [35]. Residential
cus-14 Literature Review
tomers in Sweden can choose different pricing contracts from approx-imately 200 different suppliers. The most common types of contracts chosen by the customers are: variable pricing contract, where the cost per kWh is based on NordPool Spot’s monthly average spot price plus a retailer fee; fixed price contract, where the user pays a predetermined electricity price agreed between the retailer and the customer which re-mains fixed for the duration of the contract (1, 2 and 3 years); default contract, which is selected by the local network owner if the customer does not make an active choice; hourly RTP, where the cost per kWh is determined by the spot market price; other contracts options include demand based pricing options and mixed rates (e.g 50% fixed, 50% vari-able) [36].
2.3.4 Demand side Management Strategies
Examples of DSM strategies include: conservative voltage regulation (CVR), where the operation voltage in secondary distribution networks is reduced to minimize losses and the energy demand in the system; smart appliance controllers that react to electricity market prices and only operate during low-price hours; and the use of building automation and control systems (BACS), due to their great potential to adjust the buildings’ power consumption in real time.
BACS apply the principles of linear control theory to monitor and efficiently control the equipment that interacts with the multiple sub-systems involved in building operations. Modern BACS make strong use of communication technologies, and more recently, use wireless sen-sors that provide real time variable monitoring, which combined with real time electricity price information and energy management systems (EMS), provide great opportunities for optimizing the buildings’ energy usage in real time.
Other demand side management strategies include the use of smart thermostats for the operation of heating systems; residential EMS; con-trolled charging mechanisms for EVs and the participation of active electricity customers with great awareness and knowledge about the im-pact of their activities on energy consumption to react and make demand changes when required.
2.3.5 Heat Pumps
Heat pumps transfer heat from a low temperature source to a high tem-perature source by heating and compressing a refrigerant with a low
2.3 Demand side Management 15
temperature boiling point. The heat from the refrigerant is transferred to the heat sink using a heat exchanger where the refrigerant is con-densed back to liquid form.
A particular type of heat pumps is the ground sourced heat pump (GSHP), which can achieve a 1:3 electricity to heat conversion ratio [37]. This means that from 1 unit of electricity it is possible to obtain 3 units of heat. Consequently, its growth facilitates the reduction not only of fossil based heating, but also direct electric heating, increasing the overall electricity to heat conversion.
In Sweden, installations of GSHP have been steadily increasing over several years, up to the point that the country boasts the largest number of GSHPs installed in Europe.
2.3.6 Electric Vehicles
In conventional vehicles, fuels with very high energy density (mainly hy-drocarbons) are stored in a tank and burned in an internal combustion engine to produce the required power to provide the vehicle’s propulsion. In an electric vehicle, an electric motor is used to provide the required propulsion, and takes the required energy from an onboard electrochem-ical or electrostatic energy storage device [38].
Typically, the term EV is used indistinctly to refer to plug-in hy-brid electric vehicles (PHEV), extended range battery electric vehicles, battery electric vehicles and hybrid electric vehicles.
The two major battery technologies used in electric vehicles today are metal hydride (NiMH) and Li-ion. Most PHEV available in the market have used NiMH because it is a more mature technology. However, thanks to the higher specific energy and energy density, the adoption of Li-ion technology is increasing in all EV types [39].
The battery capacity determines a vehicle’s driving range: a large battery provides a long range at the expense of lower overall efficiency (due to the increased weight) and a higher capital cost. Conversely, a small battery may not increase the vehicle’s weight significantly, but if it does not provide the required range, it may not be worth the extra cost and weight of the electric motors and power electronics.
The increased number of EVs can severely affect existing electricity consumption profiles by increasing the evening peak which, according to a survey carried out among private EV owners in Sweden, is when customers are most likely to charge their vehicles. Masum et al [40] investigated this consumption peak increase on a 1200 node test system topology and found out that voltage violations would occur during the
16 Literature Review
night peak with EV penetrations as low as 17%. Furthermore, a sim-ulated EV penetration of 62% (the maximum penetration simsim-ulated) would increase total distribution losses by 500%.
Most EVs currently on the market use batteries with capacities that vary between 12 and 24 kWh, which provides an average driving range of about 160 km [41]. In Europe, however, the average EV owner drives a considerable shorter distance daily [42]. Furthermore, common driv-ing patterns show that most private EVs spent the majority of the time parked, thus opening new possibilities for vehicle-to-grid (V2G) inte-gration schemes. A large distributed energy storage network can allow larger penetration of DGs without the need for additional upgrades of the distribution network’s capacity since excess power could be stored in the vehicle’s batteries to be used at peak time.
2.4
Mathematical Modelling
Mathematical modelling allows us to represent the behaviour of a phys-ical system with a set of equations, so that a specific set of experiments can be simulated on a virtual system rather than on a real one.
There are several reasons to perform simulations instead of carrying out experiments on real systems. For instance, it can be too expensive or too dangerous (e.g. testing different operation conditions on a nuclear power plant); the system that we want to conduct experiments on may not yet exist (e.g. a new blade design for a wind turbine); the time scale of the system is not compatible with that of the experimenter (e.g. celestial objects trajectory analysis); and more freedom to manipulate the variables of the model, among others.
2.4.1 Modelica Language
Developed in 1996, Modelica is an non-proprietary, open source, object-oriented language for modelling large, complex, and heterogeneous phys-ical systems. The language uses mathematphys-ical equations and object-oriented constructs to facilitate the reuse of models, which allows effec-tive library development and model exchanges [43].
Unlike specialized simulation tools, the Modelica language is suited for multi-domain modelling such as complex systems that involve me-chanical, hydraulic, electric, state machines, process control etc. Such systems can be built together into a single model by using the appro-priate algebraic equations that represent the physical behaviour of each subsystem.
2.4 Mathematical Modelling 17
Modelica is based on equations instead of assignment statements, which means that it allows for acausal modelling, because equations do not define a specific data flow direction and the global equation system is solved simultaneously.
2.4.2 Power Systems Modelling in Modelica
In Modelica, models are mathematically described by differential, alge-braic and discrete equations. Variables do not need to be solved manu-ally and unlike modelling and simulation languages that use sequential solving, Modelica allows simultaneous equation solving of large, complex equation systems. This ability facilitates the process of prototyping and testing models.
This approach allows easily reusing models, since each model is de-fined as a set of equations. When connected together with other mod-els, Modelica’s compiler puts all the equations together, extracts the unknown variables and known parameters, and optimizes the simulta-neous solving process automatically.
Moreover, Modelica’s open source standard library contains about 1280 model components and 910 functions from multiple domains, to provide a set of models that help develop larger and more complex phys-ical systems [44].
The complexity of power systems and their associated dynamics re-quire the use of robust modelling and simulation tools. Several ap-proaches have been used in the past, from using simplified numerical methods to complex specialized transient analysis software packages that use proprietary code. This approach has led to inconsistencies between different simulation and modelling methods from different platforms. Equation-based languages allow for model exchange and unambiguous modelling and simulation across different platforms [45]. Moreover, by representing models with their equivalent mathematical equations, it becomes easier to understand the systems’ dynamics, to modify and reuse models, and build more complex systems on a common standard modelling language.
Chapter 3
Methodology
3.1
Demographic and Consumer-related Data
A survey was sent out in a residential area of the Sollentuna munici-pality in Sweden. The questionnaire was sent out to 735 households and comprised of 37 questions regarding housing and energy consump-tion characteristics. A total of 528 households responded, from which a group of 322 (response rate of 43%) was selected, made up of households with GSHP installed at least four years before the survey. The infor-mation from the survey was tabulated and analyzed in order to classify households and extract characteristics as well as to find patterns. This information is presented in papers I and III.
In paper IV, a paper survey was developed and sent out to electric vehicle owners registered as private users in Sweden. A total of 399 surveys were sent out in March 2015, and after a period of 3 weeks, 247 responses had been received, a response rate of 62%. The survey contained several questions with free text answers (e.g. average income) although the majority of the questions consisted of multiple-choice an-swers. The questions included in the survey could be divided into four different groups. The first group comprised of questions regarding the drivers personal and household characteristics; the second group of ques-tions targeted the EV drivers motivation and use of their electric vehicle; the third group of question was intended to gather information on EV drivers driving and charging patterns; the last group targeted informa-tion about the technical specificainforma-tions of the EVs.
3.2 Case Studies 19
3.2
Case Studies
In paper II, five case studies were carried out in which different energy conservation measures (ECMs) were implemented in building renova-tions in Sweden. These cases were selected based on the data available for the projects, technologies used, ECMs impact on the energy supply network and the populations in the cities where the projects were carried out.
In paper VI, the energy goals and actions established by the munici-pality of Eskilstuna in Sweden were evaluated, with special focus on the use and integration of renewable energy sources (mainly wind and PV), transport and the building sector. The evaluation used data provided by the local municipality and was complemented with simulation models.
3.3
Electricity Consumption & Pricing Data
The electricity consumption data between 2001 and 2007 used in pa-pers I and III was obtained from the local distribution system operator (DSO), who provided access to the automatic meter reading (AMR) data from the Sollentuna area. For each customer and measurement, each row in the dataset contained the meter identification (ID), time stamp (YY:MM:DD HH:MM) and hourly electricity consumption value (in kWh). Additionally, information about the main energy source used for heating was also provided for each user ID. There were two main user groups: those connected to the district heating (DH) network and those that used ground sourced heat pumps (GSHP) as their main heating source.
Spot-based electricity price data for real time pricing (RTP) con-tracts cost calculation was obtained directly from NordPool’s database for Elspot’s prices of the physical market area. Hourly electricity values for the 4 bidding areas in Sweden were available at 1 hour intervals.
Fixed electricity prices of one year contracts for each customer group type (DH or with GSHP) were obtained from Statistics Sweden (SCB) [46].
3.4
Modelling & Simulation
In paper V, two models were developed using the Modelica language for two generators of the Savona’s Polygeneration Microgrid (SPM) labora-tory from the University of Genoa in Italy. The first generator was a 65
20 Methodology
kWe integrated combined heat and power (ICHP) natural gas microtur-bine, and the second was a 49 kWp roof-mounted PV system.
The first model was developed in a top-down scheme using the man-ufacturers data to build the equation system. From the basic equation system, different performance derating curves were added from the man-ufacturer’s data [47] in order to determine the microturbines maximum performance under different operation conditions (outdoor temperature, humidity, altitude, etc.). The second model used the equivalent electric circuit model proposed by Sera and Teodorescu [48] for a photovoltaic cell. The hourly solar irradiance required in the model was composed of the main, diffuse and ground-reflected beams; the main beam was calculated from the equation models proposed by Mehleri et al. [49] and neither the diffuse nor ground-reflected beams were included.
The validation dataset for the ICHP consisted of 3997 1 min reso-lution operation data points. The validation dataset for the PV sys-tem consisted of 8865 operation data points at the same resolution. Both were taken from the SPM’s energy management system SCADA. Weather data was obtained from the nearest weather station to the campus, located 15 kilometers north-west of Savona, where the SPM was located.
In paper IV, the survey information was used in combination with a simulation model developed in Dymola using Modelica language to esti-mate the impact of larger adoption of EVs on local distribution networks. The mathematical equations used to build the EV battery model and charging mechanism were obtained from the battery models presented in [39, 50, 51, 52].
3.5
Data Processing
In papers I and III, the hourly electricity consumption entries were for-matted into MATLAB time series for processing and any missing values were linearly interpolated. Each user’s time series was adjusted for day-light saving time (DST) for each year and all data entries were indexed using a common time vector. This vector was formatted in a serial data format that represents, in a single number, the amount of time that has passed since 01/01/0000 to facilitate the data compilation for all customers into a single matrix.
To calculate each individual customer’s electricity costs in the case of a fixed price contract, the fixed cost was determined by the annual electricity usage, therefore, customers with GSHP had lower cost per
3.5 Data Processing 21
kWh. In the case of RTP, electricity costs were calculated by multiplying the hourly electricity consumption matrix and the spot price matrix to obtain a new matrix representing the hourly costs. Monthly and annual electricity costs were calculated from the hourly costs matrix. The hourly electricity price was the same for every customer, regardless of whether the customer used electric heating or they were connected to the district heating network.
In addition to the electricity supply cost, the network charge, retailer fee, electricity tax and VAT were added and calculated monthly for every customer during the studied time period.
The network charge depends on the customer’s fuse size and peak demand. Therefore, this charge was calculated by estimating the fuse size from the historical peak power consumed over the 7 year period, extracting the maximum current at an average power factor of 0.85. This is explained in more detail in paper I.
While the retailer fee for fixed price contracts was included in the cost per kWh, the fee for RTP contracts was obtained from the ten companies in Sweden that offered this service as of March 11th 2014 and added to the calculation of the cost per kWh.
Electricity tax for the seven year studied period was obtained from Svensk Energy [53] and VAT of 25% was added to the total for each customer.
The general equations used for both fixed and RTP contracts are shown in equations 3.1 and 3.2.
ElcostF ixed= (EkW h∗ (N + T )) ∗ (1 + V AT ) (3.1)
ElcostRT P = (EhkW h∗ RT P + EkW h∗ N + Rf) ∗ (1 + V AT ) (3.2) Where:
ElcostF ixed = Monthly electricity cost in SEK
ElcostRT P = Monthly electricity cost in SEK
EkW h = Monthly electricity consumption in kW h
EhkW h = Hourly electricity consumption vector in kW h
RT P = RTP vector in SEK/kW h for every hour of the month
Rf = Monthly retailer fee
N = Network tariff in SEK/kW h
T = Fixed fee tariff in SEK/kW h incl. the retailer fee
22 Methodology
The datasets used for validating both generator models used in paper V had its timestamps synchronized with the weather data samples in order to simulate all components with the same time steps. Additionally, each atasets was formatted in a 2-dimension table (timestamp, data) to be imported and used in Modelica.
Chapter 4
Results and Discussion
4.1
Electricity Demand
4.1.1 Heat Pumps
The results presented in paper III show that the majority of households had their own heating system (e.g. not connected to the district heating network) before the GSHP installation. Only 10% of the respondents had heat pumps before the year of installation (23 households had GSHP while 9 had air-air heat pumps). During the period when the question-naire was sent, 320 households had GSHP installed while 12 had air-air heat pumps.
Cost Analysis
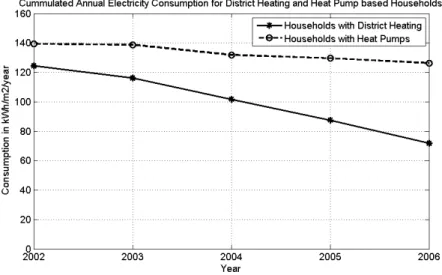
The average investment made by the homeowners was 120150 SEK (13000 EUR) (N=208) for a new GSHP system. When comparing the operation costs between DH and GSHP, the former are more expensive to run during March and April, while the latter are more expensive to run between October and February. While this makes GSHP a better al-ternative in a one year analysis, GSHPs have a limited lifetime while DH does not require new investments, which would make it more economical in the long run unless electricity prices are low and smart thermostats are used to operate the GSHP to reduce its operation costs even further. The average annual electricity consumption for households with DH and GSHP during the studied period are shown in Figure 4.1.
Results revealed that the minimum additional electricity consump-tion for GSHP-based households was 11.9% in 2002, and the maximum additional electricity consumption was 76.5% in 2006, when the highest
24 Results and Discussion
Figure 4.1: Annual electricity consumption for DH-based households and GSHP-based households.
number of continuous sub-zero temperature days of the 5 year study period also took place.
Additionally, it was found that the annual consumption for GSHP-based households was more stable over the 5 year period with an average
of 133.2 kWh/m2/year. Households using DH experienced a continuous
decrease in electricity consumption from 124.4 kWh/m2/year in 2002
to 71.76 kWh/m2/year in 2006, a reduction of almost 43% due to
in-vestments in energy efficient lighting and appliances, according to the answers in the questionnaire.
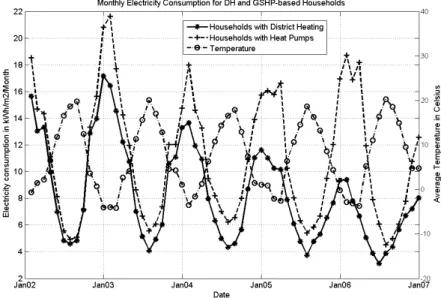
The monthly electricity consumption was compared between DH-based and GSHP-DH-based households over the 5 year period. Results are shown in Figure 4.2.
The monthly analysis provided more detailed information about the temperature impact on households with GSHP compared to those with DH. The difference in electricity consumption between DH and GSHP based households was very small during the Spring and Autumn months, when nearly no heating or cooling is required. However the difference was larger during the other seasons, particularly during Winter.
The Winter of 2003 had the lowest average temperature of the 5 years analysed, and therefore had the greatest impact on the electricity use of GSHP based households. In contrast, the winter of 2005 was the warmest and consequently, the electricity use was lowest.
4.1 Electricity Demand 25
Figure 4.2: Monthly electricity consumption for DH and GSHP-based households
An interesting case occurred during the winter of 2006. Although the temperatures recorded were not the lowest, the average temperature was exceptionally low from December 2005 to February 2006. This resulted in high electricity use from households with GSHP over a longer period of time. Although the spike was not as high as the one experienced in 2003, it caused a higher overall electricity consumption for the whole season. The summer of 2006 was the warmest summer, and therefore electricity use was the lowest, balancing the overall annual consumption. It was observed that even a slight change in the average temperature during the cold months could cause a dramatic change in the energy use, especially with continuous sub-zero temperature days, when GSHP operation efficiency is lowest.
4.1.2 Impact on the Energy Supply System
In paper II, the adoption of different energy conservation measures (ECMs) as well as DG penetration were evaluated from different case study reports in order to analyze the impacts not only on the buildings where these measures and DG were adopted, but also on the energy supply network.
26 Results and Discussion
showed that when residual biomass fuels (e.g. waste) are used in the DH system, reducing electricity consumption and improving the buildings’ envelopes are the only favourable ECMs for improving primary energy efficiency and reducing GHGs.
The second case report studied installing rooftop PV systems on buildings combined with energy storage systems. The results indicated that using electric storage systems provided the highest level of PV self-consumption, but also offered the highest levelized cost of electricity; while using heat storage provided similar self-consumption levels with almost half of the levelized cost of electricity.
The third case evaluated a renovation project carried out in Allings˚as,
Sweden, where 16 buildings were renovated using different ECMs to bring them to near-zero passive building standards. The investment costs varied between 133-570 /m2 and the calculated energy consump-tion savings ranged between 62-85%.
The fourth case study report presented consumer driven ECMs. Re-sults showed that it is possible to reduce energy consumption by up to 33%. However, whether the savings would remain without periodic follow-up from energy efficiency advisors is uncertain.
The fifth case study report considered electricity usage in households with GSHP and variable-pricing electricity contracts. It concluded that while GSHP is the best option for detached households, it is impor-tant to consider electricity price fluctuations during the Winter season when GSHP requires the highest amount of electricity. The adoption of smart thermostats or energy management systems (EMS) was therefore recommended.
In general, results from the case studies showed the importance of considering the characteristics of existing energy supply networks around the buildings where ECMs are adopted, in order to select the strategies that provide the greatest benefits both for the buildings and the energy supply system.
4.2
Opportunities from Electricity RTP
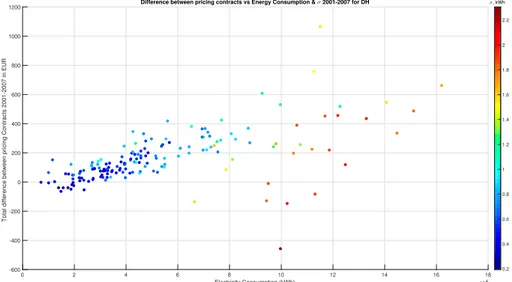
In paper I, the impact on electricity bills after switching from a fixed price per kWh contract to RTP was studied for 400 households (200 connected to the DH network and 200 with HP).
Results for the 7 year period analysis are shown in Figure 4.3 for users connected to the DH network and in Figure 4.4 for users with HP, together with the monthly average temperature. In the figures, the
4.2 Opportunities from Electricity RTP 27 10 20 30 40 50 60 70 80 Months 2001-2007 -300 -250 -200 -150 -100 -50 0 50 100
Cost Difference Fixed vs Spot Contract [EUR/Month]
Monthly Comparison for Fixed vs Spot Based Contracts for DH Users 2001-2007
0 5 10 15 20
Monthly average temperature [Celsius]
Figure 4.3: Monthly cost difference between pricing contracts 2001-2007 for customers with District Heating
10 20 30 40 50 60 70 80 Months 2001-2007 -350 -300 -250 -200 -150 -100 -50 0 50 100 150
Cost Difference Fixed vs Spot Contract [EUR/Month]
Monthly Comparison for Fixed vs Spot Based Contracts for HP Users 2001-2007
0 5 10 15 20
Monthly average temperature [Celsius]
Figure 4.4: Monthly cost difference between pricing contracts 2001-2007 for customers with Heat Pumps
plots show a positive value for each month when RTP contract offers a lower price. A negative value is shown when the RTP contract is more expensive.
While both figures follow the same trend, customers with HP experi-enced larger fluctuations, on both the positive y-axis (more economical