http://www.diva-portal.org
Postprint
This is the accepted version of a paper published in Social Psychology and Personality Science. This paper has been peer-reviewed but does not include the final publisher proof-corrections or journal pagination.
Citation for the original published paper (version of record): Eriksson, K., Funcke, A. (2014)
Humble Self-Enhancement: Religiosity and the Better-Than-Average Effect. Social Psychology and Personality Science, 5(1): 76-83
http://dx.doi.org/10.1177/1948550613484179
Access to the published version may require subscription. N.B. When citing this work, cite the original published paper.
Permanent link to this version:
Humble self-enhancement:
Religiosity and the better-than-average effect
Kimmo Eriksson, Stockholm University, Stockholm, Sweden, and Mälardalen University, Västerås, Sweden
Alexander Funcke, Stockholm University, Stockholm, Sweden, and Mälardalen University, Västerås, Sweden
Abstract:
Prior research has linked religiosity to certain forms of self-enhancement. We extend this literature by three studies linking religiosity to the well-established better-than-average effect. First, a reanalysis of self-judgments of desirable characteristics in 15 nations showed that the better-than-average effect was stronger in more religious countries, even taking into account GDP, interdependence, and economic inequality. Second, in two online surveys totaling 1000 Americans, the better-than-average effect was stronger among more religious individuals. Several observations indicated that this relation was due to individuals self-stereotyping with respect to their religious ingroups. In particular, the relation was restricted to characteristics on the warmth dimension, consistent with the religious stereotype, and the average religious ingroup member tended to be judged even more favorably than self. The latter phenomenon, which we term “humble self-enhancement”, is consistent with other studies linking stronger religiosity to greater favoritism of the religious ingroup and greater derogation of religious outgroups.
Article text: Introduction
Most people tend to describe themselves as above average on desirable characteristics, often referred to as the "better-than-average effect" (Alicke et al., 1995; Alicke & Govorun, 2005). To describe oneself as better than others indicates a lack of humility, which is a virtue in
Christianity and several other religious traditions. So does religion make people humbler when comparing themselves to average others? This is the question we shall attempt to answer here.
To the best of our knowledge, the connection between religiosity and the better-than-average has not been studied before. However, there exists an extensive literature on the connection between religiosity and positive self-descriptions. In brief, religious people tend to describe themselves more positively on a number of measures, and it has long been debated whether these self-descriptions are accurate or whether they reflect a tendency among the religious to self-enhance (in the sense of describing themselves as better than a more objective judge would do). Classic proponents of these two alternatives are Allport and Ross (1967) and Batson, Naifeh & Pate (1978), respectively. Modern contributions to this debate have focused on how religious and nonreligious people respond to the Impression Management scale (Paulhus, 1998). This scale asks people whether they never tell a lie, or never cover up a mistake, or never do a number of other socially undesirable things that almost all people would do at some point or another. Meta-analyses of studies from several countries have established that impression management scores consistently tend to be higher among the devoutly religious (Trimble, 1997; Sedikides &
Gebauer, 2010). The debate on how to interpret this finding is still ongoing, but we think there is compelling support for at least some of the effect being due to a tendency among religious
people to enhance their self-descriptions (Burris & Navara, 2002; Sedikides & Gebauer, 2010). A plausible mechanism is that religious individuals are motivated to perceive themselves as exemplary religious group members (Burris & Jackson, 2000). This mechanism is here labeled
religious self-stereotyping as it implies inferring judgments about oneself from the stereotype of
the religious group to which one belongs. Note that the religious self-stereotyping mechanism would not make religious people claim to be particularly good in all respects, but only those in which religious people are stereotypically expected to be good.
The essence of our the above brief review of a large literature can be summarized in one sentence: More religious people tend to make more positive self-judgments than less religious people, and one plausible hypothesis is that religious stereotyping is involved. Because self-stereotyping would affect self-judgments but not judgments of the average member of the general public, the religious self-stereotyping hypothesis should apply just as much to better-than-average judgments. This application of the hypothesis yields several novel predictions.
Prediction 1. The better-than-average effect will be more pronounced among religious people than among non-religious people.
This prediction is expected from religious self-stereotyping for two reasons. First, religious people’s stereotypes about their religious ingroups are likely to be good rather than bad (but particularly good only on characteristics associated with the religious stereotype). Second, more strongly religious people are likely to more strongly base their own identity on their religious
ingroup, and hence show a stronger tendency to self-stereotype (i.e., align their self-judgments to their very positive judgments of the religious ingroup).
Prediction 2. The moderating effect of religiosity will be limited in scope to those desirable characteristics that are part of the religious stereotype. According to a well-established theory in social psychology, stereotypes tend to be organized along two main dimensions – warmth and competence – and the Christian stereotype in the United States is particularly high on the warmth dimension only (Fiske, Cuddy, Glick & Xu, 2002). Thus, the religious stereotyping hypothesis predicts Christians in the US to exhibit a particularly large better-than-average effect on characteristics of warmth, but not on characteristics of competence.
Prediction 3. When religious people compare themselves to the average member of the same religious group, the religious stereotyping hypothesis predicts that no better-than-average effect will occur. This is because the average member of the same religious group is an exemplar of the
stereotype, and the self-stereotyping mechanism amounts to positive self-judgments being inferred from positive judgments of this exemplar.
Below we report three studies testing these predictions. In Study 1 we reanalyzed a recent dataset on national levels of the better-than-average effect, demonstrating that the effect tends to be stronger in more religious countries (in support of Prediction 1). Study 2 was an online survey to Americans showing that religious people show a stronger better-than-average effect than non-religious people but only on characteristics related to warmth, not competence (in support of
Predictions 1 & 2). Study 3 replicated Study 2 with a larger sample and also demonstrated that religious people’s judgments of the warmth of the average person sharing their religious persuasion are even higher than their self-judgments (in support of Predictions 1, 2 & 3). We discuss these findings in relation to relevant literature.
Study 1
Loughnan et al. (2011) measured the better-than-average effect (BAE) in 15 countries across the world. They used a survey that presented a number of personal characteristics and asked
participants to rate both the desirability of each characteristic and how much they possess it compared to the average person (or, in case of student samples, the average student). For each country sample the tendency to report higher than average possession of culturally desirable characteristics and lower than average possession of culturally undesirable characteristics was estimated, yielding a country measure of BAE. Loughnan et al. then correlated these levels with the countries' Gini coefficients (an often used measure of national levels of income inequality) and found that the better-than-average effect tended to be stronger in more unequal countries. The aim of our first study was to examine whether at the country level, controlling for income inequality and some other potential confounds, the better-than-average effect is correlated with religiosity in this data set.
Method
Estimated country levels of BAE were obtained from Loughnan et al. (2011). Data on religiosity, measured as the country's percentage of adults who say that religion is an important part of their daily lives, were obtained from Gallup World View (2009). Gini coefficients were obtained from
three different sources: the World Bank's Data Catalog (2012); CIA's The World Factbook (2012); and the United Nations Human Development Report (2010), which was used in the original analysis of Loughnan et al. These three sources state somewhat different Gini values. As we were unable to find any research on which to base a choice between the sources, we used the Gini coefficients obtained by the average of the three available values for each country. Data on GDP per capita were taken from the Penn World Tables for 2010. Finally, estimated country levels on the cultural dimension individualism-collectivism were obtained from Hofstede, Hofstede and Minkov (2010).
Results
Religiosity and economic inequality were strongly correlated for these countries, r = .68, consistent with previous comparative research on religiosity and inequality (Solt et al., 2011). The estimated levels of the better-than-average effect in each country correlated strongly with economic inequality, r=.72, confirming the finding of Loughnan et al. (2011). However, the correlation between BAE levels and religiosity was somewhat stronger, r=.78, see Figure 1. We used hierarchical regression to assess the incremental effect of religiosity over income inequality, GDP per capita, and individualism. As shown in Table 1, religiosity had an incremental effect on BAE above and beyond these variables.
[Figure 1 about here] [Table 1 about here]
Reanalysis of the data from Loughnan et al. (2011) confirmed that country estimates of the better-than-average effect tended to be higher in more religious countries. This supports a link between religiosity and above average self-judgments on desirable characteristics (Prediction 1). When religiosity was included in the analysis, the effect of economic inequality on BAE almost disappeared, a finding we briefly return to in the final discussion.
Study 2
The previous study compared the better-than-average effect in countries with varying religiosity. Study 2 focused instead on the difference between individuals of varying religiosity within one single country, the United States. We expected BAE to be larger among religious than
nonreligious Americans. Further, we expected this difference to be restricted to characteristics of warmth.
Participants
We conducted an online survey with 200 participants from the United States (58% female, mean age 37 years). Participants were recruited on the Amazon Mechanical Turk (mturk.com) and received a compensation of one US dollar.
Materials and methods
Following Loughnan et al. (2011), participants rated characteristics on two dimensions. First, the desirability of the characteristic was rated on a 7-point Likert scale with endpoints 1=not at all
desirable and 7=very much desirable. Second, the participant's possession of the characteristic
7=much more than the average person. From a set of those characteristics that had scored highest on desirability in the United States in Loughnan et al.'s study, we used 9 characteristics related to warmth (e.g., forgiving and sociable) and 10 characteristics related to competence (e.g., ambitious and capable).
To assess religiosity we asked the yes-no question used by Gallup World View (2009): Is religion an important part of your daily life? (47% yes, 53% no; henceforth referred to as
religious/nonreligious).
Results
Average desirability of characteristics was generally high (M=5.34, SD=1.09). Average judgments of own possession of these highly desirable characteristics tended to be above the midpoint of 4 (M=4.77, SD=0.89), one-sample t(199)=12.9, p<.001. Thus, a clear better-than-average effect was observed.
Next, average ratings were computed separately for the warmth characteristics and the
competence characteristics. An ANOVA with dimension (warmth or competence) as a within-subjects factor and religiosity as a between-within-subjects factor yielded no main effect of dimension, F(1,197)=.32, p=.57, a main effect of religiosity, F(2,197)=3.35, p=.037, and a strong interaction of religiosity and dimension, F(2,197)=5.78, p=.004, with self-ratings of warmth, but not of competence, much higher among religious participants. See Figure 2.
Discussion
We found the better-than-average effect to be stronger among religious than among nonreligious Americans (Prediction 1). This effect was driven by religious people judging themselves as particularly high on characteristics of warmth, whereas religious people did not stand out in their self-judgments of competence (Prediction 2). Thus, results were consistent with the religious self-stereotyping hypothesis. The final study explored this hypothesis in more depth, by directly measuring the stereotypes from which self-judgments are inferred according to the hypothesis.
Study 3
The final study largely replicated Study 2 with some minor adjustments: First, the response scale to the religiosity question was extended to four steps (0=not at all, 1=not really, 2=somewhat, 3=very much) to enable examination of whether, even among religious people, stronger
religiosity yields a stronger better-than-average effect. Second, to reduce the number of questions we used only seven characteristics of warmth and seven of competence. Third, the 7-point Likert scale was labeled from -3= much less than the average American to 3= much more than the
average American, so that scores above 0 constitute a better-than-average effect.
The first aim was to replicate the findings of Study 2, including the positive correlation between BAE and religiosity. The second aim of Study 3 was to test more directly whether this
correlation might be explained by religious self-stereotyping. We therefore included a measure of the stereotype of the participant's religious ingroup. Specifically, to follow the paradigm of BAE research, participants rated the average person sharing my religious persuasion in comparison to the average American. The same set of characteristics was rated for all targets.
Henceforth, we shall refer to the self-rating score simply as BAE, and refer to the score for the religious ingroup member as RIBAE (“religious ingroup better-than-average effect”). From the self-stereotyping hypothesis we expect BAE and RIBAE to be strongly correlated with each other, and we expect religiosity to correlate at least as strongly with RIBAE as with BAE.
Finally, we wanted to exclude the possibility that this predicted pattern is caused by
self-anchoring instead of self-stereotyping. Self-self-anchoring is the process where judgments of one’s
ingroup are inferred from one's self-judgments; in other words, inferences go in the opposite direction to stereotyping (Otten, 2005). To distinguish between anchoring and self-stereotyping we also measured the political ingroup stereotype. Specifically, participants rated
the average person sharing my political persuasion on the same characteristics, yielding a third
measure, PIBAE (“political ingroup better-than-average effect”). If self-anchoring is the main process occurring, then both religious and political ingroup stereotypes are inferred from one’s self-image and hence we would expect religiosity’s correlation with BAE to carry over not only to RIBAE but also to PIBAE. In contrast, the self-stereotyping hypothesis assumes that the fundamental correlation is that between religiosity and RIBAE, which through self-stereotyping carries over to BAE but not to PIBAE.
Participants
We conducted an online survey with 800 participants from the United States (51% female, age ranging from 17 to 80 with mean value 33 years). Participants were recruited on the Amazon Mechanical Turk (mturk.com) and received a compensation of one US dollar.
Materials and methods
The questionnaire was divided into three parts, one for each of the targets discussed above. (The order in which parts were presented was varied between subjects; no order effects were
identified.) In each part, respondents rated the target on possession of each of the 14
characteristics. These ratings were averaged for each target, yielding indices for BAE (α=.84), RIBAE (α=.86), and PIBAE (α=.86).
The survey also included other questions, including home state, the abovementioned four-step measure of religiosity, and a question about religious affiliation with 14 response options taken from the Pew Forum classification (religions.pewforum.org).
Results
Ten participants did not complete all fields and were excluded. This left N=790 participants in the analysis.
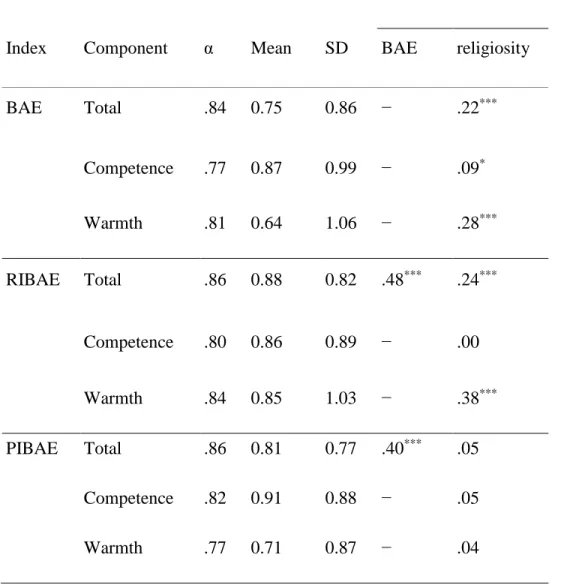
Correlations with religiosity. Descriptive statistics for the three indices (BAE, RIBAE and
PIBAE) and their correlations with religiosity are reported in Table 2. Replicating the finding from Study 2, religiosity was positively correlated with BAE. Note that religiosity correlated also with RIBAE but not with PIBAE. As explained earlier, this is the pattern we expected from religious self-stereotyping.
Testing the religious self-stereotyping hypothesis with hierarchical regressions. Table 3 shows
the results of hierarchical regressions of BAE. The first step shows that the relationship between BAE and religiosity remain after inclusion of college education as a control variable. The second step shows that the main effect of religiosity disappeared when the religious ingroup stereotype (RIBAE) and its interaction with religiosity were included. This finding supports the
interpretation that individual differences in BAE based on religiosity are caused by individuals self-stereotyping to their religious ingroup, with more religious individuals self-stereotyping more strongly.
[Table 3 about here]
Humility when comparing self to ingroup. RIBAE tended to be higher than BAE, paired
t(789)=4.03, p<.001. Thus, participants tended to judge the average person sharing their religious
persuasion even more favorably than themselves.
Separating judgments of warmth and competence. To verify that the warmth and competence
framework applied to all targets judged in this study, we conducted factor analyses of the 14 items for each of the three targets. As expected, these analyses consistently supported two-factor solutions with warmth items loading on one factor and competence items loading on the other factor.1 We then followed Study 2 in computing average scores for warmth and competence characteristics separately, to obtain a warmth component and a competence component of each of the three indices BAE, RIBAE, and PIBAE. Descriptive statistics of warmth and competence components are reported in Table 2.
1 We used principal component analysis with oblimin rotation and a loading threshold of 0.4.
Religiosity affects judgments of warmth more than judgments of competence. In Study 2 we
found that the link between religiosity and the better-than-average effect was strong for
judgments of warmth but not for judgments of competence. This finding was replicated in Study 3. An ANOVA with dimension (warmth or competence) as a within-subjects factor, US region (Northeast, Midwest, South, or West) as a between-subjects factor, and religiosity as a covariate, yielded no effects of US region, but a main effect of dimension, F(1,785)=69.98, p<.001, and a main effect of religiosity, F(1,785)=40.16, p<.001, qualified by the interaction of religiosity and dimension, F(1,785)=17.04, p<.001. Figure 3 illustrates how the warmth component of BAE increased with respondents' religiosity for each step of the religiosity scale; in contrast, the competence component showed almost no relationship with religiosity.
[Figure 3 about here]
Figure 3 also shows how this pattern for self-judgments (BAE) was at least as strong for
judgments of the religious ingroup (RIBAE). Indeed, more religious people tended to give their religious ingroups even higher ratings on warmth than they gave themselves. An ANOVA for the difference between RIBAE and BAE yielded no main effects of dimension or religiosity but a significant interaction, F(1,788)=16.93, p<.001
Discussion
In the introduction we discussed the fact that religious people tend to describe themselves in a more positive light on questionnaires such as the impression management scale. We took this as a starting point to ask whether religious people would also be particularly prone to judge
themselves as better than the average person. We found that, indeed, the better-than-average effect tended to be stronger in more religious countries (Study 1) and stronger among more religious individuals within the United States (Studies 2 and 3).
The latter two studies also attempted to address why religious people tend to score high on the better-than-average effect. One hypothesis that has recently been suggested is that people with self-enhancing personalities tend to become more religious (Sedikides & Gebauer, 2010). Here we have argued for an alternative hypothesis saying that religious people tend to engage in religious self-stereotyping (Burris & Navarra, 2001). If self-stereotyping is the explanation, religious people ought not to self-enhance in general but only in stereotype-relevant domains and only when they compare themselves with people who do not belong to their religious ingroup. This is indeed what we found. In brief, more religious people judged both themselves and their religious ingroups particularly high on warmth, consistent with previous findings about the Christian stereotype in America (Fiske et al., 2002). It is possible that major religions in other countries have different stereotypes, and we would always expect the relation between religiosity and the better-than-average effect to tend to manifest in the domain associated with the local religious stereotype. In this context it may be worth noting that Study 3 included a small number
of Muslims (N=6) and Buddhists (N=22), among whom the data showed a tendency for stronger religiosity to be linked with competence rather than warmth, possibly suggesting different religious stereotypes in these American communities than among American Christians. At any rate, given the findings in this paper we think it would be very interesting if a replication of the cross-cultural study of Loughnan et al. (2011) were to include measures of religiosity and religious stereotypes.
It is also worth noting that we used a quite crude measure of religiosity, a single question previously used to measure country levels of religiosity. Previous work on religiosity and self-enhancement has often used a more sophisticated measure of religious orientation that
distinguishes “intrinsic” religiosity from other orientations. Experimental work on religious self-stereotyping and similar mechanisms has specifically dealt with intrinsic religiosity (Burris & Jackson, 2000; Burris & Navara, 2002). We therefore expect similar findings for a measure of intrinsic religiosity.
Consistent with religious self-stereotyping, we found that religious people did not judge their warmth to be above the average within their religious group. Rather, religious people tended to judge themselves as below the average religious ingroup member. This finding is somewhat remarkable within the literature on the better-than-average effect, in which people tend to judge themselves as better than average even within narrow ingroups such as fellow college students of the same sex (Krizan and Suls, 2008, p. 929). We believe an important difference to these
previous studies lies in the type of ingroup used. The self-selected and value-based nature of religious (and political) group identities makes them different to other group identities (Ellemers,
Kortekaas & Ouwerkerk, 1999; Haidt, 2012; Ysseldyk, Matheson & Hymie, 2010). To see how how a self-selected and value-based nature of the ingroup would make a difference for the better-than-average effect, consider the classic finding of Kruger (1999) that people tend to rate
themselves as below average on difficult tasks. To live up to an ideal is arguably a difficult task. Thus, if people believe that the values they share with their religious ingroup define an ideal that they all strive to live up to, then judging themselves as below the average of the religious ingroup is just what Kruger’s theory would predict. We therefore tentatively believe in the following mechanism behind the self-stereotyping effect: People hold certain values, which are important to them personally. They share these values with certain other people who belong to self-selected groups for which these shared values constitute the basis. They infer both their own
characteristics and the characteristics of other ingroup members from these shared values.
Further, less flattering characteristics of outgroup members may be inferred from the assumption that outgroup members do not share these values. It has previously been noted that “values serve as ideals or oughts and hence as guides for self-regulation” (Caprara et al., 2006). To this we would tentatively add “and as guides for self- and other-perception”. These speculations on the role of values warrant further investigation.
Finally, let us comment on the relationship between economic inequality and religiosity.
Loughnan et al. (2011) found a positive correlation between income inequality and the size of the better-than-average effect in samples from 15 nations. Our results on a link between (Christian) religiosity and favorable self-judgments provide a possible reinterpretation of this finding. Previous research indicates that more egalitarian countries and states tend to become less religious over time (Solt, Habel & Grant, 2011). Thus, it could be through this indirect route via
religiosity that economic inequality is linked to the better-than-average effect. This is consistent with the disappearance of the statistical link between inequality and BAE when we controlled for religiosity in Study 1.
Conclusion
Given that humility is considered to be a religious virtue, one might expect religious individuals to refrain from judging themselves to be better than other people. In this paper we found that religious people indeed tended to be humble when they compared themselves to other people of the same religious persuasion, and more so the more religious they were. Nonetheless, ratings of oneself as better than the average American were more prominent among more religious people. Thus, it seems humility in relation to the religious ingroup is combined with self-enhancement in relation to others. This finding is consistent with recent studies showing that stronger religiosity, both self-reported and experimentally primed, is linked to greater favoritism of the religious ingroup and greater derogation of religious outgroups like atheists or Muslims (Johnson, Rowatt & LaBouff, 2012).
References:
Alicke, M. D., & Govorun, O. (2005). The better-than-average effect. In M.D. Alicke, D.A. Dunning, & Krueger J.I. (Eds.), The Self in Social Judgment, p. 85-106. Psychology Press: NY. Alicke, M. D., Klotz, M. L., Breitenbecher, D. L., Yurak, T. J., & Vredenburg, D. S. (1995). Personal contact, individuation, and the better-than-average effect. Journal of Personality and
Social Psychology, 68, 804-825.
Allport, G. W., & Ross, J. M. (1967). Personal religious orientation and prejudice. Journal of
Personality and Social Psychology, 5, 432-443.
Batson, C. D., Naifeh, S. J., & Pate, S. (1978). Social desirability, religious orientation, and racial prejudice. Journal for the Scientific Study of Religion, 17, 31-41.
Burris, C. T., & Jackson, L. M. (2000). Social identity and the true believer: Responses to threatened self-stereotypes among the intrinsically religious. British Journal of Social
Psychology, 39, 257-278.
Burris, C. T., & Navara, G. S. (2002). Morality play—or playing morality? Intrinsic religious orientation and socially desirable responding. Self and Identity, 1, 67-76.
Caprara, G.V.,Schwartz, S., Capanna, C., Vecchione, M., & Barbaranelli, C. (2006). Personality and politics: Values, traits, and political choice. Political Psychology, 27, 1–28.
Central Intelligence Agency (2012). The World Factbook. Accessed February 3, 2012 at URL:
https://www.cia.gov/library/publications/the-world-factbook/
Ellemers, N., Kortekaas, P., & Ouwerkerk, J. W. (1999). Selfcategorization, commitment to the group, and group self-esteem as related but distinct aspects of social identity. European Journal
Fiske, S.T., Cuddy, A.J.C., Glick, P., & Xu, J. (2002). A model of (often mixed) stereotype content: competence and warmth respectively follow from perceived status and competition.
Journal of Personality and Social Psychology. 82, 878–902
Gallup International. (2009) Gallup WorldView. Accessed February 3, 2012 at URL:
http://www.gallup.com/poll/142727/religiosity-highest-world-poorest-nations.aspx#2
Haidt, J. (2012). The righteous mind: Why good people are divided by politics and religion. London: Allen Lane.
Hofstede, G., Hofstede, G. J., & Minkov, M. (2010). Cultures and organizations: Software of the
mind. Revised and Expanded 3rd Edition. New York: McGraw-Hill.
Johnson, M. K., Rowatt, W. C., & LaBouff, J. P. (2012). Religiosity and prejudice revisited: Ingroup favoritism, outgroup derogation, or both? Psychology of Religion and Spirituality, 4, 154-168.
Krizan, Z., & Suls, J. (2008). Losing sight of oneself in the above-average effect: When egocentrism, focalism, and group diffuseness collide. Journal of Experimental Social
Psychology, 44, 929–942.
Kruger, J. (1999). Lake Woebegon be gone! The “below-average eff ect” and the egocentric nature of comparative ability judgments. Journal of Personality and Social Psychology, 77, 221– 232.
Loughnan, S., Kuppens, P., Allik, J., Balazs, K., de Lemus, S., ..., & Haslam, N. S. (2011). Economic inequality is linked to biased self-perception. Psychological Science, 22, 1254-1258. Otten, S. (2005). The in-group as part of the self: Reconsidering the link between social
categorization, in-group favoritism and the self-concept. In M. D. Alicke, D. Dunning, & J. Krueger (Eds.), The self in social perception (pp. 273-292). Hove, UK: Psychology Press.
Paulhus, D. L. (1998). The Paulhus Deception Scales: BIDR Version 7. Toronto, Ontario, Canada: Multi-Health Systems.
Sedikides, C., & Gebauer, J. (2010). Religiosity as self-enhancement: A meta-analysis of the relation between socially desirable responding and religiosity. Personality and Social
Psychology Review, 14, 17 –36.
Solt, F., Habel, P., & Grant, J.T. (2011). Economic inequality, relative power, and religiosity.
Social Science Quarterly, 92, 447–465.
Trimble, D. E. (1997). The religious orientation scale: Review and meta-analysis of social desirability effects. Educational and Psychological Measurement, 57, 970-986.
United Nations Human Development Programme (2010). Human Development Report 2010. New York, NY.
Wilkinson, R., & Pickett, K. (2010). The spirit level: Why equality is better for everyone. London, England: Penguin.
World Bank (2012). Data Catalog: GINI Index. Accessed February 3, 2012 at URL:
http://data.worldbank.org/indicator/SI.POV.GINI
Ysseldyk, R., Matheson, K., & Hymie, A. (2010). Religiosity as identity: Toward an
understanding of religion from a social identity perspective. Personality and Social Psychology
Tables:
Table 1: Hierarchical linear regressions predicting country levels of self-enhancement bias in Study 1.
Predictor variable Step 1 Step 2
Inequality .63* .22 GDP per capita -.09 -.19 Individualism -.20 -.16 Religiosity − .57* Adjusted R2 .46 .63 R2 change .57* .17* †p<.10; *p<.05
Note: Statistics are standardized regression coefficients. The variance inflation factor of religiosity was 2.0, indicating no problem of collinearity.
Table 2: Study 3 better-than-average judgments on competence and warmth for three targets: self (BAE), religious ingroup (RIBAE), and political ingroup (PIBAE).
Correlation with
Index Component α Mean SD BAE religiosity
BAE Total .84 0.75 0.86 − .22*** Competence .77 0.87 0.99 − .09* Warmth .81 0.64 1.06 − .28*** RIBAE Total .86 0.88 0.82 .48*** .24*** Competence .80 0.86 0.89 − .00 Warmth .84 0.85 1.03 − .38*** PIBAE Total .86 0.81 0.77 .40*** .05 Competence .82 0.91 0.88 − .05 Warmth .77 0.71 0.87 − .04 †p<.10; *p<.05; **p<.01; ***p<.001
Table 3: Hierarchical regressions of BAE. Predictor variable Step 1 Step 2
Religiosity .22*** .01 College .07* .11*** RIBAE − .34*** RIBAE × Religiosity − .20** Adjusted R2 .05 .26 R2 change .05*** .21*** †p<.10; *p<.05; **p<.01; ***p<.001
Note: Statistics are standardized regression coefficients. College is a dummy variable coded 1 for participants with college education, 0 otherwise.
Figure captions:
Figure 1: Estimated levels of the better-than-average effect in 15 countries (Loughnan et al., 2011) plotted against country levels of religiosity (Gallup World View, 2009), with best-fitting regression line.
Figure 2: Better-than-average effects with respect to competence and warmth, for religious and non-religious participants in Study 2. (Error bars signify ± SE.)
Figure 3: Better-than-average effects for self, BAE, and average member of religious ingroup, RIBAE, on judgments of warmth (left) and competence (right), depending on respondents' religiosity. (Error bars signify ± SE.)