Validation of MAP-NET
—A network analysis
tool
Arne Gerdner, Anette Skårner, Stig C. Holmberg and Anita Håkansson
Cogent Psychology (2018), 5: 1553654
CLINICAL PSYCHOLOGY & NEUROPSYCHOLOGY | RESEARCH ARTICLE
Validation of MAP-NET
—A network analysis tool
Arne Gerdner1*, Anette Skårner2, Stig C. Holmberg3and Anita Håkansson3
Abstract: MAP-NET (Measure and Analysis of Personal NETwork) is a computerised
instrument for assessment of the personal networks of persons with substance use
disorders and related problems, with information on individual, relational and
structural levels, designed to give immediate feedback to be used in clinical
inter-views, and to provide relevant measures for research. The study investigates its
validity and reliability, by using a combination of validation strategies including
factor analysis and internal consistency of scales, convergent and predictive
valid-ity, sensitivity to social desirability and agreement with collateral interviews. The
scales demonstrate satisfactory construct validity and acceptable to excellent
internal consistency and convergent and predictive validity with relevant other
scales. There is low sensitivity to social desirability and other bias. There is
sub-stantial agreement with collateral interviews on the most sensitive variables. Thus,
MAP-NET has the qualities needed for clinical use and research.
Subjects: Applied Social Psychology; Addictions and Substance Use; Mental Health/Clinical Social Work; Social Work Research
Keywords: Computerised assessment; personal network; substance use problems; validity; reliability; visualisation; factor analysis; collateral agreement
Arne Gerdner
ABOUT THE AUTHORS
Arne Gerdner is professor of social work at Jönköping University. His clinical research is on substance dependent persons with psychiatric comorbidity and social problems. His epidemio-logical research on adolescents focuses sub-stance use, emotional health, and social relations. His studies on personal social networks relate both to the development of and the reha-bilitation from addiction.
Anette Skårner is associate professor of social work at University of Gothenburg. She conducted several research projects on substance use with an inter-actionist perspective on social networks and social support, drug use and sexuality, young people and drugs, affected family members and the client–counsellor relationship in drug treat-ment.
Stig C. Holmberg is professor emeritus and Anita Håkansson is associate professor emerita, both at the Department of Computer and Systems Science at Mid Sweden University, Östersund. Their research concern design meth-odologies for spatial information systems and tools for management of dynamic information in GIS systems.
PUBLIC INTEREST STATEMENT
Social relations are central resources, yet some-times complicating factors, to handle various life problems, including substance misuse. Social network factors constantly recur as central to explaining initiation, continuation and cessation of substance use and maintenance of long-term recovery. Recovery is often a prolonged and complicated process in which the role of the personal social network (PSN) may vary during different phases. This article focuses on different aspects of the validity of MAP-NET (Measure and Analysis of Personal NETwork), a new compu-terised instrument for assessing the PSN of per-sons with substance misuse and related problems. It is designed to be used in clinical interviews and to provide relevant measures for research. The MAP-NET interview makes it possi-ble to identify propossi-blems and resources both in general and in relation to the specific circum-stances that can be attributed to substance misuse and that may benefit from network interventions in the recovery process.
© 2019 The Author(s). This open access article is distributed under a Creative Commons Attribution (CC-BY) 4.0 license.
Received: 20 August 2018 Accepted: 26 November 2018 First Published: 29 November 2018 *Corresponding author: Arne Gerdner, Department of Social Work, School of Health and Welfare, Jönköping University, P.O. Box 1026, SE-55111 Jönköping, Sweden
E-mail:arne.gerdner@ju.se
Reviewing editor:
Carmen Rodriguez-Blazquez, Instituto de Salud Carlos III, Spain Additional information is available at the end of the article
1. Introduction
MAP-NET (Measure and Analysis of Personal NETwork) is a newly developed and computerised instru-ment for the assessinstru-ment of personal social networks of persons affected by substance misuse and related problems. A personal social network (PSN) is the network around a focal person (FP), and includes relationships (ties) to other persons, called network members (NMs) as well as interrelations between NMs.
The conceptual and theoretical background and design of MAP-NET are presented in Skårner and Gerdner (2018), and its development from a technical perspective is presented in Holmberg and Håkansson (2016). MAP-NET is designed for use in clinical work and research. The patients/clients may, in close cooperation with their counsellors, conduct a thorough exploration of their network and through direct visualisations discover patterns of importance for their rehabilitation preconditions.
Since MAP-NET aims to analyse the impact of a network on problem areas specific to the FP, it needs to capture these problems as well as the network in all its complexity, with information on many levels, e.g. information on NMs, their resources and problems, forms, frequency and intensity of contacts, quality of relations, reciprocity of support exchange, as well as the quality and frequency of contacts between other NMs. It is therefore quite an extensive instrument, built with nine modules divided into four sections: Section A collects data on the FP; Section B defines the members of the PSN; Section C explores the interactional and functional aspects of their relationships to FP; and Section D investigates the social situations of NMs and the interrelations between NMs (see Overview). Overview: Sections and modules of MAP-NET
Section A: Data on FP
Module 1: Basic data on FP Demographics and social background.
Module 2: Problem profile and motivation of FP Problem severity in eight domains (work & finances, psychiatric and physical health, relations, alcohol, drugs, gambling and criminality).
For each problem: change in past 3 years, and motivation to handle it.
Section B: The composition of the PSN
Module 3: Name-generating form of NM Persons of importance in FP’s life, including those who play positive as well as negative roles.
Module 4: Network map Structure and proximity of network relationships.
Module 5: Family and relations tree Specific type of relation, e.g. partner, parent, grand-parent, sibling, child, other relative (same of partner), friend, acquaintance, co-member in support group, colleague, neighbour, various types of professional helper, etc. Section C: Interactional and functional aspects of the PSN
Module 6: Interactional aspects of FP’s relations
For each NM:
Frequency, form and duration of contacts, and geographic distance.
If and how relation depends on FP’s substance misuse. Quality of relation, positive (rich) and negative (problematic). Module 7: Functional aspects of FP’s relations For each NM:
Mutual provision of support (emotional, cognitive, practical & economic).
Impact on various problems (negative or positive). Emotive functions. Sense of belonging.
Links to new positive social contacts. Section D: Data on the NMs and interrelations among and between NMs
Module 8: Basic data on the NMs—their resources and problems
For each NM:
Social situation and resources.
Own problems (alcohol, drugs, physical and emotional health, gambling and criminality).
Active part in FP’s problems. Module 9: Contact map—interrelations
between NMs
For each NM: Contacts with other NMs in the PSN. For each relation: Frequency and quality.
Despite its complexity, the approximate time for conducting a complete interview is about 70 (±15) min. The FP gets immediate feedback throughout the interview with swift screen sum-maries of the interview, and can directly correct faults and misunderstandings (Corman,1990). He or she may also see patterns of the PSN and reflect on those with the interviewer/counsellor. The speediness of feedback, corrections and reflections should make this a powerful instrument, not only for assessment, but also for therapeutic cognitive apprehension. A precondition is, however, that the instrument does not have in-built faults.
To ensure MAP-NET’s content validity, construction of variables based on theory was applied in its development. The theoretical foundations of MAP-NET are presented in Skårner and Gerdner (2018). In addition, variables and scales should demonstrate construct validity and measurement reliability. Scales should demonstrate convergent and predictive validity. Replies to logically related questions should be consistent. The validity of the instrument depends also on the trustworthiness of the replies given by the interviewee. Replies should not be sensitive to prestige bias. When possible, the validity of interview data collected with MAP-NET should be tested as agreement with independent information from another person in the same network. Thus, a complex instrument needs various forms of validation strategies.
The general aim of the study is to present validity and reliability data on the MAP-NET. More specifically, we aim to study the psychometric properties of the scales within MAP-NET, i.e. their construct validity and internal consistency, as well as their convergent validity with measures of similar constructs, and their predictive validity of other constructs known to be related. Internal validity is studied as consistency between related categorical items, when appropriate. We will also study MAP-NET’s susceptibility to various forms of prestige bias, and test whether FPs’ replies can be substantiated by nexus collaterals, i.e. close NMs with good knowledge of the FP and many of his/her relationships.
1.1. Securing the quality of personal network data—previous experiences
Early instruments designed to measure social support or PSNs have questionable validity and reliability. O’Reilly (1988) reviewed 33 instruments measuring social support and social networks and discussed their conceptual definitions as well as their validity and reliability. On a conceptual level, he argues for the need to distinguish between behavioural (support) and structural (network) aspects. Of 24 instruments on social support, few had used systematic methods to establish validity, described, e.g. as discriminate, predictive or convergent validity, and, if so, these indicated modest validity. Nine of the 24 instruments had tested reliability, with varied outcomes. Nine other instruments were designed to measure social networks. Few addressed validity or reliability, and none addressed both. Wasserman and Faust (1994) came to similar conclusions. The validity of these measures is seldom rigorously tested.
More recent research tries to deal with some of these weaknesses. One problem concerns network size, which depends on how the list of persons is generated, i.e. the initial questions asked about who should be included, e.g. persons who are emotionally important but with whom contacts are infrequent; or persons on the periphery of the network, i.e.“weak ties” (Granowetter,
1973), or persons with a predominantly negative influence. Obviously, network size is an important structural factor. NMs are in some analyses weighted according to the strength of ties. Therefore, indications of the strength of ties are important.
Feld and Carter (2002) found, from socio-metric reports, that“expansiveness” is a more com-mon bias than“attractiveness”. Both relate to tendencies to include persons in your network who would not include you in their networks. Expansiveness entails the inclusion of many others, i.e. to overestimate others’ ties to you; while attractiveness is when specific persons are included in many other persons’ networks, i.e. others overestimate their ties to these persons. Feld and Carter proposed ways to deal with these problems in socio-metric studies, but they did not offer solutions relevant to personal network research, where only FPs are interviewed.
One way to deal with these problems is to include minimum criteria of contact frequency for the inclusion of NM. This is implemented in Interview on the Social Network and Social Support (SONET; Laireiter, Baumann, Feichtinger, Reisenzein, & Untner,1997), through specific criteria for different types of contacts (e.g. once a week for colleagues, once a month for acquaintances as well as professional helpers, etc.), or“to be subjectively important”.
If the frequency cut-offs proposed above may seem arbitrary. Another strategy may be to assess contact frequencies to be used as an indicator of the strength of ties. The subjective evaluation of ties is thus another possible indicator of weight. A third possibility is the order in name generation. This was used in Orientation of Social Support (OSS; Alemi et al.,2003). In the Maastrich Social Network Analysis (MSNA; Baars, de B Ruyn, & van den Bergh, 1997), the estimated psychosocial support provided from the NM to the FP is used as a proxy for strength of tie (Ayuku, Odero, Kaplan, De Bruyn, & De Vries, 2003). Thus, we may have at least four possible indicators of “strength of tie”, i.e. contact frequency, subjective estimate, nomination rank order, and provision of social support.
Since expansiveness is a major threat, possible bias may be tested against constructs with a bearing on that, such as social desirability, i.e. a tendency to present oneself in a more positive manner, or in a way one presumes is expected; or gregariousness, i.e. strong extroversion that may make the person over-inclusive, e.g. over-estimating the number of friends.
Computerised versions of assessment instruments are increasingly being developed to save time and money, to guarantee standardisation and to make data more available for research. Compared to paper-and-pen versions, these instruments may be even less affected by interviewer effects, as was found in an assessment of substance misuse (Duffy & Waterton,1984; Skinner & Allen,1983). Since computerised versions provide possibilities of speedy figural feedback on the screen, the responder may better monitor how the network is described as an interpretation of his replies, and he may correct mistakes immediately (Corman,1990).
2. Material and methods 2.1. Analytical strategies
Validation of a complex instrument such as the MAP-NET needs combined validation strategies. These methods are used in the present study, and applied when suitable:
(a) The convergent validity of MAP-NET constructs (e.g. problem severity, motivation for change, network size, availability of intimate relations) can be tested against instruments on similar constructs, while predictive validity can be tested against other instruments intended to measure constructs known to be related.
(b) Prestige bias is when responses are provided to enhance the individual prestige rather than being accurate. This is explored as sensitivity to social desirability and should preferably be low. (c) The risk of expansiveness as a bias concerning network size is explored with correlation to gregariousness and should not be more than moderate. Shame may, on the other hand result in the opposite bias, underestimation of one’s network size.
(d) To ensure the construct validity of index scales, exploratory factor analysis is used to extract the scales (i.e. scales on motivation to handle various problems) and subscales (i.e. on statements of quality of relations).
(e) Reliability of a scale is its ability to measure precisely and is tried as internal consistency, i.e. the mean correlation between all items of a scale.
(f) Internal validity is explored by examining whether individual scales covariate in the expected direction with other constructs within the same instrument (e.g. to examine ties in relation-ships, as described above).
(g) Many items concern information on FP as well as on NMs, and the relationships between these. Inter-rater validity is examined through agreement with responses from a collateral interview with an NM. The collateral was chosen by the FP as having the most knowledge of the others in the network (a nexus person). Focal and collateral persons were blind to each other’s responses.
2.2. Focal and collateral interviews
In total, 113 persons with alcohol and drug problems (mean age 41.8 [s.d. = 11.8]; female gender 33%) volunteered to be interviewed. Of these, 78% reported alcohol problems and 52% drug problems. About two thirds were in residential care (compulsory care unit, detoxification unit, voluntary residential), and about one third were recruited from non-residential support pro-grammes for persons with severe alcohol and drug problems (supported work, policlinic). Most (80%) were living alone, only 20% were employed or self-employed, 57% lacked their own housing, 35% had at most 9 years of education, and 27% reported having criminality problems.
The interviews were carried out by two authors (AG and AS) and by trained interviewers, recruited among staff at the settings. The interviews had a mean length of 2 hh. The length of each interview depends on the FP’s problem profile and the number of NMs. Using the average numbers of five problem areas and 11 NMs, the interview as it was conducted in this study contained 872 questions. If not computerised, those would have taken much longer. Based on this study, the interview was then shortened to 510 questions (>40% less) and would now take about 70 min to complete.
The 113 FPs nominated a total of 1,299 NMs, i.e. 11.5 per FP (mean). The number of relationships (ties) between NMs identified by FPs was 3,574, implying that each NM knew of 2.75 (mean) other NMs.
A subsample of 59 FPs were asked to consent to the researchers approaching a nexus person within their PSN, i.e. an NM who knew many others in that network, and inviting them for collateral interviews. Eight FPs did not consent to collaterals being interviewed, since they “did not want them to be troubled with such”, but for all others a collateral nexus was invited (n = 51) and agreed to participate in telephone interviews. The collateral interviews were shorter than the FP interviews and took about 55 min (mean). Half of the collaterals (49%) were family members of FPs, while others were relatives (10%), friends (15%), neighbours (5%) and professional helpers (21%). They were mostly rated by FPs as“extremely close” (77%). Others were “very close” (8%), “rather close” (10%),“not particularly close” (3%) or “not at all close” (3%).
The collaterals were informed about the purpose of the interview, i.e. to be used for validation of FP interviews. Collaterals and FPs were blind to each other’s replies; therefore, NMs did not even know which others had been nominated by the FPs as NMs. In the 51 PSNs represented in collateral interviews, FPs nominated 531 NMs (i.e. 10.4 mean) and identified 1,617 ties between various NMs (i.e. a mean of three ties per NM).
In the same 51 PSNs, the collateral nominated 284 NMs (i.e. 53% of those nominated by FPs) and identified 499 ties between these NMs. Therefore, collateral data could be used to validate the FP interviews concerning 51 FPs, 256 NMs and 499 relationships between NMs.
The MAP-NET allows the use of fake or nicknames of NM to ensure NMs’ integrity. For this study however, actual first names were used so that names provided in focal and collateral interviews could be matched. The study was approved by the Regional Ethics Vetting Board in Umeå (Dnr 05-046Ö).
2.3. Instruments for assessing convergent and predictive validity
Before the interviews, 101 FPs filled in questionnaires with the following instruments (including two incomplete):
● SS13—Social Support (13 items) is a brief version of The Interview Schedule for Social
Interaction including size of network (social integration) (Undén & Orth Gomér, 1989). Example item:“How many friends do you have who could visit you and feel comfortable?” (None/1–2/3–5/6–10/11–15/More than 15). The scale is normally distributed as tested with one-sample Kolmogorov–Smirnov test (K-S): D(99) = 0.08, p = 0.09.
● MSPSS—The Multidimensional Scale of Perceived Social Support (12 items) measures the
quality of social support (Zimet, Powell, Farley, Werkman, & Berkoff,1990). Example:“There is a special person who is there when I need them” (Nine-grade Likert scale from “Not agree at all” to “Agree completely”). The distribution is not normal, K-S(100) = 0.16, p < 0.001.
● CD—Cynical Distrust (eight items), subscale of the Cook and Medley Hostility Scale, measures
a distrustful attitude to fellow human beings (Greenglass & Julkunen,1989). Example:“People don’t care about their fellow human beings” (Five-grade Likert scale from “Not agree at all” to “Agree completely”). CD is normally distributed, K-S: D(101) = 0.07, p = 0.2.
● HAD—The Hospital Anxiety and Depression scale (14 items) is a screening of anxiety and
depression (Lisspers, Nygren, & Söderman, 1997). Example of anxiety: “I feel afraid, as if something terrible will happen” (Mostly/Often/Sometimes/Not at all). Example of depression: “I can laugh and see things from the humorous side” (As much as I always could/Not as much as before/Not at all as before/Not at all). The distribution is not normal, K-S: D(100) = 0.09, p = 0.03.
● RTCQ—The Readiness to Change Questionnaire (15 items)—measures motivation to change
concerning substance misuse (Forsberg, Ekman, Halldin, & Rönnberg, 2004). It has three subscales: pre-contemplation, contemplation and action, all based on concepts developed by Prochaska and DiClemente (1982). Example of Pre-contemplation: “There is no point in thinking about my drinking, since I have no problem”; example of Contemplation “Sometimes I think that I should quit drinking or drink less”; and example of Action: “I am actually changing my drinking habits right now (either decreasing or quitting)”. (Five-grade Likert scale from “Not agree at all” to “Agree completely”). The distributions of RTCQ and its’ subscales are not normal, K-S D(100) = 0.15–0.19, all ps < 0.001.
● ISS—The Internalised Shame Scale (30 items) measures internalised shame (Cook, 1994;
Rosario & White,2006). Example:“I feel as if I am never good enough” (Five-grade Likert scale from“Never” to “Nearly always”). The distribution is normal, K-S: D(100) = 0.07, p = 0.20.
● MCSDS—The Marlowe-Crowne Social Desirability Scale (33 items) measures tendency to reply
in a socially desirable, and therefore biased, way (Beretvas, Meyers, & Leite,2002; Marlowe & Crowne,1960). Example:“Before I vote, I thoroughly examine the qualifications of all candi-dates” (No/Yes). MCSDS is normally distributed, K-S: D(99) = 0.07, p = 0.20.
● S&G—Shyness vs. Gregariousness,1based on a subscale of the Temperament and Character
Inventory (Cloninger, Przybeck, Svrakic, & Wetzel,1994), but modified for this study (to Likert-type items, using only the four with highest factor loadings). Example:“I am not at all shy when I meet people I don’t know”. (Five-grade Likert scale from “Not agree at all” to “Agree completely”). The distribution is not normal, K-S: D(60) = 0.13, p = 0.009).
2.4. Statistical analysis
The construct validity of scales within MAP-NET is tested with factor analysis. The Kaiser–Meyer– Olkin Measure of Sampling Adequacy (KMO) tests whether the item sampling is fit for factor analysis, with KMO >0.80 indicating satisfactory sampling, and >0.60 being least acceptable. The extraction method used was in most cases Principal Axis Factoring (PAF), since it can handle items with skewed distribution (Costello & Ogborne,2005), or Principal Component Analysis (PCA) when more applicable. The number of factors was decided based on Cattell’s Scree Test. In case of more
than one factor, rotation was used. We chose Promax rotation that can handle moderately correlated factors. Communalities are estimates of the variance accounted for by each item; items’ factor loadings are the correlations between the individual item and the latent factor, and R2is interpreted as the explained variance of that factor. Loadings >0.70 are preferable, but even loadings >0.40 may be used as indicators in combination when strong loadings are hard to obtain. Following the recommendation of Hair, Anderson, Tatam, and Black (1995), we set n > 50 as the lowest number of cases to conduct factor analysis. (For the sake of space, not all factor analyses are shown with complete tables of communalities and loadings per item, but aggregated informa-tion on these is given.) Internal consistency is tested with Cronbach’s Alpha (α) and interpreted as follows: >0.60 is acceptable for group comparisons, >0.70 is satisfactory for individual assessment, and >0.90 is excellent (Kline,2000). Agreement is studied using Cohen’s Kappa (к) for categorical
items, interpreted as proposed by Landis and Koch (1977): 0.21–0.40 is “fair”; 0.41–0.60 is
“mod-erate”, while 0.61–0.80 is “substantial”, and ≥0.81 is “almost perfect”. Symmetric correlations (Gamma, γ) for short rank order items, e.g. Likert scales, are interpreted similarly. Correlation between FP’s and collateral’s reports on the age of NMs is studied with Pearson R, while Spearman Rho is used for all other correlations since they involved rank-ordered scales and non-normal numerical scales. Deviation from normality of scales (D) is tested with the One-sample Kolmogorov–Smirnov test (K-S). D is given with degrees of freedom in parenthesis. Low p-values (p < 0.05) are interpreted that the scale is not normally distributed. All statistical calculations are conducted in SPSS version 25.
3. Results
There was no need for validity analysis on Module 1 (Social and demographic background of FP). According to the interviewers recruited among unit staff members with good knowledge of their interviewees, FPs’ replies were consistent with what was known.
3.1. Module 2—FPs’ problem severity, change and motivation in eight areas
Module 2 concerns severity in eight problem areas: Work and finances, physical health, psycholo-gical health, relations, alcohol, drugs, gambling, and criminality. These are categorised as no problem (0), small problem, i.e. able to manage without any help (1), more of a problem, i.e. probably need some help (2), and severe problem, i.e. definitively need help in managing this problem (3). The distribution of problem severity in all eight areas is presented in Table1 (1st column, giving median and min/max values). It shows that most have severe alcohol problems (median = 3), and that most have no problems with gambling and criminality (median = 0). For all other problems the distribution is more spread (medians = 1 and min-max values = 0–3). The distribution of alcohol problems is shown as an example: 22.3% no problem; 14.3% small problem; 11.6% more of a problem; and 51.8% severe problem. Those with any problem were asked how that problem had changed in the past 3 years, scoring from much worse (−3) to much improved (+3). Example: Alcohol, with extreme values being 28% for much worse, and 17% for much improved (other replies in between).
Table1also explores the rank correlations (Spearman Rho) between problem scorings and other related instruments, presented with internal consistency (Cronbach’s alpha): HAD for emotional distress, CD for cynical distrust, ISS for internalised shame, SS13 for social integration. In addition, MCSDS was used for testing bias related to social desirability.
There is a moderate but significant correlation between psychological health problems and emotional distress (HAD: Rho = 0.44, p < 0.001) and a modest negative correlation between relational problems and social integration (SS13: Rho = −0.28; p < 0.01). These correlations are between similar constructs (or its opposite), thus reflecting convergent validity.
Other correlations are between severity of specific problems and measures of other constructs known to be related. They reflect predictive validity. Emotional distress (HAD) was expected to be related to other problems in life, as was indicated by correlations with relational problems (Rho = 0.35,
p < 0.001), work and finances (Rho = 0.29, p < 0.01), and alcohol (Rho = 0.20, p < 0.05). Cynical distrust (CD), previously known to be related to health problems (Julkunen & Ahlström,2006), was correlated to both health scales—psychological and physical (Rho = 0.28 and 0.26, respectively; ps < 0.01).
Internalised shame was expected to be enhanced by various problems, e.g. alcohol problems, emotional problems, relational problems, etc., but less often in persons engaged in criminal activities (Braithwaite, 1989; Olthof, 2012). Moderate correlations with shame were found concerning emotional problems (ISS: Rho = 0.47; p < 0.001) and social relations (Rho = 0.46; p < 0.001), and there was a modest correlation with alcohol problems (ISS: Rho = 0.22; p < 0.05). Criminality was—as expected—not correlated to internalised shame, and neither were drug problems. Thus, the correlations supported the convergent and predictive validity of problem severity scales.
Table1also provides data to assess prestige bias. Social desirability captures the tendency to whitewash the situation. Positive correlations to problem severity should therefore indicate biased replies. Most problem areas are uncorrelated to social desirability, but for criminality there is a significant negative correlation (Rho =−0.21; p < 0.05), and a tendency in the same direction for drug problems (Rho =−0.19; p < 0.10). Criminal drug addiction is the most asocial pattern. Persons with those problems seem to whitewash less. Therefore, there was no indication of prestige bias weakening the validity of problem severity scales.
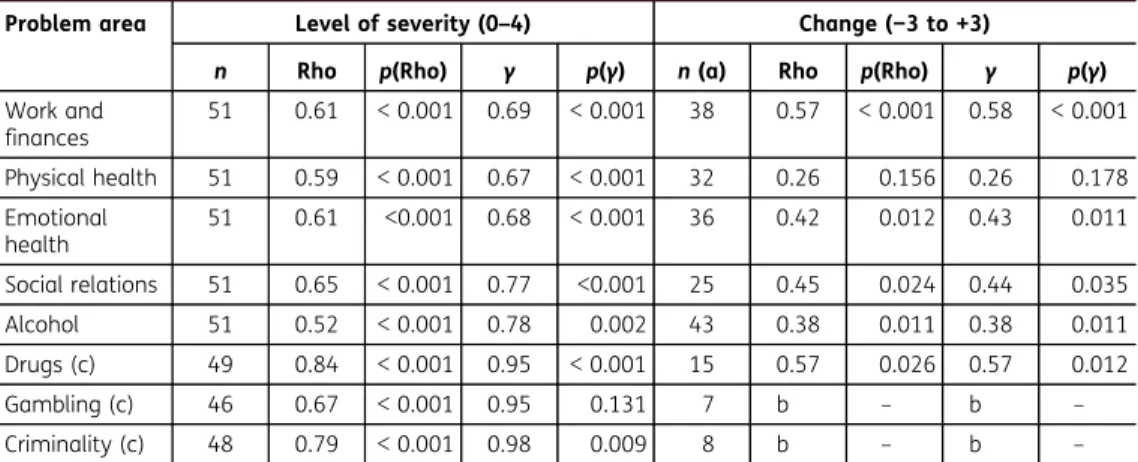
The self-assessed problem severity scorings were then compared to the collateral reports, blind to the self-assessed scorings (Table 2) and measured with rank order and symmetric correlations. Agreement was substantial or almost perfect concerning severity in all eight problem areas (γ = 0.67–0.98), while agreement concerning change was moderate on drugs, emotional health, social relations and work/finances (γ = 0.42–0.58), but only fair on alcohol problems (γ = 0.38).
Table 1. Problem severity distribution, and correlations (Spearman Rho) between problem severity in eight areas and relevant other scales, and internal consistency (α) of these scales
Problem area Problem severity Median (min–max) Emotional distress HAD Cynical distrust CD Internalised shame ISS Social integration SS13 Social desirability MCSDS n α 112–113 (a) 99–100 (b) 0.73 100–101 (b) 0.81 96–98 (b) 0.96 98–99 (b) 0.82 97–99 (b) 0.80 Work and finances 1 (0–3) 0.29** 0.17§ 0.19§ −0.18§ −0.13 Physical health 1 (0–3) 0.22* 0.26** 0.07 −0.11 0.14 Emotional health 1 (0–3) 0.44*** 0.28** 0.47*** −0.19§ −0.09 Social relations 1 (0–3) 0.35*** 0.19§ 0.46*** −0.28** −0.16 Alcohol 3 (1–3) 0.20* 0.09 0.22* −0.05 −0.00 Drugs 1 (0–3) 0.09 0.09 0.00 −0.01 −0.19§ Gambling 0 (0–3) 0.02 −0.04 −0.08 −0.02 −0.16 Criminality 0 (0–3) 0.07 0.17§ 0.08 −0.14 −0.21* Notes:§p < 0.10; *p < 0.05; **p < 0.01; ***p < 0.001.
(a) One interview had internal missing data on gambling and criminality; (b) some of the 101 questionnaires on tests for convergent and predictive validity were incomplete.
Motivation to deal with relevant problems was measured with three Likert-type questions on each problem, i.e.“thought of taking action”, “ready to take action” and “started to take action” to handle the problem. When tried in factor analysis (PAF and PCA; see Table3), the motivation scales based on these items had construct validity (all loadings but two >0.70) and satisfactory to excellent internal consis-tency (allα > 0.70). Normality of scales (with n > 50) was tried with K-S. They all deviate from normality (D (≥56) = 0.14–0.43; all ps < 0.004). Thus, all motivation scales showed satisfactory or excellent psycho-metric quality, but they are not normally distributed.
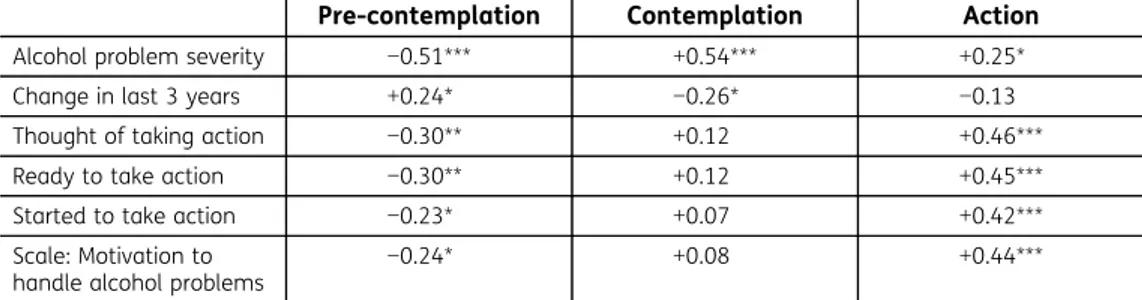
In Table4, the severity of alcohol problems, as well as change during the last 3 years, and motivation to handle alcohol problems (on item level as well as scale) were examined in relation to the Readiness to Change Questionnaire, which identifies three phases of change of alcohol problems, i.e. pre-contemplation, pre-contemplation, and action.
Table 3. Factor analysis (a, b) in relevant cases (c) with KMO (d), communalities, factor loadings and explained variance (R2); and internal consistency (α) of scales concerning moti-vation to handle problems in eight problem areas
Motivation to handle…
n (c) KMO (d)
Communalities Loadings R2 α
TTA RTA STA TTA RTA STA
Work and finances (a) 79 0.64 0.26 0.75 0.52 0.51 0.87 0.72 0.65 0.73 Physical health (a) 66 0.68 0.72 0.87 0.43 0.85 0.93 0.65 0.67 0.84 Emotional health (a) 80 0.72 0.54 0.80 0.77 0.73 0.89 0.88 0.72 0.87 Social relations (a) 59 0.70 0.60 0.93 0.66 0.77 0.96 0.81 0.73 0.88 Alcohol (b) 85 0.66 0.84 0.95 0.82 0.94 0.98 0.91 0.89 0.93 Drugs (a) 56 0.72 0.90 0.96 0.71 0.95 0.99 0.84 0.86 0.94
Gambling (e) 11 0.90
Criminality (e) 26 0.96
Notes: Based on three in each scale: Thought of taking action (TTA), Ready to take action (RTA), Started to take action (STA).
(a) The extraction method was PAF or (b) PCA (when PAF produced no solution due to high communality for one item); (c) Relevant cases were those with the problem (severity > 0); (d) KMO = Kaiser–Meyer–Olkin Measure of Sampling Adequacy; (e) Factor analysis not performed due to few cases with the problem (<50).
Table 2. Comparisons between focal and collateral interviews (n = 51) on severity in eight problem areas, and for the relevant cases (a), on change of severity in the past 3 years, using rank order correlation (Spearman Rho) and symmetric correlation (Gamma,γ)
Problem area Level of severity (0–4) Change (−3 to +3)
n Rho p(Rho) γ p(γ) n (a) Rho p(Rho) γ p(γ) Work and finances 51 0.61 < 0.001 0.69 < 0.001 38 0.57 < 0.001 0.58 < 0.001 Physical health 51 0.59 < 0.001 0.67 < 0.001 32 0.26 0.156 0.26 0.178 Emotional health 51 0.61 <0.001 0.68 < 0.001 36 0.42 0.012 0.43 0.011 Social relations 51 0.65 < 0.001 0.77 <0.001 25 0.45 0.024 0.44 0.035 Alcohol 51 0.52 < 0.001 0.78 0.002 43 0.38 0.011 0.38 0.011 Drugs (c) 49 0.84 < 0.001 0.95 < 0.001 15 0.57 0.026 0.57 0.012 Gambling (c) 46 0.67 < 0.001 0.95 0.131 7 b – b – Criminality (c) 48 0.79 < 0.001 0.98 0.009 8 b – b – Notes: (a) Number of relevant cases, i.e. those with the problem (severity > 0); (b) n(a) < 10; no correlations calculated; (c) Two collaterals could not provide information on drugs, three on criminality and five on gambling.
Pre-contemplation is strongly but negatively correlated to self-reported severity and to motivation, and positively correlated to change during past years; indicating that pre-contemplators claimed that they managed to handle the problem, if they ever had one. Contemplation is strongly and positively related to problems, negatively to change, and unrelated to motivation; i.e. contemplators acknowl-edged they had a problem but had not yet decided to make changes. Being in the action phase is positively related to problem level and strongly so to motivation; they were actively handling their problem. Thus, problem severity, change during the past 3 years, and motivation all showed good convergent validity with the RTCQ. The motivation scale is primarily interpreted as a scale measuring motivation for action.
3.2. Module 3—name generation of network members
In Module 3, the names of the NMs were generated and coded in the order of nomination, based on the question“Who is part of your PSN? Please list the persons that play an important role in your life, including persons who you perceive to play positive as well as negative roles”. The 113 FPs nominated 1,299 NMs (mean = 11.5). The specific composition of a PSN cannot be validated, since one cannot object to whoever a FP regard as a member of his/her PSN. One may have regular contact with another person without regarding that person as part of one’s PSN, and one may count another person as part of one’s PSN despite very infrequent contact (Bø,1993; Milardo,1992; Tracy & Abell,1994). Some aspects of the name generation process may, however, be scrutinised for possible bias.
As mentioned in Section1, the size of the PSN, as reported by the FP, might be influenced by personality. Gregariousness could result in exaggeration, while internalised shame could result in reporting a smaller PSN. In addition, social desirability might also result in reporting a larger PSN. None of these scales were, however, significantly correlated to network size (gregarious-ness: Rho = 0.12, p = 0.37; internalized shame: Rho = −0.18, p = 0.07; social desirability Rho =−0.08, p = 0.46). Therefore, we may conclude that those biases are not significant threats. The only scale significantly correlated to network size was the Integration scale of SS13, which aims to estimate network size (n = 97; Rho = 0.39, p < 0.001). The latter finding demonstrates convergent validity with SS13.
Each NM is given a code number, which is the same as the order in which they were mentioned by the FP. This nomination order is assumed to reflect the relative importance of the NMs, with NM number one as the most important. It is interpreted as an indirect ranking of importance and is hopefully to some degree observable to close persons. Therefore, nomination orders in focal and collateral interviews were compared. However, not all NMs are known to the collateral (Skårner,2001). The collaterals blindly identified 284 NMs of those nominated by the FP, leaving another 301 persons not identified. The order of the 284 persons mentioned by both was compared. To some extent, however, it is normal that collaterals tended to early mention persons who are important to themselves, rather than to the FP (Skårner, 2001). Collaterals
Table 4. Correlations (Rho) between phases of change (RTCQ) and alcohol problem level (n = 100), change (n = 82), as well as motivation (n = 77–79)
Pre-contemplation Contemplation Action
Alcohol problem severity −0.51*** +0.54*** +0.25* Change in last 3 years +0.24* −0.26* −0.13 Thought of taking action −0.30** +0.12 +0.46*** Ready to take action −0.30** +0.12 +0.45*** Started to take action −0.23* +0.07 +0.42*** Scale: Motivation to
handle alcohol problems −0.24*
+0.08 +0.44***
identified 75% of family members, 55% of relatives, but only 36% of friends, 29% of profes-sional helpers and not more than 18% of neighbours and colleagues mentioned by the FP. This reflects that half of the collaterals were themselves family members with more knowledge about family and relatives than about other contacts. Still, the orders in which these were mentioned by focal and collateral persons were moderately correlated (n = 267; Rho = 0.45, p < 0.001). When those 301 persons not mentioned by collaterals are included and given the high number 99 in the collateral scoring—i.e. not at all important—the correlation increases (n = 586; Rho = 0.50, p < 0.001). Thus, the nomination order between FP’s and collateral’s interviews is moderately correlated.
3.3. Module 4—network map
In Module 4, the chosen NMs were placed on the network map, describing the network structure in five sectors: family, relatives, friends and acquaintances, neighbours and colleagues, and profes-sional helpers; and organised in five concentric circles, marking five levels of proximity to the FP from 1 =“not at all close” to 5 = “extremely close”. Thus, the five sectors are categories, while the proximity levels are a five ordinal grades in how close the NM is according to FP. Disagreement in these respects between the focal person and the collateral does not discredit the validity of the former—rather, it highlights a lack of the collateral’s knowledge.
One could expect some disagreements on sector, since the borderline between“family” and “rela-tives” was deliberately not defined. The disagreements between some focal persons and the respective collaterals reflected the difference between family of origin versus the family created as adults. Most persons tend to interpret family as the latter. Therefore, a collateral mother tended to place her own children in the family sectors, while they in turn—after forming a new family, placed her (and father and siblings) in the relatives’ sector. Also, the borderline between friends on one side and neighbours and colleagues on the other side is not distinct since one may have known a person as a neighbour or a colleague and later developed a close friendship to that person. Still, good agreement between focal and collateral interviews supports validity. When examined, they agreed substantially (n = 237; absolute agreement = 0.77;к = 0.64, p < 0.001). Disagreement—as expected—mostly concerned the borderline between family and relatives (19.2%) while minor discrepancies were recorded concerning friends vs. neighbours/colleagues (1.2%) and friends vs. professional helpers (1.5%). Proximity scorings of FPs and collaterals were systematically correlated (n = 258;γ = 0.42, p < 0.001).
There is one relation in which the collateral has as good an insight as the FP, i.e. the relation between these two. Here, agreement on sector was substantial (n = 51; absolute agreement = 72%;к = 0.60, p < 0.001). Disagreements concerned the borderline between family and relatives as described above. Agreement on proximity was even better (γ = 0.75, p = 0.006), although not perfect. Using the Wilcoxon Sign Rank test, we analysed possible systematic differences in disagreements, i.e. to discover whether FPs in these cases tended to describe proximity closer compared to collaterals. There was no significant direction (z =−1.43, p = 0.152), thus no indication of systematic bias, only some moderate variation in how these two evaluated their mutual relation.
Proximity was correlated with other proposed indications of strength of ties (see Section 1). Correlation between proximity and the order of name generation was moderately negative, yet significant (Rho =−0.31, p < 0.001). A factor preventing higher correlation was that natural clusters were mentioned together, e.g. when a very close sister was mentioned, her husband and children were mentioned directly after, even though they were not regarded as close to the FP.
As mentioned, Ayuku et al. (2003) proposed that psychosocial support from NM to FP can be used as a proxy for the strength of tie. Below, in relation to Module 7, two such scales are presented in more detail, one concerning support delivered from NM to FP and the other concern-ing support in the other direction, i.e. from FP to NM. The correlation between proximity and these two support scales was moderately positive and significant (both scales: Rho =−0.31, p < 0.001).
Thus, mapping of the NMs in terms of sector and proximity demonstrated substantial agreement with collateral. Proximity was moderately, yet significantly, correlated in the expected direction with nomination order, and with mutual psychosocial support between FP and NM.
3.4. Module 5—family and relationships tree
In Module 5, the interviewee placed NMs in the genealogy tree for family and relatives. In addition, boxes were designed for subcategories of other sectors, thereby giving more precise information on type of relation, e.g. maternal and paternal grandparents, own children, spouses’ children, etc., were defined as such, as were type of professional helpers, as well as distinguishing between friends and acquaintances, and between neighbours and colleagues. Agreement between focal and collateral persons on this more precise information was excellent (absolute agreement 81%; к = 0.80, p < 0.001), although there were some discrepancies concerning specific types of profes-sional helpers and other relations.
3.5. Module 6—interactional aspects of relations
This module is used to assess the frequency, form and duration of contact, who takes initiative to contact, geographical distance, whether contact depends on own misuse, and assessment of the relations’ quality, concerning 1,299 NMs’ relationships to FPs. Of these, 93 relationships (7.2%) were latent, i.e. no contact in the past year. Questions from this module were not asked in the collateral interviews, and agreement can therefore not be analysed. Internal validity is studied in relation to other questions asked. Only a few examples are presented.
Frequency (nine-point ordinal from “no contact last year” to “daily contact”) was, as expected, positively correlated to proximity (Rho = 0.41, p < 0.001), i.e. more contacts with more close persons. Duration of contact (no. of years) was positively correlated to age of NM (R = 0.40, p < 0.001). Geographic distance (seven-point rank-ordered from“same apartment” to “other continent”) was associated with the form of contact, and showed expected patterns, e.g. personal meetings with persons living nearby, telephone contact with those living in other cities, Skype with the most distant persons.
For each relation, the FP reported whether contact was independent of own substance misuse, primarily (or just) when not using, or primarily (or just) when using. For all sectors, most relations were upheld independently of using or not, but when using they were more in contact with professional helpers and less with relatives and family (Kruskal–Wallis H-test: p < 0.001).
3.5.1. Quality of the relation
Six statements about the quality of the relation (with five-point Likert replies from“No, not at all” to“Yes, very much”) were extracted from originally 15 statements, when PAF with Promax rotation was used (KMO = 0.92), identifying two factors with Eigenvalues >1, and with support in Cattell’s Scree test. The first factor captures positive“rich” qualities with mutual caring and liking, while the second factor described“problematic” qualities with mutual threats, and feelings of discom-fort. The items with the top three loadings of each factor remained in a reduced analysis (KMO = 0.77) to form the final two subscales and are shown in Table5. All three factor loadings of rich qualities and one of three problematic qualities were strong (>0.70).
The scale on rich qualities had satisfactory internal consistency while problematic qualities had acceptable internal consistency (α = 0.85 & α = 0.65, respectively), but none of them had normal distribution (K-S: D(1,255) = 0.18 and 0.29, respectively; ps < 0.001). As expected, there was a moderate negative correlation between rich and problematic qualities of the relations (Rho =−0.40; p < 0.001; n = 1,254).
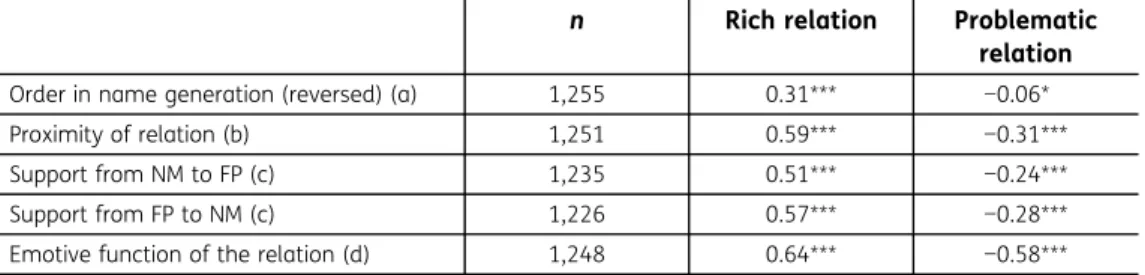
Richness in relation was highly and positively correlated to proximity in relation, and more mod-estly, to the reversed order in name generation (see Table6). In addition, they were more strongly correlated with scales presented below (in Module 7), i.e. emotive function of the relationship, and provision of support to FP from NM, and in the reversed direction, from FP to the NM. Thus, rich
qualities are possessed by relations that enhance positive emotions, who are close, to those we exchange mutual support with and to those who we nominated among the first. Problematic qualities in relations are with those that we do not appreciate as much, more distant persons, those with whom there is little support exchange, and those who are nominated as part of the PSN somewhat later. We may therefore think of persons who belong to our PSN also when we may feel less comfortable with them. This follows directly from the instructions given for the name generation.
These examples demonstrate good internal validity concerning the interactional aspects of the relations, i.e. frequency, form and duration of contacts, geographic distance, and the relation being dependent or not on substance misuse, as well as quality of relation in terms of richness in the relation and in terms of problematic relations.
3.6. Module 7—functional aspects of relations
Exchange of support—emotionally (e.g. comfort, encouragement), cognitively (e.g. information, knowledge, advice), practically (e.g. food, nursing care, transport) and financially (e.g. allowance, loan)—were assessed in both directions, i.e. provided to FP from NM, and, vice versa, from FP to NM. Each was measured with a five-point Likert scale from“No, not at all” to “Yes, very much”.
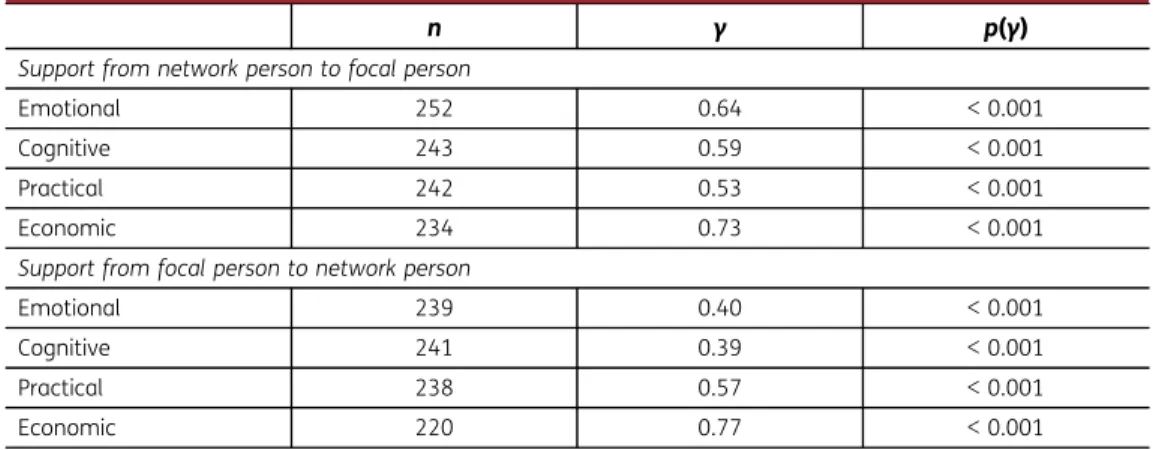
Agreement between focal and collateral interviews is shown in Table7. There was moderate to substantial agreement between focal and collateral interviews concerning all types of support. Agreement was surprisingly good considering the complexity of support processes (Vaux,1988).
Table 5. Factor analysisaon reduced model of six items on quality of relation, resulting in two factors: rich vs. problematic features (n = 1,252 after pairwise deletion)
Quality of the relation, six items:
Communalities Loadings
Rich Problematic
I feel that this person really cares about me
0.59 0.87 −0.38
It feels like this person wants to connect with me
0.54 0.81 −0.32 I really care about this person 0.51 0.76 −0.37 I can probably act as threatening
against this person
0.24 −0.19 0.57
I feel that the person can be threatening
0.31 −0.33 0.80 I feel unpleasant in this relationship 0.34 −0.52 0.56
Notes:aPAF with Promax rotation.
Table 6. Rank correlations (Rho) between quality of the relation—positive (rich), negative (problematic)—and proximity, order in name generation, and with scales presented below, i.e. mutual support and emotive function
n Rich relation Problematic relation
Order in name generation (reversed) (a) 1,255 0.31*** −0.06* Proximity of relation (b) 1,251 0.59*** −0.31*** Support from NM to FP (c) 1,235 0.51*** −0.24*** Support from FP to NM (c) 1,226 0.57*** −0.28*** Emotive function of the relation (d) 1,248 0.64*** −0.58***
Notes: (a) Presented in Module 3; (b) in Module 4; (c) in Module 6; (d) in Module 7. *p < 0.05; ***p < 0.001.
Based on factor analysis (PAF), it was possible to create two global scales on support with acceptable construct validity and satisfactory internal consistency, one for FP’s support reception from each NM (KMO = 0.70; communalities = 0.27–0.53; R2= 0.40, loadings = 0.52–0.73; α = 0.71) and one on support
provision from FPs to NMs (KMO = 0.74; communalities = 0.32–0.64; R2= 0.49, loadings = 0.57–0.81;
α = 0.78). None of the scales had normal distribution (K-S: Support to FP D(1,235) = 0.07, p < 0.001; Support from FP D(1,226) = 0.08; p < 0.001). Support in the two directions was highly correlated (Rho = 0.57, p < 0.001).
In two questions on each of the behavioural problem areas—alcohol, drugs, gambling and criminality—the interviewee was asked to rate NM’s negative and positive influence on the problem separately, using Likert scales from none (0) to very great negative influence (−3) vs. very great positive influence (+3). One NM could thus have both negative and positive influence, i.e. sometimes be part of the problem, sometimes supporting recovery. Agreement with collateral is shown in Table8. There was excellent agreement on the negative influence of NM on FP’s problems with alcohol and drugs, while the positive influence on these matters was moderate. Concerning gambling and criminality, persons with these problems were few (n = 15 and 17, respectively), and agreement was not calculated.
One question was whether this was a person whom the FP spent time with for having a sense of belonging, and another question was if this was a person through whom the FP got access to a broader healthy PSN. For both these questions, agreements between focal and collateral interviews were moderate (Belonging: n = 232, absolute agreement = 0.85;к = 0.56, p < 0.001; Access to broader network: n = 206, absolute agreement = 0.71; к = 0.43, p < 0.001).
Table 8. Absolute agreement and systematic correlation (γ) between focal and collateral interviews concerning the network persons’ impact on FPs’ substance use problems, when relevant n Absolute agreement γ p(γ) Negative influence Alcohol 179 0.83 0.89 < 0.001 Drugs 44 0.84 0.90 0.026 Positive influence Alcohol 187 0.40 0.40 < 0.001 Drugs 47 0.32 0.33 0.068
Table 7. Agreement (systematic correlation,γ) between focal and collateral interviews con-cerning exchange of four types of support in both directions
n γ p(γ)
Support from network person to focal person
Emotional 252 0.64 < 0.001 Cognitive 243 0.59 < 0.001 Practical 242 0.53 < 0.001 Economic 234 0.73 < 0.001 Support from focal person to network person
Emotional 239 0.40 < 0.001 Cognitive 241 0.39 < 0.001 Practical 238 0.57 < 0.001 Economic 220 0.77 < 0.001
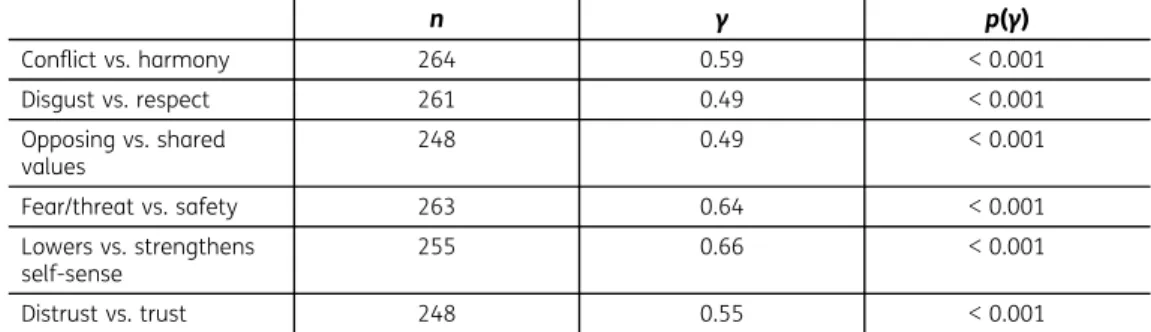
Six questions describe, on 7-point scales with opposite values at the endpoints, emotive func-tions in the relation between the FP and each NM in terms of conflict vs. harmony; disgust vs. respect; opposed vs. shared values; fear/threat vs. security; lowers vs. strengthens self-sense; and distrust vs. trust. Agreement between interviews was moderate to substantial (Table9).
Factor analysis (PAF) on these items showed acceptable construct validity (KMO = 0.89; communalities = 0.36–0.69; R2 = 0.55; loadings 0.60–0.83) and a scale based on them had
excellent internal consistency (α = 0.87) but was not normally distributed (K-S: D(1,262) = 0.11, p < 0.001). Thus, the scale on emotive functions in the relation to network persons demonstrated acceptable psychometric quality, but not normality.
3.7. Module 8—information on NM
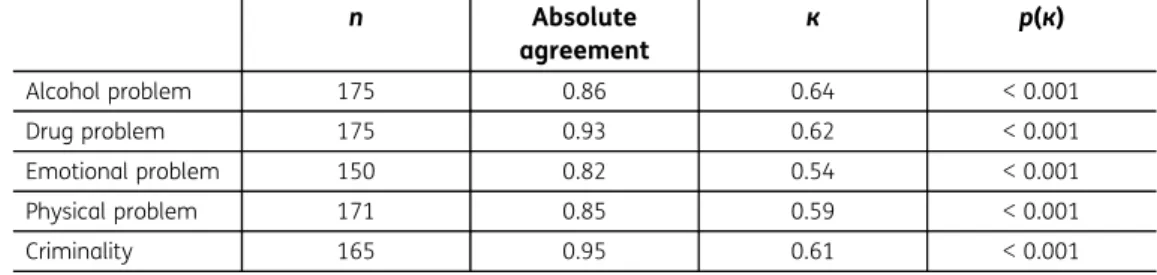
Specific questions were asked concerning the demographic and social background of each NM. Agreement between focal and collateral interviews, shown in Table10, was substantial or almost perfect. Questions were also asked about NMs’ own problems with alcohol, drugs, physical and emo-tional health, gambling and criminality. There were too few NMs with gambling problems to assess agreement, but concerning all other specified problem areas, agreement was moderate or sub-stantial and highly significant (Table11). Thus, agreement between FP and collateral concerning NMs’ situations was substantial or almost perfect on demographic and social background, and moderate or substantial on problem areas.
Table 9. Agreement (systematic correlation,γ) between focal and collateral interviews con-cerning FPs’ emotional relations to the NMs
n γ p(γ) Conflict vs. harmony 264 0.59 < 0.001 Disgust vs. respect 261 0.49 < 0.001 Opposing vs. shared values 248 0.49 < 0.001 Fear/threat vs. safety 263 0.64 < 0.001 Lowers vs. strengthens self-sense 255 0.66 < 0.001 Distrust vs. trust 248 0.55 < 0.001
Table 10. Systematic agreement (к), systematic correlation (γ), and Pearson correlation (R) between focal and collateral interviews on socio-demographic information concerning NM
n к p(к) R p(R) γ p(γ) Age (a) 210 0.98 < 0.001 Education (b) 162 0.68 < 0.001 0.92 < 0.001 Marital status (c) 202 0.84 < 0.001 Work situation (d) 185 0.82 < 0.001 0.89 < 0.001 Housing (e) 174 0.72 < 0.001 0.91 < 0.001
Notes: (a) continuous variable: No. of years; (b) ordinal variable: Had not completed elementary school/completed elementary school/completed high school/academic education (≥2 years); (c) Dichotomous variable: married or cohabiting vs. not (reversed); (d) Ordinal variable in relation to labour market situation: out of job/long-term sick leave or retired/In vocational training or education/Employed or self-employed; (e) Ordinal variable based on housing tenure security: no home/low threshold/lodging/second hand contract/own rental contract or ownership of apartment.
3.8. Module 9—contact map
Contacts between NMs were first identified by the interviewee (see the cover image), i.e. whether these NMs knew of each other or not; and then these relations were assessed (with five-point Likert scales) for frequency of contacts from“never” to “almost always”, and for quality of their relation from “conflict” to “harmony”. There was, as expected, a strong positive correlation between frequency and quality (n = 3,549; Rho = 0.58, p < 0.001).
The collaterals could confirm the validity concerning FPs’ information on the collaterals’ own contacts with others in the network both on frequency (n = 135;γ = 0.62, p < 0.001) and quality (n = 135;γ = 0.63, p < 0.001). Thus, measures on the frequency and quality of interrelations between NMs demonstrated substantial inter-rater agreement.
4. Discussion
The study presents validation analyses of an extensive instrument—the MAP-NET. The MAP-NET is, to our knowledge, the first instrument to assess the complexities of personal social networks of persons with substance use problems—addressing the networks in relation to the focal person’s specific problems, with resources and mutual support as well as risks and mutual problems. The structural, interactional and functional aspects of the networks are mapped. Although NMs are assessed anonymously to preserve their integrity, they are described in detail so that the focal person can plan actions with his/her counsellor or therapist. Since the interview is computerised, it is possible to carry out within a reasonable time. In addition, visual representations are produced during the interview. Instant feedback not only provides the focal person with a new and comprehensive overview of his/her network with the possibility of a richer insight, it also gives the possibility to correct mistakes directly, thereby strengthening its validity.
This study has applied a combination of validation strategies resulting in the following findings.
4.1 Convergent and predictive validity
Convergent and predictive validity of all eight problem severity scales were shown as correla-tions in the expected direccorrela-tions with similar constructs and with constructs known to be related, e.g. emotional distress, cynical distrust, social integration and internalised shame. Motivation to deal with the problem (here alcohol) showed convergent validity with readiness to change. Network size showed convergent validity with social integration.
4.2 Sensitivity to bias
There was no indication of sensitivity to various forms of prestige bias for the FP’s problem severity as shown by a lack of positive correlation to social desirability. Network size is another factor that might be sensitive to prestige bias, since one might exaggerate connections to raise self-evaluation or to match one’s grandiosity, or—on the other hand—devalue one’s connections as result of internalised shame. The number of NMs nominated by the FP was however not related to social desirability. Neither was it related to a gregarious personality, or to having problems with internalised shame.
Table 11. Absolute agreement and systematic agreement (к) between focal and collateral interviews on NMs’ problems n Absolute agreement к p(к) Alcohol problem 175 0.86 0.64 < 0.001 Drug problem 175 0.93 0.62 < 0.001 Emotional problem 150 0.82 0.54 < 0.001 Physical problem 171 0.85 0.59 < 0.001 Criminality 165 0.95 0.61 < 0.001
4.3 Psychometric quality
Index scales were studied for construct validity (by exploratory factor analyses) as well as reliability (internal consistency). The FP’s motivation to handle problems, mutual support provision between the FP and the NMs, rich as well as problematic qualities of the relation to NMs, and emotive functions of these relationships, all showed acceptable to excellent construct validity, and satisfactory to excellent internal consistency, although most scales did not have normal distribution.
4.4 Internal validity
The internal validity between constructs within the MAP-NET was assessed. The subjective construct of NMs’ proximity is moderately, yet significantly, correlated in the expected direction with nomination order and with mutual provision of support between FP and NMs. Good internal validity was found concerning interactional aspects of relationships, e.g. the frequency, form, and duration of contacts, geographical distance, whether the relation was dependent on misuse, and positive as well as negative aspects of relation quality.
4.5 Inter-rater agreement
Agreement with independent data provided blindly from a nexus person chosen for a collateral interview is perhaps the most critical validity test of the MAP-NET. But we should bear in mind that disagreements in these matters do not necessarily prove an FP wrong, especially concerning data on the FP and relation-ships external to the collateral. Agreement was substantial or almost perfect concerning all the FP’s problem areas, and moderate on change during the last 3 years concerning drugs, emotional health, social relations and work/finances. There was substantial agreement concerning sectors of NMs, but excellent agreement for the more precise information on the type of relation provided in Module 5. Proximity scorings were systematically correlated, and substantially so concerning the FP–collateral relation. Agreement was moderate to substantial concerning all types of support provided between the FP and NMs, and in both directions. There was excellent agreement on the negative influence of NMs on the FP’s problems with alcohol and drugs, and moderate agreement on positive influence. There was also moderate agreement on whom the FP spent time with for having a sense of belonging and on who provided access to other healthy contacts. Agreement concerning the social background of other NMs’ was substantial or almost perfect, and moderate to substantial concerning their problems. There was substantial agreement on information concerning the collaterals’ own contacts with other NMs; thus, the collateral could confirm the FP’s ability to rate these relationships, external to the FP.
5. Implications
Given that the MAP-NET can provide valid assessment of the social network in its complexity and within reasonable time, it has the qualities needed to be used clinically as well as in research to produce comprehensive and useful data on the networks of persons in need for support to handle misuse problems.
The MAP-NET was written in the Swedish language and is now translated into English, and it has the potential to be translated into and tried in any other language. The authors would like to have contact with researchers who would be interested in cooperating in translating MAP-NET to their languages.
Funding
This work was supported by the Swedish Council for Working Life and Social Research [FAS; Dnr 2004-0948]. Competing Interest
The authors report no conflicts of interest. The authors alone are responsible for the content and writing of the paper. Author details Arne Gerdner1 E-mail:arne.gerdner@ju.se Anette Skårner2 E-mail:anette.skarner@socwork.gu.se Stig C. Holmberg3 E-mail:stig.hbg@telia.com Anita Håkansson3 E-mail:Anita.hakansson@gmail.com
1Department of Social Work, School of Health and Welfare, Jönköping University, Jönköping, Sweden. 2Department of Social Work, University of Gothenburg,
Gothenburg, Sweden. 3C8Labs, Stugun, Sweden. Cover Image
Source: Contact map (Module 9): Two separate worlds with some internal conflicts.
Citation information
Cite this article as: Validation of MAP-NET—A network analysis tool, Arne Gerdner, Anette Skårner, Stig C. Holmberg & Anita Håkansson, Cogent Psychology (2018), 5: 1553654.
Note
1. The items of S&G were included on a later stage, therefor given only to 60 of the 101 respondents. References
Alemi, F., Stephens, R., Llorens, S., Schaefer, D., Nemes, S., & Arendt, R. (2003). The Orientation of Social Support measure. Addictive Behaviors, 28, 1285–1298. Ayuku, D., Odero, W., Kaplan, C., De Bruyn, R., & De Vries, M.
(2003). Social network analysis for health and social interventions among Kenyan scavenging street children. Health Policy and Planning, 18(1), 109–118. Baars, H. M. J., de B Ruyn, R., & van den Bergh, W. M.
(1997). Die Wiedereingliederung von forensisch psy-chiatrische Patienten. [The rehabilitation of forensic psychiatric patients.]. In H. Duncker, B. Dimmek, & U. Kobbe (Eds.), Forensische Psychiatrie und Psychotherapie. Lengerich: Werkstattschriften (Vol. 4, pp. 33–52).
Beretvas, S. N., Meyers, J. L., & Leite, W. L. (2002). A reliability generalization of the Marlowe-Crowne social desirability scale. Educational and Psychological Measurement, 62(4), 570–589. doi:10.1177/0013164402062004003
Bø, I. (1993). Folks sociale landskaper. En innføring i sociale nettverk [People’s social landscapes. An introduction to social networks]. Oslo: Tanu. Braithwaite, J. (1989). Crime, shame and reintegration.
Cambridge: Cambridge University Press. Cloninger, C. R., Przybeck, T. R., Svrakic, D. M., &
Wetzel, R. D. (1994). The Temperament and Character Inventory (TCI): A guide to its development and use. St. Louis, Missouri: Center for Psychobiology of Personality, Washington University.
Cook, D. R. (1994). Internalized shame scale: Professional manual. Menomonie, WI: Channel Press.
Corman, S. R. (1990). Computerized vs. paper and pencil collection of network data. Social Networks, 12(4), 375–384. doi:10.1016/0378-8733(90)90016-3
Costello, A. B., & Osborne, J. (2005). Best practices in exploratory factor analysis: Four recommendations for getting the most from your analysis. Practical Assessment Research & Evaluation, 10(7). Retrieved fromhttp://pareonline.net/getvn.asp?v=10&n=7
Duffy, J. C., & Waterton, J. J. (1984). Underreporting of alcohol consumption in sample surveys. The effect of computer interviewing in fieldwork. British Journal of Addiction, 79, 303–308.
Feld, S. L., & Carter, W. C. (2002). Detecting measurement bias in respondent reports of personal networks. Social Networks, 24, 365–383. doi:10.1016/S0378-8733(02) 00013-8
Forsberg, L., Ekman, S., Halldin, J., & Rönnberg, S. (2004). The readiness to change questionnaire: Reliability and validity of a Swedish version and a comparison of scoring methods. British Journal of Health Psychology, 9, 335–346. doi:10.1348/1359107041557084
Granowetter, M. (1973). The strength of weak ties. American Journal of Sociology, 78(6), 1360–1380. doi:10.1086/225469
Greenglass, E. R., & Julkunen, J. (1989). Construct validity and sex differences in cook-medley hostility. Personal Individuality and Differences, 10(2), 209–218. doi:10.1016/0191-8869(89)90206-7
Hair, J. F., Anderson, R. E., Tatam, R. L., & Black, W. C. (1995). Multivariate data analysis with readings (4th ed.). Englewood Cliffs, NJ: Prentice Hall.
Holmberg, S. C., & Håkansson, A. M. (2016).
Methodological considerations for development of research support systems. Journal of
Organisational Transformation & Social Change, 13 (3), 149–167. doi:10.1080/
14779633.2016.1239934
Julkunen, J., & Ahlström, R. (2006). Hostility, anger, and sense of coherence as predictors of health-related quality of life. Results of an ASCOT substudy. Journal of Psychosomatic Research, 61, 33–39. doi:10.1016/j. jpsychores.2005.12.005
Kline, P. (2000). The handbook of psychological testing (2nd ed.). London: Routledge.
Laireiter, A.-R., Baumann, U., Feichtinger, L., Reisenzein, E., & Untner, A. (1997). Interview und Fragen-bogen zum Sozialen Netzwerk und zur Sozialen Unterstützung, SONET. [Interview and questionnaire on social network and social support, SONET.]. Rehabilitation, 36, 15–30.
Landis, J. R., & Koch, G. G. (1977). The measurement of observer agreement for categorical data. Biometrics, 33, 159–174.
Lisspers, J., Nygren, A., & Söderman, E. (1997). Hospital Anxiety and Depression Scale (HAD): Some psycho-metric data for a Swedish sample. Acta Psychiatrica Scandinavica, 96, 281–286.
Marlowe, D., & Crowne, D. P. (1960). A new scale of social desirability independent of psychopathology. Journal of Consulting Psychology, 24, 349–354.
Milardo, R. (1992). Comparative methods for delineating social networks. Journal of Social and Personal Relationships, 9(3), 447–461. doi:10.1177/ 0265407592093007
O’Reilly, P. (1988). Methodological issues in social support and social network research. Social Science & Medicine, 26(8), 863–873.
Olthof, T. (2012). Anticipated feelings of guilt and shame as predictors of early adolescents’ antiso-cial and prosoantiso-cial interpersonal behaviour. European Journal of Developmental Psychology, 9 (3), 371–388. doi:10.1080/17405629.2012.680300
Prochaska, J. O., & DiClemente, C. C. (1982). Transtheoretical therapy: Toward a more integra-tive model of change. Psychotherapy: Theory, Research & Practice, 19(3), 276–288. doi:10.1037/ h0088437
Rosario, P. M., & White, R. M. (2006). The internalized shame scale: Temporal stability, internal consistency, and principal components analysis. Personality and Individual Differences, 41, 95–103. doi:10.1016/j. paid.2005.10.026
Skårner, A. (2001). Skilda världar? En studie av narkotika-missbrukares sociala relationer och sociala nätverk [Separate worlds? A study on the social relations and social networks of drug addicts] (Doctoral thesis). Gothenburg University, Department of social work, Gothenburg.
Skårner, A., & Gerdner, A. (2018). Conceptual and theoretical framework of the MAP-NET: A social networks analysis tool. Cogent Psychology, 5, 1488515. doi:10.1080/23311908.2018.1488515ool
Skinner, H. A., & Allen, B. A. (1983). Does the computer make a difference? Computerized versus face-to-face versus self-report assessment of alcohol, drug and tobacco use. Journal of Consulting and Clinical Psychology, 51, 267–275.
Tracy, E. M., & Abell, N. (1994). Social network map: Some further refinements on administration. Social Work Research, 18(1), 56–61.
Undén, A.-L., & Orth Gomér, K. (1989). Development of a social support instrument for use in population surveys. Social Science & Medicine, 29(12), 1387–1392. Vaux, A. (1988). Social support: Theory, research, and
intervention. New York, NY: Praeger.
Wasserman, S., & Faust, K. (1994). Social network analysis —Methods and applications. New York, NY: Cambridge University Press.
Zimet, G. D., Powell, S. S., Farley, G. K., Werkman, S., & Berkoff, K. A. (1990). Psychometric characteristics of the multidimensional scale of perceived social support. Journal of Personality Assessment, 55(3–4), 610–617. doi:10.1080/00223891.1990.9674095
© 2019 The Author(s). This open access article is distributed under a Creative Commons Attribution (CC-BY) 4.0 license. You are free to:
Share— copy and redistribute the material in any medium or format. Adapt — remix, transform, and build upon the material for any purpose, even commercially.
The licensor cannot revoke these freedoms as long as you follow the license terms. Under the following terms:
Attribution— You must give appropriate credit, provide a link to the license, and indicate if changes were made. You may do so in any reasonable manner, but not in any way that suggests the licensor endorses you or your use. No additional restrictions
You may not apply legal terms or technological measures that legally restrict others from doing anything the license permits.
Cogent Psychology (ISSN: 2331-1908) is published by Cogent OA, part of Taylor & Francis Group. Publishing with Cogent OA ensures:
• Immediate, universal access to your article on publication
• High visibility and discoverability via the Cogent OA website as well as Taylor & Francis Online • Download and citation statistics for your article
• Rapid online publication
• Input from, and dialog with, expert editors and editorial boards • Retention of full copyright of your article
• Guaranteed legacy preservation of your article
• Discounts and waivers for authors in developing regions