VTI särtryck
Nr 228 ' 1994
Lifestyle and Accidents among
Young Drivers
Nils Petter Gregersen and Hans-Yngve Berg
Reprint from Accident Analysis & Prevention, Vol. 26,
No. 3, 1994, pp. 297 303
Väg- och
transport-farskningsinstitutet
VTI särtryck
Nr 228 0 1994
Lifestyle and Accidents among
Young Drivers
Nils Petter Gregersen and Hans-Yngve Berg
Reprint from Accident Analysis & Prevention, Vol. 26,
No. 3, 1994, pp. 297 303
dh)
Väg- och
transport-farskningsinstitutet
'
& Pergamon
Accid. Anal. and Prev., Vol. 26, No. 3, pp. 297 303, 1994 Copyright © 1994 Elsevier Science Ltd Printed in the USA. All rights reserved
0001-4575/94 $6.00 + .00
0001-4575(93)E0009-V
LIFESTYLE AND ACCIDENTS AMONG
YOUNG DRIVERS
NILS PETTER GREGERSENLZ and HANS YNGVE BERG1
1Swedish Road and Traf c Research Institute (VTI), S-581 01 Linköping, Sweden, and 2Dept. of Community Medicine, University of Linköping, Sweden
(Accepted 1 March 1993)
Abstract- This study covers the lifestyle component of the problems related to young drivers accident risk. The purpose of the study is to measure the relationship between lifestyle and accident risk, and to identify speci c high-risk and low-risk groups. Lifestyle is measured through a questionnaire, where 20-year-olds describe themselves and how often they deal with a large number of different activities, like sports, music, movies, reading, cars and driving, political engagement, etc. They also report their involvement in traf c accidents. With a principal component analysis followed by a cluster analysis, lifestyle pro les are de ned. These pro les are nally correlated to accidents, which makes it possible to de ne high risk and low-risk
groups. The cluster analysis de ned 15 clusters including four high risk groups with an average overrisk of
150% and two low-risk groups with an average underrisk of 75%. The results are discussed from two perspectives. The rst is the importance of theoretical understanding of the contribution of lifestyle factors to young drivers high accident risk. The second is how the ndings could be used in practical road safety measures, like education, campaigns, etc.
Keywords Recently quali ed driver, Accident exposure, Behaviour, Accident proneness, Risk taking
INTRODUCTION
The problems of young drivers are well known. Sev-eral factors contribute to the explanation of their high accident risk, and the ways to structure these problems are many. One way is to structure these factors into four different groups:
(a) Level of actual knowledge and skill (b) Amount of experience
(c) Individual level of development and ma-turity
(d) Social situation and lifestyle.
A great deal of research has been carried out on all these aspects, perhaps to the largest extent in the three rst areas, where the focus has often been the discussion of what is most important, expe-rience or age factors, that is, the second and third factors above. The smallest amount of research has been done on the fourth aspect, social situation and lifestyle, which includes how you live, what groups you belong to, and what your interests, activities, and preferences are, etc.
Few of these studies have been focused on the lifestyle pro le of young drivers and how this is related to their accident risk. One such study has
297
been done by Schulze (1990), who shows a relation-ship between lifestyle pro les of German youngsters and their involvement in accidents. He found several high-risk groups. One of them was the action group . Members of this group differ from those in the other clusters by the great amount of leisure time they spend away from home, especially in pubs, discos, etc. Extra motives (Näätänen and Summala 1976) for car driving are also very important. They favour action films and reject social films, they like rock and punk music and football. They also drink a lot of alcohol. In the study, several other high-risk groups were identi ed. Due to small samples, however, it has been impossible to achieve statisti-cally reliable differences.
The importance of lifestyle is also supported by general statistics from young drivers accidents. It is well known that young drivers are involved in many accidents during night hours and weekends. German studies on so-called disco accidents show an overrepresentation of accidents before and after disco visits (Klemenjak and Hutter 1988; Schulze 1989).
Several studies have also shown the importance of alcohol in young drivers accidents. It has also been shown that alcohol is more dangerous for
298 N. P. GREGERSEN and H. Y. BERG
young drivers than older drivers (Glad 1985; Mayhew et al. 1986; Donovan, Marlatt, and Salzberg 1983).
AIMS
The aim of the present study is to identify the specific lifestyle profiles among young drivers and to analyse the relations between lifestyle and acci-dents in which young drivers have been the cause. The benefits of such knowledge are of two kinds. One is theoretical, i.e. analysing to what ex-tent young drivers accident risk is related to life-style. This is important since we do not know the quantitative relations between different groups of problems, such as level of experience, knowledge of rules, driving skills, psychological factors like personality and maturity, social factors, and life-style. The second benefit is to provide a practical basis for traffic safety measures. lf high risk groups can be described in terms of lifestyle, it is possible to define what specific groups one should focus on and through which channels.
lt is, however, not possible to draw any conclu-sions from this study about causes. The relationships found are statistical and do not describe to what extent the accidents are caused by lifestyles.
METHODS AND MATERIAL
In this study, lifestyle is measured as actions. This is based on a model oflifcstyle by Miegel (1990) in which lifestyle is structured in three levels a level of basic values, a level of attitudes, and a level of actions. Each level has four dimensions. where values are described as material. esthetic. ethical. and metaphysical. On the level of actions these di-mensions are described as actions ofinterests. style. morality, and ideology.
This level of actions can, according to Miegel. be used when measuring lifestyle. In the present study this strategy is used. The patterns ofdifferent actions are measured, through which specific life style groups are de ned.
The data were collected through a questionnaire sent to a sample of young drivers.
A sample of 3.000 youngsters, 20 years old. was randomly drawn from the Swedish population register (SPAR). This group was expected to include 20% who did not have a driver s licence. These were to be excluded from the sample. This was done through the first question, Do you have a driver s licence? The questionnaire was answered by 2.190
Table 1. The results from the PCA, description of 10 factors Explained
Factor variance (%) Description
Sports 6.4 Active in sports,
watches sports activities, caring about the body
Alcohol 6.0 Drinking habits
Extra motives 5.7 Other motives for car
driving than transport, i.e. showing off, pleasure, sensation seeking, etc.
Culture 5.6 Classical music, theatre,
jazz, rock, playing instruments
Romantic 5.0 Romantic literature and
romantic films, clothes, householding
Social engagement 4.3 Political matters, peace
movement, human rights, social films
()ut and about 4.1 Driving with pals, rock
concerts, records, parties, disco, movies
Film 3.8 Video, action films, TV,
movies, staying at home
Clothes 3.6 Elegant clothes, tailored
clothes, suit, fashion
('ars 3.2 Cars as a hobby, owns a
car. riding motor cycle
persons. After excluding 19% without a licence, ac-cording to the answers of the rst question, the maining sample consisted of 1,774 persons. The re-sponse rate. calculated from the number of expected licence holders. was 74%. Ofthe respondents 54.7% were men, which corresponds well to the general share of male licence holders in Sweden, 54%.
The main reason that only 20-year-olds were chosen was to control for age differences. They should also have acquired some driving experience, which excludes the choice of completely novice drivers.
The questionnaires were mailed to the respon-dents. Two reminders were used.
The questionnaires had questions about life-style actions including sports, music, movies, read-ing, dancread-ing, cars and drivread-ing, clothread-ing, body care, style, householding, political and social engage ment, alcohol and drugs, etc. There were also ques-tions about background factors like sex, rural/urban living, education, occupation, etc. and about involvement in traffic accidents. Respondents were instructed to include material damage and/or bodily injury in their answers about accidents.
The data from the many lifestyle questions of the questionnaire were reduced through a principal
Lifestyle and accidents among young drivers 299 N ( Sports Alcohol Ex motives Culture Romantic Soc eng Out a about Film Clothes Cars Drive day Drive night Drive transp Drive party Drive around Feel drunk -1 0 1 2 Z -va|ue
&
Fig. 1. The lifestyle pro le of the rst high-risk group.
component analysis (PCA) rotated with varimax. The purpose of PCA is to reduce the number of questions to a limited number of factors that could be used for further analysis.
The PCA resulted in a number of factors (life style components) that were used in the second step, a cluster analysis. The purpose of the cluster analy-sis was to group the respondents into similar pro les over the lifestyle components. These clusters de ne the lifestyle groups.
After the cluster analysis, each cluster was ana
lysed with regard to traf c accident risk (accidents/ licence holders). A t-test was run for each group to calculate if they had been involved in signi cantly more or less accidents/person than the average of the whole group. Only accidents in which respon-dents were the cause were used. The signi cance level was 5%. From these analyses high risk and low risk groups were de ned.
Accident risk in this study is de ned as acci-dents/licence holder. This is a traditional way to de ne risk in epidemiological research. In traf c safety research, however, a traditional risk measure is accidents/mileage. The reason that this was not used here is that exposure has been regarded as an important part of lifestyle. Exposure is measured in several aspects like time of day, motives for driving, goals etc. If exposure patterns are included in life-style, one can draw conclusions about countermea-sures with the purpose of changing the exposure patterns. If, for example, a high-risk group drives a lot during night hours with other motives than transport, the conclusions will be that it is important to change their way of using the car. The basic inter-est has been focused on how many accidents young-sters have, not their risk per mileage.
RESULTS
The PCA resulted in a reduction of the lifestyle data from 59 items to 10 factors. These 10 factors explained 48% of the variance in the 59 questions about lifestyle. The 10 factors are described in Table 1. The limit was drawn after 10 factors since the explained variance was close to 50%, and each new factor did not add very much to the explanation.
The next step was the cluster analysis. In this the 10 factors from the PCA were used together with some additional questions in the questionnaire about driving habits (time of day, motives for driving) and how often they feel drunk. In the analysis, all an-swers are standardised and translated into z values. The z-value zero is the average of the whole group. The respondents were divided into 15 groups by the cluster analysis, each group with a speci c pro le over the different lifestyle factors. Using the t-test, four groups were found to have a signi cantly higher accident risk and two groups were found to have a lower risk than the average of the whole sample.
The pro les of these six groups are shown in Fig. 1 Fig. 6. Some explanations to the text in the x-axis of the gures are necessary. The rst 10 fac-tors are explained in Table 1. The additional six lifestyle components are:
Drive day = amount of driving during daytime
Drive night = amount of driving during night hours
Drive transp = amount of driving with transport motives
Drive party = amount of driving to parties, etc.
( Sports Alcohol Ex motives Culture Romantic Soc eng Out a about Film Clothes Cars Drive day Drive night Drive transp Drive party Drive around Feel drunk -1 O 1 2 Z-value
k
300 N. P. GREGERSEN and H. Y. BERG Sports g .j \ Alcohol l : . . , Ex motives Culture Romantic Soc eng Out a about Film Clothes Cars Drive day Drive night Drive transp Drive party Drive around
Feeldrunk __ .Wl A....l...l. .L l...ni ] A i ll
-1 0 1 2 Z-value
\
J
Fig. 3. The lifestyle pro le of the third high risk group.
Drive around : amount ofdriving without specific aim
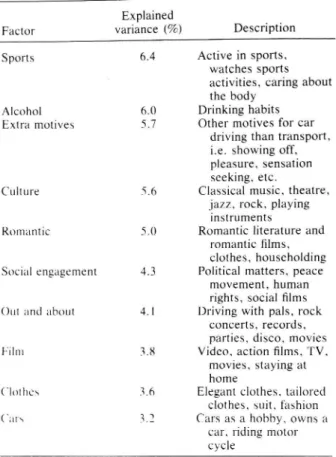
Feel drunk : how often they feel drunk. The most characteristic signs of the rst high-risk group are that they are seldom active in sports, they often drink, and they have more extra motives when driving than the average. They are a little more out
and about and are very interested in cars (Fig. l).
Seventy nine percent of the group are men. The second high risk group has somewhat dif ferent combinations. Their interests in sports are average, they often drink, just like the rst group. They drive very seldom with extra motives, how-ever, but often use the car for transport to de ned goals. They score high on cultural activities and on clothes. They also have a higher interest in cars than the average. They drive a lot. both during day and
( Sports ' \ ' Alcohol Xx ' Ex motives ' ' x ' ' Culture * / / Romantic e ' Soc eng _ Outaabout _ ' ' Film '- ' > Clothes ' ' Cars ' j ' ' ' ' Drive day r ' ' ' Drive night * ' " ' Drive transp * ' " ' ' ' " " Drive party _ * <' Drive around ~ ' r ' ' ' v _ Feeldrunk » _ . '. ' . . . l . .' "l -1 0 1 2 Z-value &
Fig. 4. The lifestyle pro le of the fourth high-risk group.
Spons Alcohol Ex motives Culture Romantic Soc eng Out a about Film Clothes Cars Drive day Drive night Drive transp Drive party Drive around Feel drunk -1 0 1 2 & Z-value)
Fig. 5. The lifestyle pro le of the rst low-risk group.
night hours (Fig. 2). The predominance of men is not so obvious in this group as in the rst, 62%.
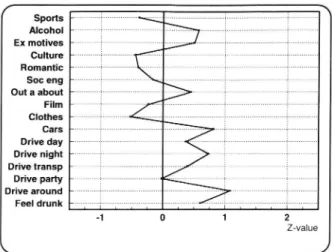
ln the third high-risk group the drinking habits score very low. Very often they have extra motives for driving, and they also drive a lot, most often during night hours. They are not as interested in social engagement as the average. Instead they like cars, clothes, lm, and being out and about (Fig. 3). Seventy nine percent of this group are men.
The fourth and the last high risk group differs from the others by their very low scores on being out and about. They are not interested in clothes and they are not very socially engaged. They do not drive very often and when they do, extra motives are very important (Fig. 4). Sixty one percent in this group are men.
In the first low risk group the most obvious pat-tern is that they seldom drive. The only factors they score a little higher on are Culture, Romantic and Social engagement (Fig. 5). In contrast to the high risk groups. the majority, 69%, are women.
( Sports Alcohol Ex motives Culture Romantic Soc eng Out a about Film Clothes Cars Drive day Drive night Drive transp Drive party Drive around Feel drunk -1 0 1 2 Z-value
L
Lifestyle and accidents among young drivers 301 Table 2. Description of the high- and low-risk groups with regard
to size and accidents Size of the
group in Accidents in Average
% of % of all accident risk
Group respondents accidents per person
High-risk no. 1 10.1 14.9 0.59 High-risk no. 2 4.9 7.6 0.65 High-risk no. 3 1.9 3.1 0.66 High-risk no. 4 4.0 6.6 0.66 Low-risk no. 1 23.4 14.6 0.25 Low-risk no. 2 5.6 3.2 0.23 Whole sample 100 100 0.40
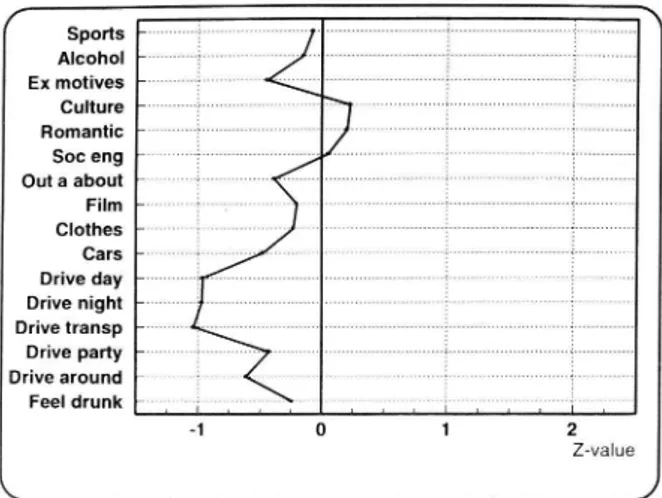
The second low-risk group has a slightly more deviant pro le. They are very interested in sports and they very seldom drink alcohol. They often drive during night hours and they often drive to parties. They are often out and about but are not very inter-ested in lms or in clothes (Fig. 6). In this group as well, women dominate with 68%. *
The size of the groups, their accident risk, and their share of the total number of accidents are shown in Table 2. All together the high-risk groups are 22% of the respondents and their share of the accidents is 32%, i.e. approximately 50% higher risk. In Fig. 7 the accident risk of these six groups is plotted together with the curve of accident risk in the population from the police records. The risk levels are indexed so the average risk of 18- to 19-year-olds has been set to 1. From the plots can be seen that the high risk groups have an overrisk of 800% compared to drivers over 26 years, while the
1.8 -1.6- lI Q 1-4 " Population 1.2 .. * High risk] i l- ' Highrisk2 w . . g A nghr|sk3 o 0.8 --åå ' High risk4 0.6 -- 3 A Low risk] D . 0.4 -- Low nsk 2 0.2 --0:::::::::: ..
sagasszzagga
abc'aa'uéétbc'ao'aéoao A ' N N N N "O IN N N IN r\ AgeFig. 7. Standardised accident risk (accidents/licence holder) in the population (police records) compared to the high- and
low-risk groups of the study.
young driver overrisk in the low-risk groups, is
only 300%.
DISCUSSION
Before drawing any conclusions from the re-sults, one must take some methodological aspects under consideration.
Two of the statistical procedures used in this
study, PCA and cluster analysis, are dependent on
the researchers subjective interpretations and deci-sions. In the PCA an approximation is done by re-ducing a number of variables into a few factors. In this case, the researcher makes the decisions about how large a proportion of the variance that should be explained in the factors used. If all factors from the analysis are included, the number of factors will be the same as the number of variables put in to the PCA. No reduction would have been done. In this study a limit of 50% eXplained variance has been used. This was achieved with 10 factors. The rest of the variance, 50%, is explained by the 49 factors not used. Each new factor contributes very little to the variance.
In the same way, the cluster analysis includes approximations. When grouping individuals into clusters, the procedure optimises the pro les and nds the distribution where the distances from the pro le of each group are minimised. The pro les, however, will not be perfect until you have as many pro les as individuals. By grouping them together, there will always be approximations that you cannot fully control.
The next problem in the analysis is, of course, the t-test of signi cance. There is always a little probability of chance, in this case not over 5%, that random effects have in uenced the result.
The results show a high probability that there are relationships between lifestyle and accident risks in traf c. Four high-risk and two low-risk groups were found. The hypothesis of relationship can thus be con rmed.
One conclusion is that all young drivers do not have the same high accident risk. The risk varies a lot among drivers. Some of them cause a lot of accidents, others cause few or no accidents. It is well known that among young drivers women s risk is lower than men s and that alcohol consumption is related to accident risk as well as weekend and nighttime driving. Accidents in connection with disco visits are common. Driving with extra motives like showing off and impressing, sensation seeking, competition, pleasure, etc. is also well known to be related to accident risk (Gregersen 1993, for an overview).
302 N. P. GREGERSEN and H. Y. BERG
The new findings in this study show how these factors are combined in speci c groups among driv-ers. That some of them are connected has also been shown earlier (Evans, Wasielewsky, and von
Bu-seck 1982; Deutsch, Sameth, and Akinyemi 1980;
Lawson and Arora 1982; Wilson and Jonah 1985), but not how.
The lifestyle groups that were found in the study have not been given any names, as they would prob-ably be wrong and very subjective. Each reader would probably interpret such a name in his own way. Consequently, it is better to let the readers themselves create pictures of the groups, based on their own interpretations of the profiles. The study is, however, the first step towards this understand-ing, and should be followed by a closer analysis using qualitative methods as interviews and observations. How can these results be used? lt depends on whether or not the statistical relationship between lifestyle and accident risk is a matter of cause or not. If it is, one should consider if one should use measures for changing lifestyles or lifestyle compo-nents. It is probably impossible and unethical to try to change the lifestyle as a whole of these high-risk drivers. ()f course, besides traffic. many other factors, which explain why they have developed their speci c lifestyles, are involved.
The most obvious advantage ofthe study is that it makes it possible to classify young drivers into high-, average-. or low risk groups. This possibility might be used in different ways and with different purpose. One goal could be to use the classification in order to stop the most dangerous drivers from driving. A classification form could be used in con nection with the licensing test. This. however. is not a strategy in line with the general and political view. i.e. that driving is everyone's right.
A better way is to focus on changing behaviour among the drivers in the high-risk groups. to make them drive more safely. To do this. traditional meth ods like group-specific campaigns. teaching. and training, etc. could be used. Most ofthese traditional methods, however. are based upon a strategy where authorities of some kind tell the drivers how to be have. This is seldom very effective. Another strat-egy is to give individual drivers preconditions by which they can nd out needs for behavioural changes themselves. This kind of educational strat-egy is used in many circumstances. within both traf fic and nontraffic education. In the traffic education of young children in schools, this kind of problem oriented education is increasing. The idea is to change from learning rules and behaviour by heart. to an understanding of traffic and risks. where chil-dren are helped to draw conclusions themselves
about what is dangerous, what others must change, and what they could do themselves (Nilsson 1992). The strategy of self-produced decisions has also been evaluated in a traffic safety experiment within the Swedish Telecom (Gregersen and Morén 1990; Brehmer, Gregersen, and Morén 1993). Professional drivers were divided into small groups where, fol-lowing a speci c procedure, they discussed and de-fined their road safety problems and made sugges-tions about what measures the company ought to take and what they could do themselves as drivers. The discussion resulted in lists of suggestions to the company and individual decisions, i.e. about ways of driving. The results from this experiment showed a reduction of accident risk of about 50% compared to a control group.
Another example of a positive effect from this strategy is taken from health education. Arborelius and Bremberg showed that their method, called It s your decision! , did change health behaviour among school children. The method is based on group dis cussions in combination with self-diagnosis of cer-tain health factors, leading to individual decisions about how to reach better health (Arborelius and Bremberg 1990).
A closely related method, used in health promo-tion. is the use ofa health meter", a self-diagnostic form composed of questions about a number of health factors. The results of the self diagnosis can be used individually or in group discussions to draw conclusions about one s own health, one s risks, and what changes of behaviour, etc., are needed to
improve health (Trell 1990).
This idea could also be used to improve safety among young drivers. The process would be to gather young drivers in groups, i.e. in school or in driving school or in other places where young people meet. The boys and girls are instructed to fill in a Traf c Safety Meter that, based on the ndings from this study, classi es them into risk groups ac-cording to how they describe their lifestyle. To-gether with necessary information about traf c safety, accident causes, etc., this could be used in group discussions that end up in individual decisions about what to change.
The strategy implies the development of a f Traf c Safety Meter that young drivers can ll in and that is easy to draw conclusions from. It should be self-evaluating and more or less authomat-ically de ne the respondent s lifestyle pro le and risk rate.
There are two reasons why it is important to add an evaluation to such a strategy for improved traf c safety. The rst reason is the most obvious, to evaluate if the method really has an in uence
Lifestyle and accidents among young drivers 303
on traf c safety. The second reason is to analyse whether or not the lifestyle patterns found in this study cause the differences in accident risks. One way to analyse this further is to make interventions with the purpose of changing lifestyle components. If it is possible in a controlled study to change such components and to measure if the changes in uence accident risk, it is also possible to draw conclusions about the nature of the relations between lifestyle and accident risk.
Acknowledgements This research was supported by grants from the National Society for Road Safety (NTF) in Sweden.
REFERENCES
Arborelius, E.; Bremberg, S. It is your decision! Be-havioural effects of a student-centred health education model at school for adolescents. J. Adolesc. 11:287 297; 1988.
Bremer, B.; Gregersen, N. P.; Morén, B. Group methods in safety work. In manuscript. Uppsala: University of Uppsala. Dept. of Psychology; 1993.
Deutsch, D.; Sameth, S.; Akinyemi, J. Seat belt usage and risk-taking at two major traf c intersections. In: Proceedings of the 24th Conference of the American Association for Automotive Medicine. Arlington Heights, IL: AAAM; 1980.
Donovan, D. M.; Marlatt, G. A.; Salzberg, P. M. Drinking behaviour, personality factors and high risk driving. J. Stud. Alcohol 44:395 428; 1983.
Evans, L.; Wasielewsky, P.; von Buseck, C. R. Compul sory seat belt usage and driver risk taking behaviour. Hum. Factors 24:41 48; 1982.
Glad, A. Research on drinking and driving in Norway. Temahefte 15, Samferdsel. Oslo: TOI; 1985.
Gregersen, N. P.; Morén, B. Trahksäkerhetsåtgärder i Televerket. Ett jämförande försök att minska skador
och kostnader genom körträning, gruppsamtal, bonus och kampanj. VTI-report 384. Linköping: Swedish Road and Traffic Research Institute; 1990.
Gregersen, N. P. Young drivers. Safety problems and effects ofeducational measures. VTI-report 368A. Lin-köping: Swedish Road and Traf c Research Institute; 1993.
Klemenjak, W.; Hutter, M. Stellenwert des Discobe suches als Freizeitgestaltung und damit zuzammen-hängende Verkehrssicherheitsprobleme. Wien:
Ver-kehrpsychologishes Institut. Kuratorium fiir
Verkehrssicherheit; 1988.
Lawson, J. J.; Arora, H. R. 1981 nighttime surveys of drivers alcohol use. In: Proceedings ofthe 26th Confer ence ofthe American Association for Automotive Med-icine. Arlington Heights, IL: AAAM; 1982.
Mayhew, D. R.; Donelson, A. C.; Beirness, D. J.; Simp son, H. M. Youth, alcohol and relative risk of crash involvement. Accid. Anal. Prev. 18:299 314; 1986. Miegel, F. Om varden och livsstilar, en teoretisk, metodo
logisk och empirisk översikt. Forskningsrapport nr 25 i kommunikationssociologi. Lund: University of Lund, Dept. of Sociology; 1990.
Näätänen, R.; Summala, H. Road user behaviour and traffic accidents. Amsterdam and New York: North Holland/American Elsevier; 1976.
Nilsson, B. Olika teorier om barns utveckling inom områ det barn och tra k. VTI-meddelande 676. Linköping: Swedish Road and Traf c Research Institute; 1992. Schulze, H. Disco-Unfälle, Fakten und
Losungsstrateg-ien. Bergisch Gladbach: Bundesanstalt fiir Strassenwe-sen; 1989.
Schulze, H. Lifestyle, leisurestyle and traffic behaviour of young drivers. In: VTI report 364A. Linköping: Swedish Road and Traf c Research Institute (VTI);
1990.
Trell, E. Hälsometer ett sätt att ta tempen på din hälsa! Linköping: Landstinget i Östergötland; 1990.
Wilson, R. J.; Jonah, B. A. Identifying impaired drivers among the general driving population. J. Stud. Alcohol 46:531; 1985.