S T A T E N S
V Ä G I N S T I T U T
T H E N A T IO N A L SW ED ISH R O A D R E S E A R C H IN S T IT U T ES T O C K H O L M
R E P O R T 44A SIMPLE GROUND
TEMPERATURE INDICATOR
by P. T. H O D G IN S 1 9 6 3Page
A Simple Ground Temperature In d ic a to r... 5
Appendices dealing with various freezing Phenomena Appendix I: Freeze-purification and freeze-concentration ... 18
Appendix II: Some microscopic observations during the chilling of solutions ... 22
Appendix I I I : The selection of chemically suitable indicator solutions containing freezing point depressants ... 28
Appendix IV : Some indicator solution test m ethod s... 29
Appendix V : H eavy water in indicator so lu tio n s... 31
Appendix V I: Freezing temperature determinations ... 32
Appendix V II: A discussion of freezing p o in ts ... 37
Appendix V I I I: Undercooling ... 40
A SIMPLE G R O U N D TEM PERATU RE IN D ICATO R
byPeter T . Hodgins
Statens Vaginstitut, Stockholm, Sweden, 1963
Introduction
The ground temperature indicator to be described here has to date been developed only to provide information on ground temperatures lying within a range of a few degrees above and below o°C . Some extension of the range appears feasible, however, and a main purpose which has been kept in view during the writing of this report is to inform the reader well enough to allow him to begin, with reasonable efficiency, developments towards any new goal which may be desired. Considerable supplementary information has accordingly been included, largely in the form of appendices. The latter will also be of interest to some readers, it is thought, because of the content of information of general scientific interest.
The ground temperature indicator functions on the principle of the Gandahl type frost depth indicator, an instrument which will be described briefly later in this paper. The ground temperature indicator has the ability to indicate the positions of several isotherms in the ground by means of a number of columns of indicator solutions which freeze at various fixed temperatures. The Gandahl type instrument, on the other hand, has a single column, with a solution which freezes at o °C ; the o °C isotherm is taken as the frost line. Freezing of the indicator solutions in both instruments is indicated by pronounced colour contrasts between the ice and the unfrozen liquids. One of the solutions which may be used in the ground temperature indicator is that, originally developed by Gandahl, in which 0.05 % (by weight) of methylene blue dye is dissolved in distilled water; as we shall see, the dye has 110 appreciable effect on the freezing point. Thus, the ground temperature indicator can do the same jobs as the original one-solution instrument but, because it furnishes a range of temperature indications, the ground temperature indicator can also provide the basis for the determination of thermal gradients, in-place thermal conductivities of soils and road materials, and the energy exchanges involved in frost penetration and frost heave.
Alternative methods for obtaining similar indications of the thermal regime in the ground already exist, and so the reasons for the development of the new ground temperature indicator should be stated. First, it may be pointed out
that the new instrument has been kept interchangeable with Gandahl’s instrument from the point of view of physical accommodation in field instal lations, which means that several hundred suitable Swedish field locations are ready for testing at any time the need may arise, and that installation costs will be practically nonexistent. Furthermore, reliability and convenience are considered to be greater for the ground temperature indicator than for overall systems of electrical measurement by means of thermocouples or thermistors and the associated instrumentation, at least for the purposes of relatively shallow-depth research into frost phenomena affecting roads and airfield pavements. On the other hand, deeper “ geotechnical” problems perhaps are beyond convenient reach by means of the ground temperature indicator, as this instrument must be pulled up out of its installation hole in the ground for reading. In temperate climates, this limitation is of no great consequence, since we are only speaking of depths lying near the frost line.
Brown (14) has found that errors of more than 3 °F (about 2°C ) are likely to occur in the readings of thermocouples situated at shallow depths below the ground surface, as a result of heat conduction by the electric leads to the few thermocouples used in his test probes. Heat-conduction errors are unlikely to trouble the ground temperature indicator functioning on the principle of Gan- dahPs frost depth indicator, as both of the latter instruments are purposely built of low-conductivity materials. This lends further support to the contention that the new ground temperature indicator is probably more suitable for use under many circumstances than are electrical measuring devices.
The Gandahl type frost depth indicator
The basic principle of the ground temperature indicator has been discussed in connection with descriptions11,2) of GandahFs instrument; in addition, reference 1 in particular describes many physical features of the frost depth indicator which have been retained in the various ground temperature indicator models (of which there are three basic types, to be described later). Investigations in which GandahPs apparatus has been used have been reported13,4) 5) C) and may be of considerable, if somewhat incidental interest to the reader. Because of the adequacy of earlier descriptions, the present outline on the frost depth indicator will be brief.
The frost depth indicator consists of a long column of indicator solution which is installed vertically in a narrow hole sounded or drilled in the ground, the indicator solution having the property of changing from a deep blue colour to virtually colourless ice at the frost line in the ground. The instrument may be raised at any time from its hole for inspection. The limits of the frost zone(s) in the ground are indicated by colour changes in the instrument’s solution column. The solution column is encased in a clear plastic pipe, and relief of freezing pressures which might otherwise burst the instrument is afforded by the provision of an air-filled latex rubber tube stretched coaxially or con centrically from end to end inside the pipe. In order that readings may be made
most conveniently, depth graduations are marked directly on the clear plastic surface of the instrument.
The hole in the ground in which the instrument is to be installed is lined with a larger-diameter plastic pipe which maintains the hole by preventing caving and leakage, and which thus also protects the instrument proper. The lining pipe is usually held in position by means of a system of anchorages and sliding parts designed to prevent or minimize frost-heaving effects (see, for example, reference i). At the top of the lining assembly is a short section of threaded pipe into which a matching part, attached to the top of the instrument proper, may be screwed. The space inside the lining pipe is thus sealed against contamination and, at the same time, the instrument is suspended in a constant relationship to the ground surface.
Indicator solutions for use in ground temperature indicators
It has been implied that solutions having freezing temperatures below, at, and above o °C may be used in the various indicator columns of the ground temperature indicator. For reasons which are explored in Appendix I, freezing temperatures below o °C must be obtained by means of saturated solutions of temperature depressing agents (i.e., generally, inorganic salts) in water, the agents being chosen among those of rather low solubility in order that reasonable freezing temperatures will be obtained. Freezing temperatures above zero are obtained by means of heavy water solutions. Pure heavy water freezes at + 3.8°C . This matter also is treated in the appendices. H eavy water is rather expensive, but is required in only small amounts here.
Table I is a list of those freezing points which have been investigated so far in this study. A t the moment the list seems satisfactory, but there is much room for expansion and refinement if necessary. Only a number of rather ordinary inorganic salts have been tested, and these were selected among chemicals which happened to be on hand already. Organic compounds have been avoided because of their volatility, odours, and chemical reactivity with the plastic tubing and dyes. N ot all toxic compounds have been avoided, however.
Table I includes solutions which are currently considered “ finished” , that is, ready for use in the ground temperature indicator. It must be mentioned that at least one complete winter season must elapse before a final evaluation may be made, and so the list must be considered tentative. This is not considered justification, however, for holding up this report in the meantime.
The listed combinations of dyes and freezing point determinants have been selected on the basis of tests on many combinations. It is believed that they will provide solutions which will last out a complete season without serious deteri oration. The custom, established with the frost depth indicator, of yearly solution change should be continued.
N ew solutions may be added to the “ finished” list only after some consider able testing. Tests, and related aspects, are discussed in many of the appendices, but most notably in Appendix IV.
Types of ground temperature indicator
The T yp e i ground temperature indicator derived very directly from the construction of the frost depth indicator. It consisted of the standard clear plastic pipe, but inside this two tubes were stretched instead of one. These tubes were assembled coaxially or concentrically, that is, with a small tube inside a large tube. Consequently, the outer or larger tube, at least, had to be transparent in order that the occurrences within it could be observed. Furthermore, the outer solution had to be the one of the higher freezing point in order that clear ice would occupy the zone(s) of the instrument through which readings of the inner solution must be made. Polyviylchloride (pvc) tubing was selected for both the inner and outer flexible tubes within the instrument pipe, while, in the only full-scale example built, the outer solution was the standard methylene blue o °C indicator and the inner was a red solution containing a salt as a freezing point depressant. With the outer solution frozen, good vision to the inner was provided within the significant range, and the colour contrast between the two indicator columns was satisfactory. The method in general is probably quite sound, but rather inefficient in that it provides only two solution columns when other methods provide several more. It will be described further, however, because of the ideas which may be passed on for use in possible future develop ments, and because it is not unthinkable that the Type i instrument may in fact suit some purpose or other best.
Type 1 construction details
As in GandahPs frost depth indicator, it is necessary to maintain a central air column for the relief of freezing pressures within the instrument pipe. A cross-section of the completed instrument pipe proper would reveal the following components, beginning from the outer surface: first, the clear, rigid, acrylic plastic pipe (brand name: plexiglas) of outer and inner standard diameters 15 mm and 10 mm, respectively; second, an annular filling of the solution of higher freezing point; third, the outer, larger pvc tube (o.d. 9 mm, i.d. 6 mm); fourth, the inner annular filling of the solution of lower freezing point; fifth, the inner, smaller pvc tube (o.d. 5 mm, i.d. 3 mm); and sixth, the central air column, of 3 mm diameter. The pipe and tube sizes used as standard are all available “ o ff the shelf” in Stockholm. The annular films of indicator solution provided in the design are both of 0.5 mm average thickness.
No alternative to pipetting the solutions into one end of the instrument while the other end is kept plugged has been found, and the problem of air entrapment makes the pipetting a tedious job. A small quantity of wetting agent or even washday detergent might be used to help combat air entrapment, but adverse effects must be guarded against. Repeated stretching and releasing of the flexible tubing helps work the bubbles out, and vibration of the whole assembly might be of some help, as well.
Table I. Freezing Points
Solution
Freezing Temper
ature F), °C Remarks
Pure distilled water, H2O 0.0 Freezing temperature is fixed by definition of
the centigrade of Celsius scale, allowing the calibration of the test thermometer.
Pure heavy water, D2O + 3.8 Value from references 8 and 9. Not checked
in this study. Mutual D2O — H2O solu
tions of various propor tions
Continuous range 0 to + 3.8
See discussion in Appendix V. The exact relationship of solution proportions to temper ature is given in Ref. 9.
Distilled water with 0.05 °/o methylene blue dye
0.0 With test instrumentation, lowering of the
freezing point began to be detectable after about 90 % complete freezing. The lowering then was on the order of o.oi°C. Dye stains tubing.
Distilled water with 0.05 °/o xylene cyanol FF (blue) dye
0.0 Similar to methylene blue but does not stain
tubing.
Potassium permanganate, KMnCh, in H2O, saturated.
— 0.6 Deep purple or violet solution, strongly oxidant. Produces brown stains. See also Figure 9.
Sodium pyrophosphate, Na*P207, in PRO, saturated.
— o.6(2) Same eutectic freezing point was found for solutions prepared from both hydrous (* 10PRO) and anhydrous forms.
Potassium perchlorate, K C103, in H2O, saturated.
— 0.7 <2> Strong oxidant in solid form, but behaves well in aqueous solution with xylene cyanol FF dye. Colour change is weak. Potentially useful, but needs a new dye and an accurate freezing point test.
Potassium bichromate, K 2Cr2C>7, in H2O, saturated.
—0.8 Poisonous. Golden solution (from red crystals),
forms a very useful indicator solution with erioglaucine (alphazurine G) dye with a red- green colour change upon freezing.
Ammonium oxalate, NPPCO2, in H2O, saturated.
— 0.9 C) See also Figure 8.
Potassium sulphate,
K2SO4, in H2O, saturated. — i-7 Used with neutral red dye in ground temperature indicators. Produces good red-white colour change upon freezing.
Potassium ferrocyanide, KJFe(CN)e, in H2O, sat.
Solution Freezing Temper ature P ) ,° C Remarks Cupric sulphate, CuSCh, in H2O, saturated.
— 1.9 (2) Moderately poisonous. Produces dark red solu tion with neutral red dye which ages well, freezes to light pink ice. This solution seems potentially useful.
Sodium carbonate, “ soda” , N a2C03, in FLO, saturated.
— 2.2 (approxi
mately)
A reliable freezing point for this solution could not be found by present test methods; nor could a suitable dye.
Sodium bicarbonate, “ baking soda” , NaFICOs, in H2O, saturated
— 2.4 (approxi
mately)
The freezing point of this solution seemed even more vague than that of the “ soda” solution. It was noted that crystals from the frozen solution seemed to differ in form very con siderably from fresh crystals.
Potassium ferricyanide, K 3Fe(CN)6, in H2O, saturated.
— 3-7 Moderately poisonous. Produces a distinctive
colour change with erioglaucine (alphazurine G) dye. Used in ground temperature indicators to replace the unsatisfactory soda solution used in the prototype instrument.
P) In contrast to the uncorrected figures which will be shown in Figures 14 and 15» Appendix VI, the freezing temperatures listed here have been corrected for a measured calibration error in the thermometer of + o.o6°C at the freezing point of pure water. (2) This temperature was measured by a quick method in which the thermometer was
refrigerated along with the solution specimen. An attempt has been made to estimate the required calibration correction, but a better test would be required before field use of this solution.
The sealing of the ends of the instrument must be accomplished by some sort of thickening of the flexible tubes to fill the ends of the rigid plastic pipe and to wedge fast, providing end anchorages for themselves.
In Gandahl’s frost depth indicator, combined seals and anchorages are provided by means of tapered rigid plastic stoppers which are used to expand the latex rubber tube’s ends. Direct contact between the latex tube and the plastic pipe results. Tensile stress in the latex tube holds the contact firm.
In the case of the Type 1 ground temperature indicator, there are two tubes, not one, and they are not of latex rubber but of pvc plastic. The plastic is not as easily stretched during the assembly of the instrument, but on the other hand is subject to considerable long-term deformation, with loss of stress. It becomes relatively rigid at low temperatures, but can still accommodate expansions such as those caused by freezing of its contents at temperatures near o°C . A useful feature of this plastic is that it may be softened and re-moulded rather readily with the application of heat. This allows a plug to be moulded directly onto the tubing.
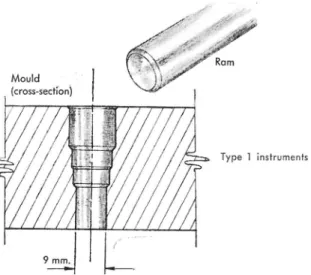
A convenient plug mould for use at one end of the instrument is shown in Fig. 1. It may be produced from scrap metal stock in a few minutes with the aid of a drill press and possibly a lathe. It has been designed for use with
Fig. i. The simple mould and ram for forming a plug and sealing the tube ends of Type i ground temperature indicators. A series o f drills has been used to approximate an internal taper in the mould. When the tube ends are heated and rammed into the mould, they take on the tapered shape which allows them to seal one end of the instrument (see text). D rill sizes are not critical.
the pipe and tube sizes which have already been specified, but modifications obviously would be simple. A plug of solid pvc material may be moulded on the ends of the flexible tubes as follows: The two pvc tubes are assembled coaxially and their ends are brought even with one another and pushed through the mould to project one or two cm above its upper face. The mould acts as a heat sink in the operations which follow. The projecting tube ends are simultaneously heated until well softened; they may be held well above a sootless flame and temporarily withdrawn at the first signs of impending combustion. The softening process takes about a minute or longer because of the slow conduction of heat into the plastic. The ends are then drawn partly back into the mould, and the ram is forced in under firm hand pressure. After a few moments during which the heat transfers to the mould and ram, the plug will have formed and will be firm enough to be pushed from the mould. The separation may be facilitated by a thin film of lubricant on the mould, if necessary. A few preliminary practice attempts may be made with short scraps of tubing before full-scale operations are undertaken.
The moulding technique can be used only at one end of the instrument. The technique which will now be described may be used for the other end, or for both ends. First, the end of the smaller, inner tube may be plugged by forcing in a sphere or cylinder of approximately 4 mm diameter. This seals the central air column against the entry of dirt and moisture. Then a short section (one or two cm long) of any suitable flexible tubing may be stretched over the end of the 5 mm o.d. pvc tube, building up its effective thickness so that it will plug
the end of the 9 mm o.d. pvc tube. The latter plugging action is then effected, and another short section of a second, larger diameter tubing may be placed over the already built-up end. By now a sufficient quantity of material will have been built up that all openings at the instrument end will have been sealed.
The Type 1 instrument obviously gives a rather low return in terms of numbers of solution columns per unit of investment of time and material, in comparison with the later types which we will now look at.
The T yp e 2 ground temperature indicator retains the acrylic plastic pipe first used in the frost depth indicator, but abandons the coaxial-assembly approach in favour of a “ cable55 of small, equal-sized tubes each containing a different solution. These are pulled as a group through the plastic pipe, and sealed and anchored separately at both ends after filling. The T yp e 3 goes a step further and eliminates even the acrylic plastic pipe which, it was calculated, occupied no less than 5 5 .6 % of the cross-sectional areas of the earlier instru ments. A degree of longitudinal rigidity is given the Type 3 instrument by a nylon rod around which the “ cable55 of tubes is deployed, while its tubes are held in position by means of clear, waterproof, industrial-type plastic adhesive tape. The filling of the liquid columns for both Type 2 and 3 instruments is possible simply by sucking up the liquid drinking-straw fashion. Because of the length of the columns, however, the instruments should be kept horizontal in order to minimize the standpipe effect, and only the tips of the tubes should be turned down into the solution reservoirs. Pressure filling is also possible.
End-plugs for the individual tubes of both Type 2 and 3 instruments consist of little “ bullets55 made from wire (copper or, perferably, stainless steel) of a diameter slightly larger than the inner diameter of the tubes, so that they must be forced into place with some stretching of the tube walls. The bulges so caused in the tube ends provide means for anchoring the tubes using the same principle as the frost depth indicator, i.e by wedging tightly in holes through which the bulges cannot pass.
The T ype 1 and 2 instruments have the advantage of depth graduations on the acrylic plastic pipe, following the system devised for the frost depth indicator. Graduations can only be marked on the binding tapes of a T ype 3 instrument in its present rather undeveloped state.
Type 2 construction details
It has been found that three 5 mm outside diameter, or five 4 mm o.d. pvc tubes may be used in a Type 2 instrument with a reasonable degree of ease. The tubing probably can best be pulled through the acrylic plastic pipes in uncut loops, which are cut apart later to form the necessary separate lengths which will hold the indicator solution columns. As clear oil is to be added later in any case, some of it may be used at this stage as a lubricant if care is taken that it does not get into the future solution columns. The tube ends are to be anchored by means of brass anchor blocks such as the one pictured in Fig. 2.
Fig. 2. Anchor block and O-ring for anchoring the ends of the individual solution column tubes of the Type 2 ground temperature indicator, enlarged approximately 5 diameters. The tips of four of the tubes, plugged and expanded by stainless steel “bullets” , are shown as if seated after assembly of the instrument. In practice, the tube ends would be bound together with waterproof tape to keep the overall diameter under 15 mm. The tubes obtain good seating because of the angled, countersunk holes.
The ends of the acrylic plastic pipes should be pre-machined to match the anchor blocks, and the matching parts should seal tightly with rubber O-rings. The tight seal is necessary because the spaces within the instrument pipe and between the pvc tubes are to be filled with mineral oil, which must not be
H
•allowed to leak out into the installation hole. The oil should be of the best optical clarity; it enormously improves the visibility of the events within the completed instrument by cutting out internal reflections. The O-ring should be of rather soft, oil-resistant rubber.
The following sequence should be observed in the assembly of a Type 2 ground temperature indicator, if we may assume that all manufactured parts are already prepared:
1. Drop a string through the instrument pipe, and tie it to the appropriate parts of the pvc tubing so that the right number of loops can be drawn through the pipe. A llow for perhaps 10 cm extra tubing at either end of each separate solution column, for later manipulations. The cost of the tubing which will be wasted is negligible.
2. A pply a little oil in such a w ay as not to foul the solution columns, and draw the tubes through the pipe by means of the string. Keep them straight! 3. Remove the string, wipe the oil from the loop ends, and cut the loops so
as to form separate solution tubes with approximately equal amounts of surplus tubing. Push the clean tube ends through the O-ring and the anchor block holes.
4. Clamp the assembly in a horizontal position. Place a small reservoir of indicator solution under one end, and dip one of the individual tube ends into the liquid, fixing it there so that air cannot enter later.
5. Test the various tube ends at the opposite end of the instrument and, finding the right one, draw the solution all the w ay through the tube. C A U T IO N : Use a pipette between the tube ends and your mouth. Some solutions are poisonous; all are staining. (Flavours are, happily, unknown.) 6. Alternative to 4 & 5: Clamp assembly as in 4, but use a squeeze-type
filling bottle to force liquid in from one end of each tube. This is safer. 7. (For both alternatives.) Examine the solution column for air bubbles.
Solution may be forced out and re-introduced if necessary. Sudden surges of the flow often dislodge bubbles.
8. Clamp one end of each filled tube. This is sufficient to stop any flow, regardless of assembly orientation. Plug the other ends with “ bullets” , and pull them up close to the anchor block, which should not yet be seated in the pipe end.
9. Unclamp the assembly, turn it into a vertical orientation with the plugged tube ends downward, and pour oil into the upper end with the aid of a small funnel or other instrument. The oil will run slowly downward between the pvc tubes, displacing the air. The air escapes through the opening which has been allowed at the lower end of the instrument. Before the last bubble has been displaced, however, perhaps 100 ml of oil will have run through the pipe. A dish should be arranged below the instrument to catch this.
10. When the instrument is satisfactorily filled with oil, draw upward on the clamped tube ends until the seals at the lower end of the instrument are
I 5
properly seated. Push the upper anchor block (and, always, its O-ring) into its seat.
1 1 . Stretch each pvc tube up through its hole in the upper anchor block, clamp it just above the anchor block, cut o ff the surplus tubing, insert a “ bullet55, and unclamp. The tubes should pull back and seat firm ly in the anchor block.
12. Complete the instrument by adding the screw top for field mounting. The question of the freezing expansion of the water content of the solution columns of the Type 2 instrument must be examined. To this end, we shall calculate the proportion of the cross-sectional area of the instrument pipe's contents which is occupied by indicator solution, assuming five 2 mm diameter solution columns.
Total cross-sectional area of the five columns = 5 j = 5 71
Total contained cross-sectional area of instrument pipe = n I — I = 25 n 2
Therefore, 2 0 % of the pipe is occupied by water. I f this expands 1 0 % on freezing, expansion volume = 2 °/o of pipe's volume, at maximum conditions when every column is entirely frozen. Complete freezing could happen with the instrument above ground. It is tentatively planned, therefore, to leave air in about the top 10 cm of the oil spaces at first.
Type 3 construction and possible development
The Type 3 ground temperature indicator may be made with six 5 mm o.d. pvc tubes or, apparently, eight 4 mm o.d. tubes grouped around the central nylon rod. The latter configuration has not yet been attempted. Fig. 3 shows how the tube ends may be anchored, and also shows how the field-mounting screw plug is attached to the upper anchor block. Figs. 4 and 5 show how the completed instrument may be made to look. A considerable struggle may be involved in trying to hold the loose tubes of the instrument in the proper order and to tape them into place. The main advice which can be given a would-be builder of a Type 3 instrument is, “ Get help". Development effort has been concentrated on the Type 2 instrument because it is easier for one man to build, is not subject to deterioration from dirt and moisture getting between tubes, under tapes, etc., and supplies enough solution columns for present purposes. The T ype 3 nevertheless has interesting potential, especially in view of its higher number of solution columns and its flexibility and hence resistance to breakage. It is thought that a very nice instrument could be made from specially formed multiple chamber tubing. It is imagined that it might be possible to order pvc tubing made with an outer diameter of 15 mm, having a ring of solution columns, spaced evenly, surrounding a central hole for a fairly stiff plastic rod. The double layer of tube-wall plastic where neighbouring
Fig. 3. Indicator solution tube plugging and anchorage details. The tube at left has been plugged with a bullet-shaped piece of stainless steel and may now be snapped into position, as illustrated by two other solution tubes already in place. Projecting below the end of the assembly at its center is a nylon rod. The screw plug from which the instrument is suspended, and which keeps dirt, snow, and water out of the installation hole in the ground is shown at top.
Fig. 4. The Type 3 ground temperature indicator may be rolled into a hoop for transportation. The mechanical pencil gives scale. Tube numbers are marked on the taped ends.
solution columns lie closest together in the present arrangement could be elimi nated, permitting a more efficient utilization of the available space. Furthermore, internal reflections would be eliminated. On the other hand, the cost of obtain ing such specialized tubing would probably be prohibitive.
No doubt other arrangements may be thought of, and some may improve on those described here. It is nevertheless hoped that the basic principles and some
Fig. 5. The location of a particular isotherm in the ground is shown by the position of the colour change observable in the upper solution tube of this Type 3 instrument. The solution in the left half of the tube is frozen.
G r o u n d s u rfa c e
G r o u n d te m p e r a tu r e , ° C
Fig. 6. Ground temperature curve obtained for 1 April, 1963, under a quiet park road near Statens Väginstitut’s headquarters in Stockholm, by means of a Type 3 ground temperature indicator. Only a few readings of this relatively new apparatus have been made, but this may be considered a representative result.
The portions of the curve marked A and B diverge from one another because of ambiguity in the determination of the freezing temperature of a saturated solution of soda, N a2C03. Because this salt crystallizes relatively slowly, the process cannot keep up with the quick laboratory test methods used; the test result depends on the test speed, and on other factors such as stirring of the crystallizing solution. Curve B is considered more likely than curve A, but in any case, a different solution will be used in future field investigations.
of the details reported herein will be useful and interesting to the reader whose problem is the measurement of ground temperatures in the vicinity of the frost line.
Field testing of instruments of this sort is, unfortunately, a highly seasonal activity. A small number of test results has so far been collected. Fig. 6 suggests the typical reading that has been obtained to date, and the quality of the results which are hoped for, for the future.
Appendices dealing w ith various freezing phenomena
Appendix I:Freeze-purification and freeze-concentration
The reader is probably sufficiently familiar with various crystallization processes, such as freezing, that a general treatment here is unwarranted. These Appendices will therefore discuss a number of phenomena related to the operation of the frost depth indicator and the ground temperature indicator, only. The first phenomenon is the most basic.
There is a strong tendency for many substances to dissociate themselves from other substances with which they may be intermingled in solution, when their molecules aggregate together in the geometrically regular forms known as crystals. The crystals of such substances therefore tend to purify themselves during the formative processes and thus to attain, as far as possible, lattice shapes that are regular and undistorted, without the lumps, bulges, twists and hollows we envisage in connection with molecules of foreign substances in crystals. Fortunately for the present study, water is one of the substances which tends to reject impurities when freezing. Upon turning to ice, water leaves the great bulk if not all of its dissolved contents to fend for itself. Solutes treated in this w ay may concentrate in whatever liquid remains in the system or, if necessary, may precipitate or bubble o ff as gases. It should be noted here, though, that many other substances, one or more of which may be present in the solution, are similarly capable of rejecting water molecules during their own crystallization; thus, many of the remarks which may be made about the freezing of the solvent (water) may be applied also to the precipitation of a solute (such as a mineral salt). The particular method of crystallization is unimportant in the discussion of the moment. We will nevertheless speak mainly of the freezing of water to form relatively pure ice. We will use the terms, “ freeze-con centration" to refer to the effect on the solute(s), and “ freeze-purification" for the effect on the water. “ Freeze-concentration" also describes the effect on the remaining liquid.
These effects are widely used in industry for purifying or concentrating many substances, from raw metals to sea water to germanium and silicon for incorporation into the hearts of transistors and related devices.
The colour changes which occur in the solution columns of the frost depth indicator and the ground temperature indicator depend upon these phenomena, as does the freezing-temperature regulation in indicator solutions containing freezing point depressants. These phenomena also cause the expulsion of dissolved air from the solutions, with the result that an appreciable volume of air will be found inside the columns when the ice melts from them in the springtime.
During the freeze-concentration of a solution, the freezing temperature is depressed as the concentration proceeds until the latter reaches a terminal value (saturation) and precipitation begins. It is perhaps a popular misconception that handbook values of fieezing temperature vs. concentration may be relied on regardless of the progress of the freezing process. Actually, the handbook values may be correct insofar as the initiation of crystallization is concerned, but the actual freezing temperature drifts downward thereafter until saturation is encountered.
This drift is halted or avoided if the freezing takes place at saturation. Thus the freezing temperature may be determined precisely by ensuring that the solution is saturated throughout the freezing process. It remains mainly to find solutions which become saturated at appropriate concentrations so that usable fixed temperatures result, and which are also suitable from other points of view.
Above the freezing point, saturation concentrations are generally variable with temperature. Since saturated solutions have fixed freezing temperatures, however, the freezing point imposes an end-point on the saturation-concentration vs. temperature curve; temperatures which might lie further along the curve are made unavailable by the fixity of the freezing point. In other words, the saturation concentration and the freezing temperature of a solution fix each other. Under these conditions, a very stable situation results as long as freezing continues.
This point of stable concentration and temperature is called the eutectic point, and the mixture of crystallized solids which is produced during the removal of heat from the system is called the eutectic mixture. As the latter term implies, the intercrystallized solid mixture is standardized for any given solution insofar as overall composition is concerned. It is naturally possible to take a small enough sample to show any desired deviation from the eutectic composition, however. In passing, we may note that eutectics play a prominent part in the metallurgy of alloys.
It has been mentioned that some solutes may respond to freeze-concentration by bubbling o ff as gases. In the case where the solute is a liquid of limited solubility in the solvent, it may tend to flow from one area to another during the freezing process (liquid solutes have been avoided in practice in the present study). Even solid crystals may move by falling, under the pull of the earth’s gravitational attraction, to the bottom of the solution’s container unless they are mechanically locked into position at their place of formation. It may there fore be questionable whether all solutions freezing at the eutectic point produce mixtures which retain the eutectic composition in the long run. I f we cannot rely on the maintenance of eutectic mixtures, we will not be able to assume that eutectic solutions will be produced again upon the melting and redissolving o f the mixtures we happen to get. Until it can be shown in actual field use that this problem does not affect the ground temperature indicator, it must be admitted that some of the indicator columns may not show the positions of the same isotherms in the spring of the year, during the thaw, as they did earlier in the winter during the advance of the isotherms into the soil. This disadvantage may or may not prove to be significant in extent, but for present purposes at
Statens Väginstitut at least the instrument is considered quite satisfactory for the reason that it is to be used for studying the period of frost advance, primarily. In any case, a number of the indicator solution columns operate without dependence on eutectics, and these are expected to function properly in the springtime.
The use of air-free solutions involves many complications which can hardly be justified in view of the fact that air creates only a minor nuisance in practice, to learn what we can. An air-saturated solution contains about 1.8 ml air per 100 ml water at room temperature, or about 3 ml air per 100 ml water at o°C . This means that about 0.004 g air may be dissolved in 100 g water at o°C . An impurity at 0.004 °/° concentration (max.) will have no measurable affect on the freezing point. There is, however, a noticeable volume of air, evolved by freeze-concentration, which finds its w ay to the top of the indicator solution columns in the springtime. This air should cause no concern, as the entire solution should be scheduled for renewal before the next frost season in any case.
The formation and movements of microscopic air bubbles give some interesting clues as to the nature of the phenomena affecting the frost depth indicator and the ground temperature indicator, as Fig. 9 will suggest. The photographs shown were made with the aid of an apparatus designed by S. Freden of the Statens Väginstitut staff. This apparatus consists of an assembly which looks like a double-glazed, small port-hole window with refrigerated alcohol circulating between the panes and a rim on one side standing above the glass face. This apparatus is laid level on the slide bed of a microscope (preferably binocular), the upper face is covered (for certain purposes at least) with oil which is retained by the rim, the oil is chilled and stirred to uniformity (if desired), the specimen to be observed is put into the oil, and light is passed upward through the whole apparatus and the specimen, to the lenses of the microscope.
The specimens for observation may be single drops injected into the oil, slivers of frozen “ solution” (more accurately described as mixtures), or, as in the case of Fig. 9, small plastic bags of solution. I f the oil is viscous and dense enough at the test temperature, it is possible to have the specimens “ float” within the oil layer for some time, while perhaps even better results in this direction might be possible with some thixotropic preparation. This is mentioned because the setup may obviously be of interest in itself, outside the present connection. Great refinement was not required here, however.
During the freezing of an aqueous solution containing air, there may be no sign of the air at first. I f the solution is not saturated with air, freeze-concentra- tion will proceed for a time without the formation of any bubbles. A t some stage, however, saturation w ill be reached at least locally, and further ice formation will be accompanied by the evolution of tiny bubbles of “ precipi tated” gases. It is instructive to watch with a binocular microscope as the bubbles form, often between parallel crystals which are growing laterally and preparing to coalesce. In such situations the increase in volume in the confined space produces a local pressure which often causes the bubble to take tortuous
escape routes between the forming crystals. This indicates something of the degree of freezing which has taken place, and of the forms of the crystals. The final escape to the top of the liquid in the container (be it the solution column of an instrument or merely a little plastic bag under the microscope) must in general wait until the hindering ice melts when heat is later restored to the system.
Air, then, is a low-solubility substance usually present in indicator solutions, and is harmless but interesting in microscopic observations. The indicator dyes, on the other hand, are usually highly soluble, and therefore do not in general reach solubility limits at normal ground temperatures. They tend, instead, to remain in solution in very small proportions of the total original mass and thus to cause lowering of the freezing point of the solution remnants through freeze- concentration. The first one-hundredth of a degree of lowering of the freezing point occurs only after about 90 % of the total original solution has frozen, and so the freezing temperature of the whole is essentially unaffected by the dye, when the latter is used at the usual concentration of 0.05 % by weight in the water going into the solution.
It is partially thanks to their solubility that dyes may be used in the indicator instruments. Being in solution, they are mobile and able to concentrate very strongly in selected areas such as open pores and thin liquid layers between crystal faces. It may be supposed that dyes of low solubility might precipitate throughout the ice mass in such a diffuse w ay as to present nearly the same appearance as the original liquid solution. Instead, however, a well-chosen dye migrates so strongly toward certain areas during the freezing process as to leave the other areas, which are much the larger, virtually free of dye and hence virtually colourless. The clear ice which may be so formed behaves like the panes of a window, while the dye concentrations behave as the frames; the clear “panes55 dominate the overall impression. This is the mechanism, then, which produces the indicator solution colour changes upon freezing. In some cases, however, other agents which we shall discuss next may have modifying effects because of their own coloration or because of some chemical interaction with the dyes with which they may be combined. Such agents are not used except in solutions of freezing point lower than o°C .
The agents in question are those employed as freezing point depressants. It has been pointed out already in this Appendix that the amount of freezing point depression will not be stable unless the depressant is at saturation concentration during the freezing process. Without a stable freezing point, the whole utility of an indicator solution column is obviously lost; more than that, it can be very difficult even to read the instrument regardless of accuracy considerations. This is because no definite edge, where liquid stops and solid starts, can be seen. The thermal regime in the ground involves such gentle thermal gradients that the proportions of ice to water will vary only slowly and vaguely over a considerable length of a column filled with an unsaturated depressant indicator solution. Saturated solutions, on the other hand, give not only stable freezing points but also, in general, sharply defined limits of freezing in the instrument columns.
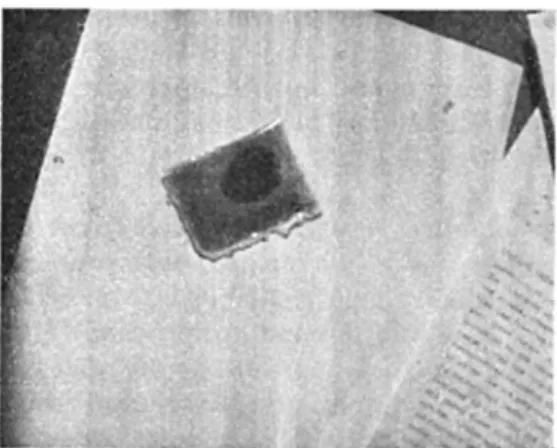
Fig. 7. A plastic bag approximately 6 V2 X 4 V2 cm in size, illustrating the colour change of its contents (“ brilliant green” indicator dye solution in this case) upon freezing. Unfrozen solution occupies the dark area, while the remainder of the bag is filled with frozen solution. Vertical streaks were caused by low-angle winter sun striking through window glass. Ordinary typing at right gives scale.
Appendix I I :
Some microscopic observations during the chilling of solutions
An apparatus for the creation of freezing conditions under the microscope was described briefly in Appendix I. Some of the phenomena which have been observed by this means and which are basic to the thorough understanding of the principles of operation of the ground temperature indicator will be discussed in this Appendix.
The usual sort of solution specimen for microscopic observation in this study is shown in Fig. 7. In this photo, as in Fig. 5 (and Fig. 4, if one looks closely near the right-hand edge of the photo) the colour change owing to the freezing o f the indicator solution is visible. Such plastic-bag specimens are perhaps crude in appearance, but much may be learned during their microscopic study, especially with the binocular microscope. The events during the freezing process are most evident when seen in three dimensions, particularly in view of the fact that the clarity of the components allows deep observation within the specimen. Our photographs are, unfortunately, only two-dimensional.
Even with only slight enlargement, as in Fig. 8, we begin to see something of the nature of the problems and phenomena involved. As the subscript points out, the dye is precipitating from the solution during the cooling process. This is one o f the ways in which an unsuitable combination of dye and freezing temperature depressant can manifest itself: the only course of action in such cases is to find a better combination, for the precipitation will only get worse with time and with lower temperatures.
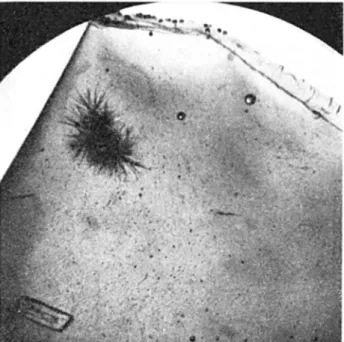
Fig. 8. Precipitation in this saturated solution of ammonium oxalate, (NIHU)2C2Ch, has begun even before the initiation of freezing because of lowering of the limit of possible concentration at lower temperatures. The precipitate has formed the crystal clusters which resemble burrs or sea urchins. Below them is one of the original crystals left over from the preparation of the solution. The black speckles are composed of precipitated dye (neutral red) which had originally entered solution at room temperature. Near the top of the photo is the edge of the plastic bag containing the sample. Magnification 7 diameters.
Fig. 8 also lends substance to the discussion in Appendix I on eutectics. Here we see the crystallization of a substance which is present in greater than eutectic proportions, during the cooling of the solution from room temperature. The solution temperature at the time of the photograph may have been in the vicinity of io °C ; before freezing actually began, the appearance of the specimen was completely altered by a heavy accumulation of precipitated salt crystals so that the onset of ice crystallization was almost entirely masked. This course of events illustrates the danger in using solutions which are saturated at room temperature, for had this solution been used in a narrow solution column of a ground temperature indicator, the column would probably have been choked from top to bottom with the crystallized salt, regardless of the position of the frost line. Nevertheless, the composition of the liquid phase at the point of freezing would be that of the eutectic. The eutectic composition m ay be described in the present context as that proportion of solute to solvent toward which the composition of a given solution will migrate if it is sufficiently chilled, the mechanism for migration being the crystallization, or in general the precipitation from the solution, of whichever member of the solution is over abundant; the eutectic composition will be reached eventually during the
Fi^. 9. A eutectic mixture of ice and potassium permanganate (black) crystals created by the freezing of a saturated KMnCb solution. Out-of-focus crystals are outside the depth of field of the microscope-camera system. Thick black bar at the bottom of the picture is a larger crystal which must have existed before the actual freezing took place in this region of the solution; the smaller crystals formed more suddenly as a result of freeze-concentration and precipitation, and are hence less developed. Magnification approximately 100 diameters.
freezing of any solution, except in the limiting cases where either the solute or the solvent forms 100 °/o of the original specimen, and once reached, the eutectic composition will be held as long as freezing continues; that freezing will proceed at a constant temperature by virtue of the constant composition of the solution being frozen. It is also a fact that the eutectic freezing point is the lowest possible for any solution of two given components. A ll these remarks presuppose, however, that we are speaking of aqueous and similar solutions of simple inorganic salts or similar substances, that there is no undercooling or super- saturation, and that the removal of heat is proceeding slowly enough to allow all other processes to keep pace.
Fig. 9 is an actual photograph of a frozen solid mixture of eutectic propor tions, enlarged approximately 100 diameters. The absence of dark crystals from parts of the plane of photographic sharpness may be attributable in part to the irregular surface of the specimen, a rough chip from a larger sample. The area on the right is probably most typical.
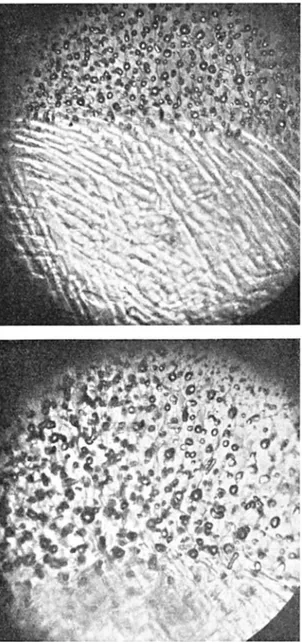
Fig. 10 shows two quite similar views of actual freezing in progress. A fairly definite line divides the view in both photos. This line is a front of complete (as opposed to partial) freezing. The areas below the line in both cases contain a micro-skeleton of ice, and also a considerable proportion of liquid water, as an aftermath of undercooling (to be discussed in Appendix V III), and so are partially frozen; the areas above the lines are virtually fully frozen, except that a little liquid containing the now concentrated dye remains. The
complete-Fig. io. Two views of complete-freezing fronts advancing through a formerly undercooled solution of neutral red indicator dye in distilled water. The micro-skeletal structure produced by sudden but partial freezing following undercooling occupies the lower parts of both photos. The completely frozen portions are most distinguishable in these photos by the air bubbles evolved as a result of freeze-concentration. Intercrystalline dye concentrations also show in the upper photo as dark lines, and in the lower as irregular patches. Crystal faces are therefore shown in edge and face views, respectively. Enlarged about 100 diameters.
freezing fronts are advancing down the page, the heat flow being in the reverse direction. Very little water actually is involved in the micro-skeleton structure, and so the partially frozen solution looks to the naked eye rather like the unfrozen solution; it is at the complete-freezing front that a colour change is to be noted. These photos were made in transmitted light, and accumulated air bubbles have made the upper areas seem dark. Actually, the upper areas were cleared of their dye, to a large extent, by the freeze-purification process, and became lighter under normal, incident light.
It might well be explained that the depth of field of the camera’s focus can be partially responsible for the impression one might get that considerable ice exists ahead of the complete-freezing front. The latent heat of fusion of water is 79.70 times the specific heat (Eshbach: Handbook of Engineering Funda mentals, 2nd. Ed., Wiley, New York, 1962), however, and this means that approximately 80 units of water must be warmed by i ° C in order that 1 unit shall be turned to ice upon the freezing of an undercooled specimen. In other words, if the temperature is — i° C , only 1.25 % of the specimen can suddenly freeze. A t — 5 °C the proportion is 6.25 % , and so on. This general relationship will be borne out in Appendix V I, where curves of temperature vs. time of actual freezing tests w ill be presented. I f heat flow is assumed to be constant with respect to time, it is easy to conclude from the results of the experiment with pure water (Fig. 14) that undercooling occurred during appoximately 1 0 % of the total time the temperature was at or below o °C , before total freezing was accomplished, and that the sudden freezing therefore involved 1 0 % of the total water being suddenly converted to ice. The apparent peak of undercooling was reached at a temperature about — 6.2 5 °C . A t the theo retical ratio of 1.25 % per °C of undercooling, this temperature is capable of producing approximately 8 % ice upon sudden freezing. In view of the assump tions and approximations in our calculations based on observations, the agree ment between the figures of 8 °/o and 1 0 % is entirely satisfactory. The experi mental value would, in fact, be approximately 8 °/o if the temperature-vs.-time curve were straightened out at the left-hand side of Fig. 14, where a curve was found below o °C . This confirms, then, that only a few per cent of the water ahead of the complete-freezing fronts in Fig. 10 can have been frozen when the photos were taken.
The freezing of undercooled water occurs very quickly, and it has not been possible to record the process without acquiring special equipment. Since the present purpose is to develop a ground temperature indicator, such a costly (and time-consuming) digression has been avoided. It has, however, been possible to observe and sketch the freezing process in undercooled solutions of lowered freezing points; here the action is very much slowed down and is therefore easily observable, although there are other effects which make the transferral of conclusions to the case of pure water inadvisable. Fig. 1 1 is a sketch based on a composite impression of several observations of the initial-freezing front as it advances through undercooled solutions containing freezing point depressants. The crystal tips appeared to advance at speeds on the approximate order of 0.1 mm/sec. (or, at the scale of the sketch, about 10 mm/sec.). This rate of
Pig. i i . This sketch, representing a view magnified about 100 diameters, is a composite impression gained in the observation of the progress of partial-freezing fronts through several undercooled solutions which contained freezing point depressants.
growth is to be compared to natural-scale rates of some centimeters per second in pure water undercooled to the same degree. There is also a notable effect on the ice structure, which is made finer by the freezing point depressant. These effects probably both have to do with the discrimination between water and depressant molecules during the crystallization process, and with modifications in the energy transformations which must take place.
The fine dendritic crystal pattern is reminiscent of the growth of a spruce tree having a very strong tendency to branch at 6o° angles. Each new crystal tip is potentially the equal of the "leader” in the sketch, and if the page is turned 6o° , it will be seen that several new "trees” are in fact developing. By the time the undercooling has been eliminated by the crystallization, the "forest” of various families of "trees” will be very tangled. On the macroscopic scale, we would describe the system as "slush” at this stage.
In the case of an unsaturated solution of a highly soluble material in water, the growth will change character as the freeze-concentration process continues. For a given solution temperature, the growth will become slower and slower, and the crystal form may become distorted or other crystal systems may appear, until finally growth will stop when the remaining solution achieves an equi librium composition according to its temperature. The effect is very reminiscent of the stunting of trees at the treeline of a mountain.
This microscopic view helps explain the absence of a marked frost line in indicator instruments where solutions of the latter character are employed. On a macroscopic scale, the first ice from such a solution may seem normal, but it becomes more and more “ slushy” as the freezing limit is approached. The more slushy the mixture, of course, the more unfrozen solution is present.
The selection of chemically suitable indicator solutions containing freezing point depressants
N o solution should be put into use in a ground temperature indicator without: preliminary testing. Perhaps one solution in ten which might be made up for the purpose will actually prove satisfactory, although it certainly should help to improve this score if one makes use of the information and suggestions contained in this paper. The purposes for which a frost depth indicator may be installed in the field will be thwarted and an opportunity will be lost if the solutions used are unsatisfactory. During the testing the following general observations should be kept in mind:
1. Solutions which seem somewhat unsatisfactory at first will probably grow more so with age and lower temperature. I f the slightest bit of a given indicator dye refuses to dissolve in a given solution, or if it precipitates out after dissolving, the problem (as illustrated in Fig. 7) will become worse later, not better.
2. N ot only pH (acidity or alkalinity) but also oxidizing activity need to be considered in the selection. Dyes should be chosen to give the desired colours at the pH values expected, while the most tractable solutions seem to have pH values near 7, i.e. seem to be nearly neutral in reactivity. Danger to face, hands, and clothing during the handling of the solutions must be taken into account, as must any effects upon the instrument’s tubing. [Eosine red dye, for example, gives a relatively weak but very persistent orange-red colour which permanently stains polyvinylchloride (pvc) tubing and makes it difficult or impossible to distinguish colour changes.] Freezing temper ature depressants which are active oxidizers may bleach or otherwise alter dyes, and may also affect the materials of the ground temperature indicator. N aturally, poisons should be pipetted only with precautions against accidents in which some solution might be ingested.
3. Alteration of the colour of a dye by a depressant is not always bad. An interesting case occurs when a solution is made with potassium bichromate, K 2C r2
0
7, and the oxidation-reduction indicator erioglaucine (alphazurine G). The bichromate consists of orange-red crystals, and forms a golden coloured solution; the dye is a purple powder when dry, and forms a somewhat indigo blue solution in distilled water. A solution containing both materials (saturated with K 2C r20
7, and containing 0.05 % dye by weight o f water) is green at first, as one might expect owing to the colours of the primary solutions; this colour alters through bronze to red after a time, however, apparently because of the oxidation of the dye. Upon freezing it becomes green once more, offering the most distinctive colour change yet encountered in this study, that is, a change from red to green upon freezing. For this reason, this particular solution is highly regarded in spite of the fact that it is toxic. This solution is not the only one in which chemical reactions o fsome sort take place without apparent detriment, but reactions in general must be regarded with some suspicion.
4. Freezing point depressants which are chemically related to one another tend to have common effects upon the various dyes. As an example, it may be remarked that most, if not all chlorides cause precipitation of neutral red dye, and that first indications are that the same is true of other halides (iodides, etc.).
5. The following points should be considered if new dyes are to be purchased: a. Solubility of the dye in water (some are only soluble in other sub
stances).
b. Colour at the desired pH range (near pH = 7).
c. Local availability and price. (There is no guarantee that expensive dyes will work better than cheap ones in the ground temperature indicator.) 6. A corollary of point 1 in this list is that usable combination of freezing
point depressants and dyes must be water soluble, regardless of which component is added first to the water. In every case, however, it is necessary to follow a certain general routine in order to avoid overshooting when adding a given component. Thus, all components should be weighed out separately before combination. The dye must be weighed much more accu rately than the water or depressant, and requires the use of a sensitive balance. The alternative to adding the right quantity of depressant for solution saturation near o °C is to saturate the solution at room temperature and then chill it and remove the precipitate; by this means one weighing may be avoided at the expense of other work.
A ppendix IV :
Some indicator solution test methods
The methods to be described here are not in any sense specified for the testing of solutions for the ground temperature indicator, and in some cases might not suffice to prove the usefulness of given solutions. It is hoped, however, that their descriptions will suggest to the reader how the testing of solutions has been performed in the past and how he may begin, if necessary, toward future developments.
The most positive and least efficient test method for solutions is their use in actual field instruments. Because of the fact that winter temperatures are required for the freezing of any solution to be used, with the possible exception of high-concentration heavy water solutions (see Appendix V), this method is in any case only seasonally possible.
An artificial wintertime ground temperature regime may be set up in the laboratory. For this it is necessary to produce a long, close-fitting receptacle for the ground temperature indicator instrument, and to create in this a dif ference in temperature between the two ends such that the thermal gradient, or slope of the temperature curve between the two ends, will be as low and