Marine litter in Sweden
A study for the Economic and Social Analysis of the Initial
Assessment of the Marine Strategy Framework Directive
Marine litter in Sweden
A study for the Economic and Social Analysis of the Initial Assessment of the Marine Strategy Framework Directive
Enveco Environmental Economics Consultancy
(Gerda Kinell and Tore Söderqvist)
DHI Sweden
(Patricia Moreno-Arancibia, Olof Liungman and Nick Ahrensberg)
Swedish Agency for Marine and Water Management, report 2012:3 Havs- och vattenmyndighetens rapport 2012:3
Havs- och vattenmyndigheten Datum: 2012-09-06
Ansvarig utgivare: Björn Risinger ISBN 978-91-87025-03-7 Havs- och vattenmyndigheten www.havochvatten.se/en/start.html
Foreword
The marine waste found on beaches and in the water along the Swedish coast each year is a major environmental problem. The purpose of this report is in part to describe the extent of the problem in different areas in terms of quantity and composition, and also to describe the impact on marine life and people who spend time on or by the sea.
Within Europe, the efforts to implement new legislation around the marine environment have begun in earnest. In order to gather all maritime activities into a single framework, the EU has formulated a maritime strategy designed after three main directions: the Common Fisheries Policy, marine spatial planning, and common environmental legislation for the marine environment. The common environmental legislation has been formulated within the EU Marine Strategy Framework Directive (2008/56/EG) which was introduced into Swedish legislation through the Marine Environmental Regulation (SFS 2010:1341).
In Sweden, marine issues received a new home on 1 July 2011 with the creation of a new, central administrative authority, the Swedish Agency for Marine and Water Management. The new agency will use an integrated approach in working with issues pertaining to water, marine, and fisheries management. The introduction of the Marine Strategy Framework Directive (MSFD) in Sweden and the development of marine spatial planning will become central to operations in the coming years.
As a first step in Sweden’s work with MSFD, an initial assessment of the marine environment’s status has been conducted and assembled into “Good
Environmental Status 2020 – Part 1: Initial Assessment of the State of the Environment and Socio-economic Analysis.” As the name suggests, the assessment gives an overall picture of the current state of the environment. It also describes the socio-economic importance of the different activities and operations currently in progress in marine areas as well as the stresses they generate on the ecosystem.
The report “Marine Litter in Sweden” is an important part of the documentation produced by the Swedish Agency for Marine and Water Management for the initial assessment. The connection made in the report between marine waste and related ecosystem services provides a good overview of the impact on the marine ecology while it illuminates the sea’s importance to human activities such as recreation.
Förord
Det marina avfall som hittas på stränderna och i vattnet längs de svenska kusterna varje år utgör ett stort miljöproblem. Syftet med den här rapporten är dels att beskriva omfattningen på problemet i olika områden i termer av
kvantiteter och sammansättning, och dels att beskriva de konsekvenser som det ger upphov till för livet i havet och för människor som vistas på eller vid havet. I Europa har arbetet med att genomföra ny lagstiftning på havsmiljöområdet inletts på allvar. Med syfte att samla all maritim verksamhet i ett och samma ramverk har EU formulerat en maritim strategi som utformats efter tre huvudriktningar; gemensam fiskeripolitik, fysisk planering till havs samt gemensam miljölagstiftning för den marina miljön. Den gemensamma miljölagstiftningen har formulerats i Havsmiljödirektivet (2008/56/EG) som omsatts i svensk lag genom Havsmiljöförordningen (SFS 2010:1341).
I Sverige fick de marina frågorna en ny hemvist 1:e juli 2011 genom inrättandet av en ny central förvaltningsmyndighet, Havs- och vattenmyndigheten. Den nya myndigheten ska arbeta på ett integrerat sätt med vatten-, havs och fiskförvaltningsfrågor. Införandet av havsmiljödirektivet i Sverige, samt
utvecklingen av den marina fysiska planeringen kommer att vara centrala delar av verksamheten under de kommande åren.
Som ett första steg i det svenska arbetet med Havsmiljödirektivet har en inledande bedömning av havsmiljöns tillstånd gjorts, God miljöstatus 2020 –
Del 1: Inledande bedömning av miljötillståndet och socioekonomisk analys.
Som namnet antyder ger den inledande bedömningen en bild av det nuvarande miljötillståndet. Den beskriver också den samhällsekonomiska betydelsen av olika aktiviteter och verksamheter som pågår i våra havsområden idag, samt den belastning på ekosystemen som nyttjandet ger upphov till.
Rapporten Marine litter in Sweden är en viktig del i det underlag som tagits fram av Havs – och vattenmyndigheten för den inledande bedömningen. Kopplingen som görs i rapporten mellan marint avfall och berörda ekosystemtjänster ger en bra bild över påverkan på den marina ekologin samtidigt som den belyser havets betydelse för mänskliga aktiviteter som exempelvis rekreation.
INNEHÅLL
0 SUMMARY ... 7 1 INTRODUCTION ... 9 1.1 Background ... 9 1.2 Methodology ... 11 1.3 Definitions ... 12 1.3.1 Marine litter ... 121.3.2 Additional definitions used in the survey ... 12
2 MARINE LITTER:STATUS ... 14
2.1 Literature review ... 14
2.1.1 Litter on the coast and in the sea ... 14
2.1.2 Micro-particles ... 22
2.1.3 Marine litter ingested by marine animals ... 23
2.2 Results from the survey ... 24
2.2.1 Marine litter caused by Swedish organizations ... 24
2.2.2 Marine litter affecting Swedish organizations ... 24
2.3 Discussion ... 26
3 IMPACTS OF MARINE LITTER ON ECOSYSTEM SERVICES ... 29
3.1 Impacts of marine litter on supporting ecosystem services ... 29
3.2 Impact of marine litter on regulating ecosystem services ... 30
3.3 Impact of marine litter on provisioning ecosystem services ... 31
3.4 Impact on cultural ecosystem services ... 32
3.5 Summary ... 33
4 POLICY INSTRUMENTS ... 35
4.1 Current policy instruments ... 35
4.1.1 International/Global ... 35
4.1.2 European Union ... 36
4.1.3 Regional ... 37
4.1.4 National ... 37
4.1.5 Other policy instruments ... 37
4.1.6 Results from the survey ...38
4.2 Effects on sources of marine litter ... 40
4.3 Potential policy instruments ... 40
4.3.1 Results from literature review ... 40
5 FORECASTED DEVELOPMENT OF MARINE LITTER ... 42
5.1 BAU ... 42
5.1.1 Results from the survey ... 42
5.1.2 Results from literature ... 44
5.2 Introduction of new policy instruments ... 46
5.3 Effects on the provision of ecosystem services ... 48
5.3.1 Following from BAU ... 48
5.3.2 Following from the introduction of new policy instruments ... 48
5.4 Discussion ... 49
6 COST OF DEGRADATION ... 50
6.1 Benefits of reducing marine littering ...50
6.1.1 Results from literature ...50
6.1.2 Results from the survey ...50
6.1.3 Benefits of reduced marine litter related to the provision of ecosystem services ... 51
6.2 Costs of marine litter ... 52
6.2.1 Results from literature ... 52
6.2.2 Results from the survey ... 53
6.2.3 Costs of marine litter related to the provision of ecosystem services . ... 55
6.3 Comparing costs and benefits ... 56
7 CONCLUDING DISCUSSION ... 57
8 REFERENCES ... 59
0 Summary
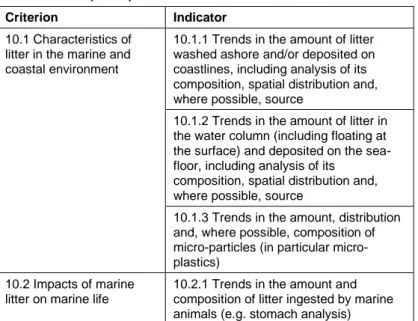
The initial assessment (IA) of the implementation of the EU Marine Strategy Framework Directive (MSFD) includes an economic and social analysis (ESA). This analysis is about two areas: (1) the use of marine waters and (2) the cost of degradation of the marine environment. Marine litter is one descriptor relevant for assessing good environmental status (GES) within the MSFD. Based on the ecosystem approach this report provides information on marine litter in Sweden involving status of marine litter (amounts, composition, sources etc.), how marine litter affects the provision of ecosystem services and costs and benefits connected to marine litter. The four indicators of marine litter listed in Table 0.1 were used for assessing the status of marine litter in Sweden. An aim was also to gather information on marine litter for the two Swedish
management areas the North Sea and the Baltic Sea.
Table 0.1. GES descriptor 10 on marine litter and associated indicators. Source: COM (2011a).
Criterion Indicator
10.1 Characteristics of litter in the marine and coastal environment
10.1.1 Trends in the amount of litter washed ashore and/or deposited on coastlines, including analysis of its composition, spatial distribution and, where possible, source
10.1.2 Trends in the amount of litter in the water column (including floating at the surface) and deposited on the sea-floor, including analysis of its
composition, spatial distribution and, where possible, source
10.1.3 Trends in the amount, distribution and, where possible, composition of particles (in particular micro-plastics)
10.2 Impacts of marine litter on marine life
10.2.1 Trends in the amount and composition of litter ingested by marine animals (e.g. stomach analysis)
This report is based on a literature review and a survey carried out in October 2011 to Swedish organizations causing marine litter or affected by marine litter. From the literature review and the survey it was evident that there is a general lack of data on the status of marine litter in Sweden as well as a lack of
socioeconomic data describing effects of marine litter. The literature review and the survey also show that marine litter is an urgent environmental problem that causes negative effects on the provision of ecosystem services and causes costs to affected organizations and to society as a whole.
The lack of data on marine litter might be explained by the fact that there is no uniform way in which marine litter is monitored and measured in Sweden. The data found of amounts of marine litter in Sweden only covered the coast of the North Sea and no data were found for the coast of the Baltic Sea. Data on composition of litter showed that the litter commonly consists of plastic, packages, oil cans and fishing equipment etc. The most important sources of marine litter are both based on land and at sea and involve the fishing industry, shipping sector, tourism sector and other recreational activities.
Several ecosystem services are judged to be affected by marine litter including supporting, regulating, provisioning and cultural ecosystem services. There are however several policy instruments in place for handling marine litter. The main sources of marine litter are also covered by the current legislation. Marine litter and effects of marine littering has however been apparent in the literature review and the survey in this report. This indicates that the current policy instruments might be inefficient or need to be complemented. The
development of marine litter is uncertain and is likely to depend of the drivers of marine litter. Potential drivers of marine litter are closely related to the sources of marine litter and probably involve changes in consumption levels (affecting the use of packages), coastal and marine recreation and tourism, commercial fishing and shipping.
Data on cost of degradation due to marine litter are scarce and the data collected only covered the coast of the North Sea. Cost data indicate that cleaning the beaches from marine litter in the province of Bohuslän in the northern part of the Swedish west coast costs about 5-10 MSEK yearly based on data from the survey and over 10 MSEK based on data from the literature review. Data on benefits of reduced marine litter are even more scarce. The benefits of reduced marine litter involve increased aesthetic values, increased possibilities for coastal and marine recreational and tourism.
1
Introduction
Swedes generally spends some of their leisure time close to the Baltic Sea and the North Sea, see Enveco et al. (2012) for details.1 They are also concerned
about the marine environment and regard the coastal and marine environment to be an important environmental issue. Among other environmental problems in the marine and coastal environment, litter is regarded to be a rather big problem (Söderqvist et al., 2010). The aim of this report is to provide
information on marine litter in Sweden, effects on the provision of ecosystem services following from marine litter and costs and benefits connected to the presence of marine litter.
1.1
Background
The initial assessment (IA) of the implementation of the EU Marine Strategy Framework Directive (MSFD) includes an economic and social analysis (ESA). This analysis is about two areas: (1) the use of marine waters and (2) the cost of degradation of the marine environment. COM (2010) describes two different approaches for analysing (1): the ecosystem service approach and the marine water accounts approach; and three different approaches for analysing (2): the ecosystem service approach, the thematic approach and the cost-based
approach.
The Swedish ESA will be based on the ecosystem service approach associated with each of the two areas. For the use of marine waters, this approach entails the following components (COM, 2010:17):
1a. Identifying ecosystem services of marine areas in cooperation with the analysis of status, pressures and impacts
1b. Identifying and, if possible, quantifying and valuing the wellbeing derived from the ecosystem services
1c. Identifying the drivers and pressures affecting the ecosystem services For the cost of degradation, the ecosystem service approach is about the following (COM, 2010:35):
2a. Defining good environmental status (GES) using qualitative descriptors, list of elements and list of pressures.
2b. Assessing the environmental status in a business-as-usual (BAU) scenario.
2c. Describing in qualitative and, if possible, quantitative terms the difference between the GES and the environmental status in the BAU scenario. This difference at a particular point of time defines the degradation of the marine environment at this point of time.
2d. Describing the consequences to human well-being of degradation of the marine environment, either qualitatively, quantitatively or in monetary terms. These consequences are the cost of degradation.
This report provides input regarding marine litter of these two ecosystem service approaches. A main aim of the report is to present data on the status of
1
If not otherwise stated, ”the Baltic Sea” refers in this report to the Swedish marine waters of the Bothnian Bay, the Bothnian sea and Baltic Sea Proper. “The North Sea” refers to the Swedish marine waters of the Skagerrak, the Kattegat and the Sound (Öresund). The Sound is interpreted as having its southern border at the Drogden threshold, i.e. at the Öresund Bridge.
marine litter in Sweden and costs connected to the presence of marine litter. The report is based on literature reviews and a survey carried out to Swedish organizations in October 2011 (further described in Section 1.2).The report reflects the DPSIR-framework by covering central aspects of the framework e.g. describing status and drivers of marine litter.
Finally, important points of departure for the report was the definitions of marine ecosystem services of Garpe (2008) and SEPA (2009) and the definition of Good Environmental Status (GES) as provided by the GES descriptor D10 and associated indicators, see Table 1.1 below.2 Indicators
10.1.1-10.1.3 are indicators of pressure whereas indicator 10.2.1 is seen as an indicator of impact (COM, 2011a).
Table 1.1. GES descriptor 10 on marine litter and associated indicators. Source: COM (2011a).
Criterion Indicator
10.1 Characteristics of litter in the marine and coastal environment
10.1.1 Trends in the amount of litter washed ashore and/or deposited on coastlines, including analysis of its composition, spatial distribution and, where possible, source
10.1.2 Trends in the amount of litter in the water column (including floating at the surface) and deposited on the sea-floor, including analysis of its
composition, spatial distribution and, where possible, source
10.1.3 Trends in the amount, distribution and, where possible, composition of particles (in particular micro-plastics)
10.2 Impacts of marine litter on marine life
10.2.1 Trends in the amount and composition of litter ingested by marine animals (e.g. stomach analysis)
After an introduction to the methodology and the definitions used in this report (Sections 1.2-1.3) it contains the following:
Chapter 2 describes the status of marine litter in Sweden by giving information on amount, composition, spatial distribution and sources of marine litter. The information is given for each of the criterias and indicators of marine litter (COM, 2011a and 2011b).
Chapter 3 provides information on how marine litter affects the provision of ecosystem services. Each of the indicators of marine litter can be assumed to affect ecosystem services in different ways, reflected in the chapter. The ecosystem services are described in four main categories, supporting, regulating, provisioning and cultural ecosystem services. Chapter 3 also summarizes how intermediate and final ecosystem services affected by marine litter are related.
2
The Swedish quantitative definition of good environmental status for indicators in descriptor D10 is not yet resolved at the time of writing of this report.
Chapter 4 gives an overview of the current international and national policy instruments and regulations for managing marine litter. Chapter 4 also includes potential policy instruments for managing marine litter.
Chapter 5 describes the development and trends of marine litter following from BAU and after an introduction of the potential policy instruments suggested in Chapter 4. Further, this chapter describes the effect on the provision of ecosystem services following from these two scenarios and potential drivers of marine litter.
Chapter 6 presents information on the cost of degradation, including changes in human well-being measured as benefits of reduced marine litter and costs of marine litter. It describes costs in terms of
degradation of the provision of ecosystem services. Finally it compares information on costs and benefits related to marine litter.
Chapter 7 summarizes the report with a concluding discussion.
1.2
Methodology
A literature review was carried out to gather information on the current status of marine litter in Swedish waters. The aim was to gather information on amount, composition and sources of marine litter. Another analysis of interest was the spatial distribution of marine litter, divided into the two management areas; the Baltic Sea and the North Sea.
Further the literature review was complemented with a survey on marine litter, carried out in October 2011. The aim of the survey was to gather information on the status of marine litter (amount, composition, sources etc.) but also to collect data on costs of marine litter and benefits of reduced marine litter. The survey was sent out to a broad range of Swedish organizations (public as well as private) that affect or are affected by the current situation with marine litter. The questionnaire was constructed and carried out as a web survey. The initial send list included about 100 recipients of mainly central national organizations but also regional and local public bodies. Regarding public bodies only coastal municipalities and county administrative boards were included in the send list. A more comprehensive send list would probably have needed pre-studies for finding the most relevant organizations and persons to target in the survey. The questionnaire included questions on e.g. composition and amount of marine litter, sources of marine litter and costs connected to problems with marine litter. The complete questionnaire (translated into English) is available in Annex A. An important feature of the questionnaire was that each question was followed by a field where the respondents also had the possibility to give general comments to the question. The additional comment fields made it possible to capture reflections, protests or additional information for each question. In contrast to Mouat et al. (2010) an identical version of the
questionnaire was sent out to all of the respondents, i.e. the questionnaire was not adjusted to different groups of respondents like the tourism sector, fishing sector etc.
The questionnaire resulted in 47 responses. The respondents included county administrative boards, municipalities, trade organizations, non-governmental organizations, harbors and national authorities. Non-governmental
organizations related to environmental protection, waste management and sport fishermen as well as trade organizations representing water treatment plants and waste management organizations responded to the questionnaire.
National authorities leaving an answer were the Swedish Maritime
Administration, the Swedish Environmental Protection Agency, the Swedish Transport Agency, the Swedish Civil Contingencies Agency, the Swedish Coast Guard and the Laboratory of Sea Fishing. Some organizations responded with more than one answer. Some respondents represented e.g. several
municipalities whereas other represented just one municipality or a national organization. Some municipalities or county administrative boards also gave two answers. No obvious overlaps in the answers have been found and due to the scarce amount of data all answers are analyzed individually and included in the results. A few questions resulted in very low response rates or answers mainly consisting of “don´t know”-answers, results of such questions have not been presented in this report.
The survey also aimed to include a spatial dimension and respondents representing the Baltic Sea and the North Sea were included in the send list. With one exception, all the county administrative boards of counties with a coastline (10 situated on the Baltic coast, 2 situated on the coast of the North Sea and one facing both seas) answered the questionnaire. Eight municipalities on the coast of the North Sea and ten on the Baltic coast answered the
questionnaire. Also harbors as well as archipelagic foundations on both coasts were among the respondents. In total 24 answers concerned the Baltic Sea, 9 answers concerned the North Sea and 14 answers concerned both the Baltic and the North Sea. Hence, both management areas were well represented among the respondents.
1.3
Definitions
1.3.1 Marine litter
The definition of marine litter (also called marine debris) used in this report and in the survey corresponds to the definitions used in UNEP (2005) and in COM (2011a). The definition used is: Marine litter is any persistent,
manufactured or processed solid material discarded, disposed or abandoned in the marine and coastal environment. Marine litter consists of items that have been made or used by people and deliberately discarded or unintentionally lost into the sea and on beaches including such materials transported into the marine environment from land by rivers, draining or sewage systems or winds. For example, marine litter consists of: plastics, wood, metals, glass, rubber, fabrics or paper, including micro particles and litter ingested by marine animals. Micro particles originate from wearing on different materials such as fabrics, paint or from wearing on roads or tires. Micro particles are embedded by animals (e.g. animals filtering water).
1.3.2 Additional definitions used in the survey
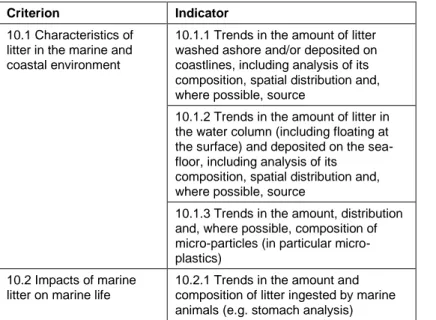
Some additional definitions were also used in the survey (see also Annex A). The survey used the concept of ”your organization” for addressing the respondent. In the survey this concept referred to all kinds of organizations, e.g. authorities, companies, federations, associations including their members and the activities of their respective members. This definition of organization will to some extent also be used when presenting the answers from the survey. The survey also needed to define the Swedish marine environment to frame the area targeted in the survey. Swedish marine environment was defined as Swedish beaches, coastlines, water bodies off-shore close to the coastline as well as water columns and sea floors in the Swedish economic zone. The blue line in Figure 1.1 illustrates the border of the Swedish economic zone and the
green arrow points out a preliminary border between the management areas of the Baltic Sea and the North Sea. The management area of the Baltic Sea includes Swedish water bodies from the Gulf of Bothnia in the north to the green arrow in the south. The management area of the North Sea includes Swedish water bodies from the green arrow in the south to the Norwegian border in the north.
Figure 1.1. Swedish economic zone is illustrated by a blue line and the green arrow points out a preliminary border of the management areas of the Baltic Sea and the North Sea.
2
Marine litter: Status
2.1
Literature review
A literature review was carried out to determine the status of marine litter in Sweden. The analysis is based on the GES marine litter indicators: litter washed ashore or deposited on the coastline (indicator 10.1.1), litter in the water column and deposited on the sea floor (indicator 10.1.2), micro-particles (indicator 10.1.3) and litter ingested by marine animals (indicator 10.2.1). See Table 1.1 for a more detailed description of the indicators. The indicators describe the trends in amount, spatial distribution, composition and sources of litter. We are, however, interested both in the current status and in the trends. In this chapter we focus on the present status of marine litter and in Chapter 5.1 we look at the trends.
There are very little data on marine litter available for Swedish coastal waters. The literature review has therefore been supplemented with data from the whole North Sea area and the whole Baltic Sea area. The main references are reports from OSPAR (2009) for the North Sea and UNEP (2009b) for the Baltic Sea.
2.1.1 Litter on the coast and in the sea
In this section we look at marine litter on the coast and in the sea (indicators 10.1.1 and 10.1.2). Based on the available literature we try to determine the amount, spatial distribution, composition, and sources of marine litter along the coast of Sweden.
2.1.1.1 AMOUNT OF LITTER
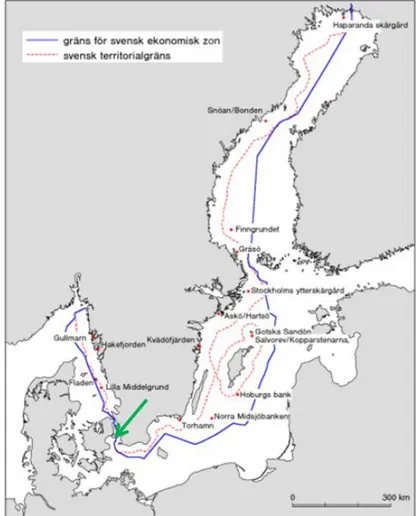
The Bohus Coast in the northern parts of the Swedish west coast is the area most affected by marine litter due to its geographical location and the large-scale current patterns.
Figure 2.1. Average surface currents in the Baltic Sea and North Sea. The coast of the province of Bohuslän is marked with a red square. Source: SEPA (2011).
Figure 2.1 shows the average surface currents in the Baltic Sea and North Sea. The Bohus Coast (marked with a red square in Figure 2.1) is located in an area where several currents converge. Buoyant litter (e.g. plastic items) at the sea surface will drift with the surface currents as shown in Figure 2.1. Marine litter can therefore be expected to accumulate at the Bohus Coast. Based on the surface currents it is unlikely that litter from the Bohus Coast will drift with the currents into the Baltic Sea.
Since the early 1990’s marine litter has been collected and measured at six beaches in the province of Bohuslän on the Swedish west coast (illustrated by the red square in Figure 2.1 and corresponding to Figure 2.2).
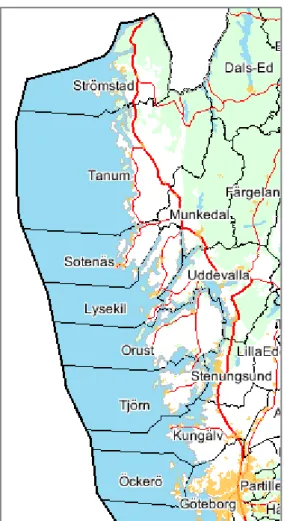
Figure 2.2. The province of Bohuslän and coastal municipalities of Bohuslän (Strömstad, Tanum, Sotenäs, Lysekil, Uddevalla, Orust, Stenungsund, Tjörn, Kungälv, Öckerö and Göteborg (partly)). This figure corresponds to the red square in Figure 2.1 (County maps 2009).
The amount of litter found is shown in Table 2.1. In addition to the volume the number of day labours, sacks of litter, fish boxes and oil cans found are also shown. The reason for the high volume (15 500 m3) value in 1992 is that this
was the first year the litter was collected and large amounts had accumulated. The relative low numbers in 1996, a total volume of 4000 m3, is partly a result
of extensive ice coverage during the winter season as well as long periods with easterly winds which transported the litter off-shore (Olin, 2010).
Table 2.1. Amount and composition of litter collected in the province of Bohuslän 1992-2006 (Olin, 2010). Also the number of day labours for collecting the litter is shown.
Year Volume (m3) Day labour (number of) Sacks of litter (number of) Fish boxes (number of) Oil cans (number of) 1992 15500 25000 89200 2410 1993 5500 6000 36071 1412 2500 1994 6000 7163 36210 1231 733 1995 6000 6508 34427 1229 589 1996 4000 5840 22607 575 1316 1997 6000 7885 36206 2020 2292 1998 6000 6480 35825 1620 2290 1999 8000 7023 39103 1899 2673 2000 7000 8081 48581 3046 4021 2001 5000 6214 34066 1361 2393 2002 4000 5880 30119 2186 2937 2003 3000 5364 24335 1631 2150 2004 3000 5472 24620 1453 2099 2005 3000 4964 24131 1640 2114 2006 3000 4156 19944 1072 1553
The province of Bohuslän in the northern part of the Swedish west coast consists of several municipalities (see Figure 2.2). For some of the coastal municipalities more recent data on marine litter are available. The municipality of Sotenäs have collected marine litter from beaches from 2007 to 2010
(Sotenäs, 2011 and pers. comm. Elise Hellström, see Table 2.2). The collection is carried out between March and October each year. Among the items found are fish boxes, oil cans, medical waste, and refrigerators. Here the percentage of beaches cleaned is also reported. In 2007 and 2008, marine litter was collected on only 25% of the beaches while between 2009 and 2010 about half the beaches were cleaned. This shows that marine litter data based on beach clean-up efforts can underestimate the total amount of litter on a beach as not all of it is collected.
Table 2.2. Marine litter collected in Sotenäs in the Bohus Coast (Sotenäs, 2011 and pers. comm. Elsie Hellström).
Year Volume (m3)
Mass (tons) Percentage of beaches cleaned
2007 199 19.4 25
2008 152 14.4 25
2009 364 31.9 50
2010 455 42.1 53
Table 2.3 presents volume and composition of litter collected in 2009-2011 on beaches in the municipality of Lysekil (see figure 2.2). In contrast to Sotenäs the total amount of litter collected in Lysekil is measured in sacks. Fish boxes and oil cans were commonly found when collecting litter in Lysekil (pers. comm. Elsie Hellström).
Table 2.3. Marine litter collected in the municipality of Lysekil (pers. comm. Elsie Hellström).
Year Sacks of litter (number of) Fish boxes (number of) Oil cans (number of) 2009 4400 290 270 2010 5600 190 430 2011 5300 120 310
The municipality of Tanum (see Figure 2.2) also carried out beach cleaning in 2009-2011. The volume found in these years were 1000, 250 and 185 m3
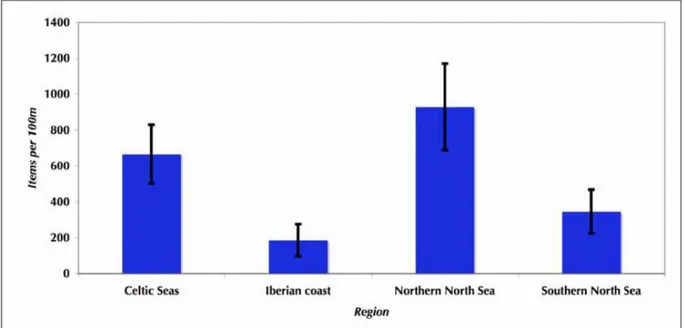
respectively. There are at present no exact numbers available for the volumes of litter found on beaches in the municipality of Strömstad (see Figure 2.2). The volume collected in Strömstad is however roughly corresponding to the amounts collected in Sotenäs municipality (pers. comm. Elsie Hellström). OSPAR collects data at a number of reference beaches along the coast in Europe. Six beaches from the Bohus Coast are included in the OSPAR North Sea programme. Figure 2.3 shows the amount of litter in different OSPAR regions and shows that the North Sea is one of the areas most affected by marine litter (OSPAR, 2009).
Figure 2.3. Average number of litter items per 100 meters on the reference beaches in the OSPAR regions. (Figure from OSPAR, 2009, p. 5)
For the Swedish east coast along the Baltic Sea marine litter data are very scarce. When it comes to marine litter, the Swedish east coast receives little attention compared to the west coast, in particular the Bohus Coast. We will therefore use data from elsewhere in the Baltic Sea to estimate the amount of litter on the Swedish Baltic Sea coast.
Municipalities and NGOs (e.g. WWF and the Ocean Conservancy) gather information on the amount of litter found at beaches in the Baltic Sea. UNEP and the Ocean Conservancy collect information from beach clean-up efforts in the Baltic Sea. Although the UNEP report (2009b) does not include data
specific for Sweden we will use it to illustrate typical values for the Baltic Sea. The highest concentration of marine litter found on beaches in the Baltic Sea is 700 to 1200 items per 100 m coastline. These values are very similar to those reported by OSPAR (2007) for the northern North Sea. More typical values for the Baltic Sea are 6 to 16 pieces of litter per 100 m coastline. From these figures we conclude that marine litter on beaches is a larger issue in the North Sea than in the Baltic Sea. However, it is important to keep in mind that local variations can be large. Close to the source of the litter (e.g. at a public beach) the amount of litter may be higher.
For comparison we cite a Finnish study where marine litter was collected at 15 beaches in Finland (UNEP, 2009b). The number of items found on the beaches per 100 m coastline range from 21 to 691 pieces, with an average of 260 pieces. Expressed in mass these numbers correspond to 1 kg to 45 kg of litter per 100 m coast, with an average of 11 kg.
Data of marine litter in the sea are even more difficult to come by. At sea a common source of marine litter is related to fishing. The Swedish Board of Fisheries carried out a survey from 2000 to 2004. In 2004, 24 km of lost fishing nets were found (UNEP, 2009b). However, the amount of litter found on the beach may give an estimate of marine litter at sea, not of the actual amount but of general trends. The fate of the sea-based litter depends on the density of the item, i.e., what the item is made of. Heavy items will sink to the sea floor while lighter ones will drift with the currents. The currents will determine where the item ends up. In regions with currents towards the coast the item may be washed ashore (see discussion about the Bohus Coast above) otherwise it may drift large distances.
Information on litter on the sea bottom is also very scarce. In the western Baltic Sea, marine litter at the sea bottom was collected by trawling (Galgani, 2000). The study found 1.26 ± 0.82 items of litter per hectare. This value is similar to what has been measured previously in the North Sea (UNEP, 2009b). An inventory of wrecks in the Swedish sea territory that might pose a threat to the environment has been carried out 2009-2011. 17 000 wrecks were found of which 2 700 wrecks need further investigation, about 300 wrecks might pose a threat to environment and 31 wrecks are prioritized objects containing fuel. The presence of wrecks in Swedish coastal and marine waters, or close to Swedish sea territory, can lead to emission of hazardous substances such as oil, ammonia or fertilizers from e.g. wrecks of tankers affecting the marine
environment. The diffuse chronic emissions from wrecks pose the largest threat to the coastal and marine environment. Long-term effects on marine ecosystem services are probable but further research is needed (Sjöfartsverket, 2011).
2.1.1.2 SPATIAL DISTRIBUTION OF MARINE LITTER
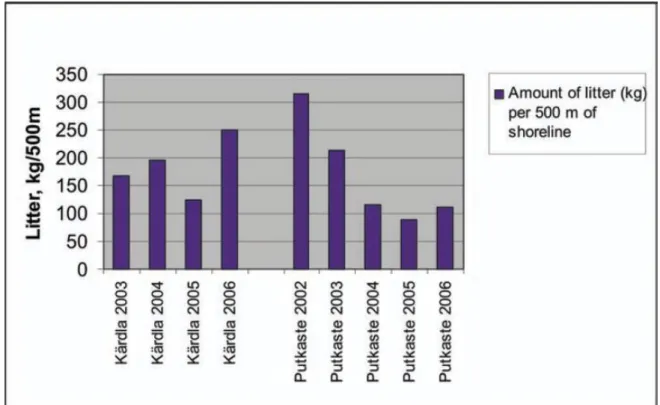
The amount of marine litter on the coast varies greatly from one location to another and depends on a number of factors. The amount of litter on the coast is influenced by human activities on land (e.g. being at the beach) and by what is washed ashore by the currents. Thus two very nearby locations may differ greatly in the amount of litter. This makes it difficult to extrapolate marine litter data to determine what the situation is at other locations along the coast. Figure 2.4 shows the amount of litter found on two nearby locations on the same island in Estonia (UNEP, 2009b).
Figure 2.4. Amount of litter as kg/500 m of shoreline in Kärdia and Putkaste districts in Hiiumaa area, Estonia. Data provided by State Forest Management Centre (RMK), Estonia (figure from UNEP, 2009b, p. 30).
The amount of litter also varies in time. There are seasonal variations which can be exemplified by comparing the amount of litter on the beach during summer and winter. There are also inter-annual variations as can be seen in the data presented above. These variations may depend on the weather as was seen in the marine litter data from the Bohus Coast (see Table 2.1). The variations may also be due to the number of days of labour or fraction of beaches that were cleaned as was seen in the data from the Bohus Coast and Sotenäs (see Tables 2.1 and 2.2).
2.1.1.3 COMPOSITION OF MARINE LITTER
The composition of the marine litter is an important descriptor as it gives information about the possible sources of the litter. Furthermore, the material determines whether the item is buoyant or not. This is especially interesting for marine litter deposited at sea. A buoyant item will drift with the currents (sometime very large distances) before being washed ashore. In this case it is either indicator 10.1.2 or 10.1.1 that will be affected. Items of heavy materials, on the other hand, will sink and affect indicator 10.1.2 only.
Figure 2.5 shows the average composition of litter on the coast and beaches of the Baltic Sea per 500 m coastline based on data from the Naturewatch Baltic project (1998-2005). The values are for a specific time at specific locations and thus they only provide a snapshot of the litter composition. It should also be kept in mind that there are large differences between countries. The figure shows that of the litter collected on the coast and beaches of the Baltic Sea, 31-43% is plastics bottles. Some of the years plastic bags where reported and they made up 19-27% of the litter (UNEP, 2009b). Hence, plastic bags and plastic bottles make up a large fraction of the litter on the coast. The situation is very similar on the west coast of Sweden where plastic items also dominate. These items are often attributed to marine recreation (UNEP, 2009b).
Figure 2.5. Averages of different types of litter found on beaches by WWF Naturewatch Baltic, measured as pieces of litter per 500 m of coastline (figure from UNEP, 2009b, p. 29).
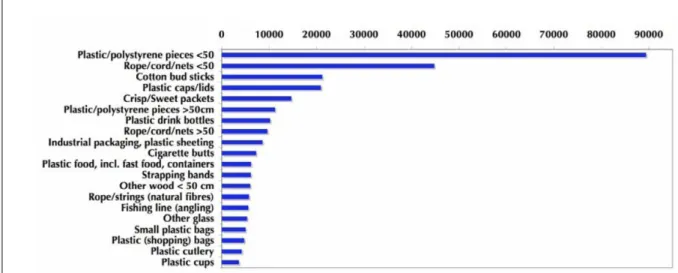
Figure 2.6 from OSPAR (2009) shows the composition of the marine litter found at a number of reference beaches. At all the reference beaches plastic and polystyrene pieces were the most common objects.
Figure 2.6. Total numbers of items collected on reference beaches in the North East Atlantic (Figure from OSPAR, 2009, p. 6)
In a Finnish study, litter was collected at 15 beaches along the coast of Finland (UNEP 2009b) and 54 % of the items were found to be plastic items. According to the “Save the North Sea” project, in the early 2000’s, the most common objects found in the North Sea were: plastic bags, cans, plastic cups, buoys, and pieces of fishing nets (Håll Sverige Rent, 2011).
A study by Galgani (2000), measured the amount of litter on the sea floor along the European coast and 36% of the litter was plastic bottles.
Based on these studies, we conclude that plastic items make up a large fraction of marine litter. Plastic items are often buoyant and can therefore drift large distances with the currents and end up far away from their original source.
2.1.1.4 SOURCES OF MARINE LITTER
Marine litter found at sea and on the coast originates from both sea- and land-based sources. Sea-land-based sources includes shipping (commercial, recreational) and fishing. Land-based sources include for example tourism and recreational visitors at the coast, and riverine transport of litter from inland (OSPAR, 2009).
As part of the HELCOM report on marine litter, countries around the Baltic Sea responded to a questionnaire about marine litter. Five of the countries reported marine recreation and tourism to be the most common sources of land-based litter (UNEP, 2009b). This litter is made of plastic and glass bottles, plastic bags, packing material (plastic, polystyrene, paper, cardboard), cans and tins. In the same HELCOM questionnaire, the major sea-based sources in the Baltic Sea were determined to be commercial shipping (e.g., fishing boats, cargo ships, tankers, and passenger ships), recreational fishing boats, and pleasure crafts. The relative importance of these sources varies in different areas of the Baltic Sea.
The sea-based source of marine litter in Sweden include fisheries (fishing nets and floats), commercial shipping, off-shore oil and gas installations in the North Sea (oil drums, paint, chemicals, gas flask), and recreational boating whose contribution can be locally very high.
2.1.2 Micro-particles
Micro-particles (indicator 10.1.3) are very small particles found in the sea. They consist of many different materials and have a wide range of sources. The size of the particles is similar to the size of phytoplankton, and thus marine animals that filter water for food may ingest these particles. The environmental effect of these particles is just beginning to be studied. As these particles are impossible to clean up and many of them consist of plastic it is expected that their
concentration will increase in the future.
Micro-particles vary in shape and colour depending on their origin. The main distinction is made based on the shape. Fibrous particles have a small diameter (approximately 0.02 mm) and vary in length from 0.2 mm to a couple of mm. Non-fibrous particles have a more rounded shape.
In November 2008 N-research (Norén, 2010) carried out a survey along the coast of Sweden. The concentrations of fibrous and non-fibrous particles were measured at 19 stations ranging from the Gulf of Bothnia to Skagerrak. The results are summarized in Table 2.4. This is to date the most comprehensive study of micro-particles performed in Sweden.
Table 2.4. Concentration of micro-particles measured at 19 stations along the Swedish coast (Norén, 2010).
Station Number of fibrous particles/m3 Number of non-fibrous particles/m3 Lysekil West 340 760 Lysekil 880 2420 Orust West 1180 7200 Fladen 480 1040 Anholt E 400 900 Falkenberg 1320 1520 Landskrona West 340 1520 Arkona 1340 3060 Bornholmsdjupet 940 3340 Hanöbukten 620 60 Kalmar 1040 1920 Gotlandsdjupet 720 3200 Karlsödjupet 480 1620 Norrköpingsdjupet 1080 3040 Landsortsdjupet 1160 3260 Bottenhavet 9960 20280 Höga kusten 5520 2500 Umeå, Norrbyn 14620 104780 Bottenviken, utsjö 5380 9540
For both fibrous and non-fibrous particles the concentrations were highest in the Gulf of Bothnia. The reason for this is not entirely clear. It could be that different sampling methods were used for the northernmost stations, that the river runoff is higher or that the Gulf of Bothnia has a smaller exchange with the North Sea, which is believed to have a lower concentration of micro-particles.
On average the composition of fibrous particles at the 19 stations surveyed by N-research was: 62% were natural fibres such as cotton and wool, 23 % were plastic polymers and the remaining ones were too oxidized to determine. The main source of fibrous particles is textile (lint). Among the non-fibrous micro-particles the black micro-particles dominate. There originate from road and tire wear. 2.1.3 Marine litter ingested by marine animals
An additional issue with marine litter is that some items may be ingested by marine animals; especially smaller plastic items may be taken for prey. Indicator 10.2.1 deals with the amount and composition of marine litter ingested by marine animals. The indicator does not include entanglement in litter which is an additional problem with marine litter and animals.
There have been very few studies to determine the amount of litter ingested (stomach analysis). A Dutch surveyed during 1982 to 1985 found that 92 % of the birds had on average 12 pieces of plastic in their stomach. A similar study in the late 90’s showed that 98 % of the birds had plastic pieces in their stomach. (UNEP, 2009b).
2.2
Results from the survey
Questions regarding GES indicator affected, amounts, composition and sources of marine litter as well as spatial distribution of marine litter were included in the survey (questions 4-9, 15-18 and 21-24 in Annex A). The questions targeted organizations causing marine litter as well as organizations affected by marine litter.
2.2.1 Marine litter caused by Swedish organizations
In total 7 respondents stated that their organization contributed to marine littering (question 3 in Annex A). They were also asked to state what GES indicators the marine littering affected (question 4 in Annex A). The majority of the respondents indicated that their littering affected indicator 10.1.3
concerning micro particles. Some respondents indicated that the marine littering from their organizations affected indicator 10.1.1 concerning litter washed ashore and/or deposited on coastlines and indicator 10.1.2 concerning litter in the water column (including floating at the surface) and deposited on the sea floor. Some explanations were given to the impacts on indicator 10.1.3. The respondents stated that the use of boats and cars contribute to the amount of micro particles. Also paint from wear on vessels and wear on different kind of equipment used in harbors can cause micro particles, e.g. wear on jetties or rust from equipment. Traffic and wear on equipment contribute to the amount of micro particles almost daily and over long time horizons according to the respondents (question 10 in Annex A). The respondents were also asked how the volume of different types of litter from their own organization had changed over the last ten years (question 12 in Annex A). These types of litter included paper, plastic, wood, metals, glass, rubber, fabrics, micro particles and other. However, this question proved difficult to answer and the question did not result in any specific information.
2.2.2 Marine litter affecting Swedish organizations
2.2.2.1 AMOUNT OF LITTER
In total 25 respondents out of 47 stated that their organizations were affected by marine littering (question 14 in Annex A). The respondents were asked to estimate the volume of each kind of litter affecting their organization (question 17 in Annex A). Only a few organizations had access to this kind of data. The general comments indicate that it is hard to estimate the volume of litter and that the volume is unknown for most respondents. However, the general comments also indicated that the volumes of marine litter are causing problems to the organizations particularly by affecting the environment. The county administrative board of Halland on the coast of the North Sea stated that the following volumes of litter were collected yearly: 30 sacks of plastic, 30 sacks of paper, 5 sacks of wood, 10 sacks of glass, 10 sacks of rubber and 15 sacks of other litter. In total about 100 sacks of litter per year.
The municipality of Öckerö on the coast of the North Sea (see Figure 2.2) stated that the following volumes of litter were collected: 30 boxes (for fish), 2 bikes, 34 disposable barbecues, 95 pair of rubber or plastic gloves and 46 plastic or metal cans. In total about 400 sacks of litter. The municipality did not leave any information on how often the volume of litter was collected.
The municipality of Göteborg on coast of the North Sea (see Figure 2.2) stated the following yearly volumes for different types of litter: 5.6 tonnes of plastic, 250 kg of glass, 50 kg of rubber, 300 kg of other litter and 65 liter of oil.
The county administrative board of Västra Götaland on the coast of the North Sea stated that about 4000 m3 litter is yearly collected on the coast of the
province of Bohuslän, this estimate covered all of the different types of litter.
2.2.2.2 COMPOSITION OF LITTER
The respondents were asked to state what types of litter that affected their organizations (question 15 in Annex A). Table 2.5 presents the alternatives and the answers to question 15 for both management areas.
Table 2.5. Results of question 15.
Respondents representing... (22 out of a total of 47 respondents gave an answer)
…the North Sea (8 out of 9 respondents gave an answer)
…the Baltic Sea (10 out of 24
respondents gave an answer)
…the North Sea and the Baltic Sea (4 out of 14 respondents gave an answer) Type of litter Plastic 8 9 4 Paper 5 5 3 Metal 6 6 4 Wood 6 7 3 Glass 7 8 4 Rubber 8 6 4 Fabrics 6 7 3 Micro particles 6 6 3 Other 6 7 3
All of the categories were highly relevant for most respondents. The majority of the respondents indicated that their organizations were affected by several categories. This was a uniform answer for both the Baltic and the North Sea. For each category of litter about half of the respondents also specified what kind of litter their organizations was affected by. Packaging was frequently mentioned as a specific type of waste affecting several organizations. Further, bottles, styrofoam, plastic bags, sacks, oil spill, tires, cans and boats or parts of boats were litter affecting several organizations. Other types of litter mentioned were fishing equipment, boxes and disposable barbecues. In the general
comments some respondents pointed out other important aspects related to problems with marine littering, for example that environmental toxins are closely related to marine litter and that litter also affects the water quality.
2.2.2.3 SOURCES
The respondents were asked about their view on possible sources of the litter affecting their organization (question 21 in Annex A). The general picture of sources is quite diverse and only a few respondents gave an answer. Fishing, the fishing industry and shipping were seen as possible sources by several respondents. Out-door activities, tourists, the public and the public’s boating were also suggested as possible sources.
Table 2.6. Results of question 23. Respondents representing... (22 out of a total of 47 respondents gave an answer)
…the North Sea (response rate shifting between types of litter)
…the Baltic Sea (response rate shifting between types of litter)
…the North Sea and the Baltic Sea (response rate shifting between types of litter)
Type of litter National Inter-national National Inter-national National Inter-national Plastic 6 2 1 2 Paper 2 2 2 1 1 1 Metal 2 2 2 2 Wood 1 3 1 1 2 Glass 3 2 3 2 Rubber 3 2 1 2 Fabrics 2 1 2 Micro particles 3 2 1 Other 1 4 1 1 1
The respondents were also asked to state whether they believed the source of litter to be national or international for each type of marine litter (question 23 in Annex A). The types if litter and the answers to the question are presented in Table 2.6. Many respondents stated “don´t know” as an answer to this question and wrote in the comment field that they did not have enough information to answer. The survey does not provide a clear picture of whether the sources of marine litter mainly are national or international. The assessment that the source of marine litter was international was somewhat more common for the respondents representing the North Sea. The respondents were asked to state whether they believed the source of litter to be national or international for each type of marine litter. However, this classification did not result in any clear conclusions.
2.3
Discussion
Very little data on marine litter are available for the Swedish coast and seas. Most of the data available are for litter found on the beaches. This litter is the most visible one and often concentrated to small areas along the coast making it relatively easy to collect. Since the early 1990’s, marine litter has regularly been collected on the Swedish west coast, on average about 4000 m3/year. Data
found in the literature suggest that the amount of litter is higher in the North Sea than in the Baltic Sea.
There are very little data on marine litter in the open sea. Compared to litter on beaches, this litter is spread out over a larger area making it more difficult to collect and measure. Based on the dominating surface currents in the Baltic Sea and North Sea, one may expect the Bohus Coast on the Swedish west coast to be most affected by marine litter. The large-scale surface currents are on average directed out of the Baltic Sea towards the North Sea, thus any litter that is buoyant will be transported away from the Baltic Sea.
For litter on the sea bottom there are even less data. This litter is out of sight to the general public thus gaining little attention. There have been a few
oceanographic surveys where the sea floor has been surveyed in order to determine the amount of litter. Spatial variations are large and depending on the bathymetry and bottom currents there will be locations where litter will accumulate.
This picture is supported by the answers in the survey as most respondents found it difficult to state the amount of litter caused by their organization or affecting their organization. However, the respondents did point out that the amount of marine litter constitutes a problem.
A large fraction of the marine litter, whether found on the coast, drifting with the currents or being at the sea floor, consists of items made of plastic. Plastic items take very long time to decay, decades to centuries depending on type of plastic. Thus marine litter in the marine environment may be very persistent and accumulate unless cleaned-up.
Plastic items may also be broken down to smaller pieces and ingested by animals. This, together with marine animals getting entangled in litter, is one of the main environmental issues of marine litter. Plastic was commonly mentioned also by respondents in the survey as a common type of litter, but also many other types of litter were mentioned buy the respondents such as paper, metal, wood, glass etc. The results from the literature review and the survey are mainly consistent regarding the sources of marine litter.
The presence of micro-particle in the sea has been gaining attention lately. These are very small particles, about the same size as phytoplankton. Marine animals, e.g. filter feeders, may ingest these particles. Furthermore, there particles are made of slow-decaying materials which make an increase in the concentration in the sea likely. Very little is known about the environmental effect of these particles. Results from the survey indicate that micro-particles is a common type of litter that causes problems in the marine environment. An issue that became apparent both in the literature review and in the survey was the lack of common methods for measuring marine litter and of a
monitoring program for marine litter in Sweden. These are both likely to be important explanations of the scarce amounts of data. The literature review and the survey show that the methods for measuring litter e.g. collected on beaches are diverse. The amounts of litter are measured in several different units, e.g. m3, number of sacks and kg. The literature review also showed that
measuring and collecting marine litter on beaches involved several methods and units, e.g. items per 100 m coastline and kg litter per 500 m coastline. The lack of monitoring programs of marine litter in Sweden probably also explains the scarce amount of data on marine litter. This is also supported by the results from the surveys as monitoring programs and financial support for such programs are seen as desirable. However, there have been several regional and global initiatives to develop methods for monitoring and assessing marine litter, e.g. Cheshire et al. (2009) and OSPAR (2007).
It is difficult to compare marine litter data from different sources as there are no common methodologies to collect the data, no common method to measure and report the data. Some of the litter collection is also carried out by
volunteers, which means that the amount collected will depend on the number of volunteers that participate. The scarce amount of data also makes
comparisons between the two management areas less fruitful. However, since there seem to be more data available for the coast of the North Sea it might
indicate that marine litter is a larger problem there than on the coast of the Baltic Sea.
Finally, we note that the sources of litter as described in Section 2.1.1.4 and 2.2.2.3 give indications on important drivers of marine litter. These drivers are likely to include consumption levels (affecting the use of packages), coastal and marine recreation, commercial fishing and marine transports. Many of these drivers in turn depend on the general economic and financial development. The drivers might also be influenced by existing and future policy instruments, which are subject to review in Chapters 4 and 5.
3
Impacts of marine litter on
ecosystem services
The European Commission conclude that there are little knowledge on impacts from marine litter on ecosystem services but that the issue is a global problem of great interest (COM, 2011a). Hence, in this section we look at the impact of marine litter on the ecosystem services. For each ecosystem service we study if it is affected by a change in the indicators. If there is a change in the indicator (e.g. more litter washed ashore), is the ecosystem service affected? We look at two impacts of marine litter. Firstly, the physical impact deals with that the mere presence of litter affecting the ecosystem service. This is, for example, the case for marine litter washed ashore and its effect on the ecosystem service Enjoyment of scenery (C2). And secondly, the chemical impact taking into consideration that marine litter may contain toxic materials and get into the food web. For the ecosystem services that are considered to be affected by litter, we also differentiate between intermediate and final services. Final ecosystem services are those whose supply depends on the input of another ecosystem service. For example, the ecosystem service Enjoyment of recreation (final) (C1) depends on the ecosystem service Enjoyment of scenery (intermediate) (C2). Tables 3.1-3.4 describe how marine litter, according to the GES indicators, affect: supporting, regulating, provisioning and cultural marine ecosystem services. In Section 3.5 we summarize the impact on marine litter on the ecosystem services and show the linkage between intermediate and final ecosystem services.
3.1
Impacts of marine litter on supporting
ecosystem services
Table 3.1 identifies the main impacts of marine litter on the supporting
ecosystem services. Generally speaking a large amount of litter, micro-particles, and litter ingested by marine animals act as a disturbance on the ecosystem and can have a negative impact on the ecosystem services Food web dynamics (S3), Maintenance of biodiversity (S4), Maintenance of habitat (S5) and Maintenance of resilience (S6). For example, large amounts of litter washed ashore or deposited on the coastline (10.1.1) affect the Maintenance of habitat (S5) as it may destroy habitats along the shoreline or prevent animals from reaching land. This is also the case for marine litter deposited on the seafloor (10.1.2) which may destroy habitats. The impact of large objects is not only negative as it can create new habitats. Although not litter, the pillars of the Öresund bridge have become the site of new marine habitats. Large amounts of litter on the sea surface (10.1.2) may hinder light from penetrating and thereby reduce primary production (S2). Toxic marine litter affects the Food web dynamics ecosystem service (S3) if the toxic chemical enters the food web by, e.g. animals ingesting toxic materials.
Table 3.1. Impacts of marine litter on supporting ecosystem services.
Ecosystem services Marine litter 10.1.1 Marine litter washed ashore or deposited on coastlines. 10.1.2 Marine litter in the water column and deposited on the sea-floor. 10.1.3 Micro-particles including micro-plastic 10.1.4 Litter ingested by marine animals S1 Biogeochemical cycling S2 Primary production X S3 Food web dynamics X X X X S4 Maintenance of biodiversity X X X X S5 Maintenance of habitat X X S6 Maintenance of resilience X X X X
3.2
Impact of marine litter on regulating
ecosystem services
Table 3.2 describes the regulating ecosystem services affected by marine litter. For the regulating services we focus on the toxicity of marine litter as there is no major impact by the sheer presence of litter. Toxic marine litter impacts the regulating ecosystem service Regulation of hazardous substances, R5. With increasing toxic marine litter, this ecosystem service will not be sufficient to maintain a clean sea. This ecosystem service is considered an intermediate service for the provision of food (P1) and Provision of inedible goods (P2).
Table 3.2. Impact of marine litter on regulating ecosystem services.
Ecosystem services Marine litter 10.1.1 Marine litter washed ashore or deposited on coastlines. 10.1.2 Marine litter in the water column and deposited on the sea-floor. 10.1.3 Micro-particles including micro-plastic 10.1.4 Litter ingested by marine animals R1 Climate and atmospheric regulation R2 Sediment retention R3 Eutrophication mitigation R4 Biological regulation R5 Regulation of hazardous substances X X X
3.3
Impact of marine litter on provisioning
ecosystem services
Marine litter affects the provisioning ecosystem services in a number of different ways. The service Provision of food (P1) is primarily affected if the litter is toxic and the contaminant enters the food web and reaches fish and shellfish consumed by humans. As this ecosystem service has a direct impact on humans it is considered a final service. Fish fodder is one of the goods supplied by the ecosystem service Provision of inedible goods (P2). Similarly to P1, if the litter is toxic it may affect the fodder production by entering the food web. The ecosystem service Provision of energy (P6) could possibly be
impacted by marine litter getting entangled in wave and tidal power turbines. In case of large amounts of litter the ecosystem Space and waterways (P7) may be affected negatively by blocking the way in e.g. narrow passages.
Table 3.3. Impact of marine litter on provisioning ecosystem services.
Ecosystem services Marine litter 10.1.1 Marine litter washed ashore or deposited on coastlines. 10.1.2 Marine litter in the water column and deposited on the sea-floor. 10.1.3 Micro-particles including micro-plastic 10.1.4 Litter ingested by marine animals P1 Provision of food X X X P2 Provision of inedible goods X X X P3 Provision of genetic resources P4 Provision of chemical resources P5 Provision of ornamental resources P6 Provision of energy X X P7 Space and waterways X X
3.4
Impact on cultural ecosystem services
The impact of marine litter on the cultural ecosystem services is through the visual aspect of litter in the coastal environment. This implies that the indicators Marine litter washed ashore or deposited on the coastlines (10.1.1) and Marine litter in the water column or deposited on the sea-floor (10.1.2) all have an impact on the cultural ecosystem services. Micro-particles are
considered to have little impact on the cultural ecosystem services as they are not visible. They have, however, been gaining more attention lately and are thus considered to be relevant for the ecosystem service Legacy of the sea (C6). We consider the cultural ecosystem services C1-C5 to be unaffected by micro-particles.
Litter ingested by marine animals (indicator 10.2.1) affect the Enjoyment of recreation (C1) as bird watching and recreational fishing is included in this ecosystem service. Ingested litter may increase the mortality of marine animals and thereby reducing the values of enjoying the sea. The ecosystem service Legacy of the sea (C6) is impacted by all marine litter indicators. An increase may lead to an increase in the appreciation of the sea for ethical reasons and to an increase in interest in conserving the sea.
An increase in litter may affect the ecosystem service Science and education (C3) in different ways. If the marine environment is more littered, it may become more difficult to promote awareness and interest in the marine
environment in terms of science and education. It can also work the other way, causing an increased interest to use the marine environment for science and education in order to remedy the situation.
Table 3.4. Impact of marine litter on cultural ecosystem services.
Ecosystem services Marine litter 10.1.1 Marine litter washed ashore or deposited on coastlines. 10.1.2 Marine litter in the water column and deposited on the sea-floor. 10.1.3 Micro-particles including micro-plastic 10.1.4 Litter ingested by marine animals C1 Enjoyment of recreation X X X C2 Enjoyment of scenery X X C3 Science and education X X C4 Maintenance of cultural heritage X X C5 Inspiration for art and advertisement X X C6 The legacy of the sea X X X X
3.5
Summary
Figure 3.5 summarizes the findings of chapter 3 and shows what ecosystem services are affected by marine litter and the linkages between these ecosystem services. The ecosystem services identified to be affected by marine litter are classified as intermediate (blue boxes) or final (red boxes for the strongly impacted ones and orange boxes for the weakly impacted ones) services. An intermediate service is one that affects another ecosystem service. For example, marine litter affects the ecosystem service Enjoyment of scenery (C2), as an increase in marine litter leads to a deterioration of the scenery.
Enjoyment of recreational activities (C1) depends on the ecosystem service Enjoyment of scenery. Thus the ecosystem service Enjoyment of scenery is an intermediate service and Enjoyment of recreational activities a final service in terms of marine litter.
The final services are classified according to how strongly they are impacted by marine litter. For example, both the Provision of food (P1) and the Provision of inedible goods (P2) are affected by toxic marine litter. The ecosystem service Provision of inedible goods provides fodder, which is affected by toxic litter, and other goods which are unaffected by marine litter. Provision of inedible goods (P2) is therefore rated to be weakly impacted. Provision of food is strongly affected by toxic litter as all goods provided would be toxic. The ecosystem services Enjoyment of scenery, Regulation of hazardous
substances and the supporting ecosystem services S1-S6 are affected by marine litter either by physical effect of marine litter (just by the litter being present) and/or by the fact that marine litter may be toxic. As other ecosystem services depend on these services they are considered intermediate.
Figure 3.5. Ecosystem services affected my marine litter. Blue = intermediate ecosystem services, Orange = final services, less important, Red = final services, more important.
All cultural ecosystem services are considered to be affected by the visual aspect of marine litter, especially by litter found on the coast and washed ashore. The ecosystem services mostly affected by deterioration in the ecosystem service Enjoyment of scenery are: Enjoyment of recreation and the Legacy of the sea (red boxes in Figure 3.5). The other cultural services, Science and education, Inspiration and Cultural heritage, are also dependent on the Enjoyment of scenery but to a lesser degree (orange boxes).
In the case of the litter being toxic, the ecosystem service Regulation of
hazardous substances may not be sufficient. If so, the Provision of food and the Provision of inedible goods (e.g. fodder) may be affected by the toxic chemicals entering the food web. The ecosystem service Regulation of hazardous
substances also impacts the services Legacy of the sea as well as Enjoyment of Recreation.
4
Policy instruments
4.1
Current policy instruments
A literature review was carried out to gather information on current policy instrument on marine litter. The review is based on the following reports: OSPAR (2009), HELCOM (2007), UNEP (2005, 2009), Galgani (2010) and Mouat et al. (2010). The policy instruments described below are divided into the following groups: “International/Global”, “European Union”, “Regional”, “National” and “Other”. Some of the policy instruments listed below are legally binding whereas other are initiatives carried out on a voluntary basis. The most important policy instruments are summarized in Table 4.1, which also indicates the main target of each policy instrument.
4.1.1 International/Global
The International Convention for the Prevention of Pollution from Ships (MARPOL 73/78) is a main international convention controlling pollution from
the shipping sector. The MARPOL Convention regulates types and quantities of waste that ships may discharge into the sea. Annex V is specifically relevant since it regards garbage. Annex V of the MARPOL Convention prohibits the dumping of garbage, specifically all plastics and synthetic materials including ropes and fishing nets into the ocean and is the leading international
instrument to control marine litter from shipping, including fishing vessels and leisure craft. The North Sea is a Special Area for the purpose of Annex V to MARPOL 73/78. This means that for Special Areas, discharges of garbage (except food waste) into the sea are prohibited. The Convention also requires countries surrounding Special Areas to provide appropriate reception facilities for ship-generated waste in their ports and harbors. The MARPOL has been subject to review the last few years also covering adjustments of Annex V.
London Convention on the Prevention of Marine Pollution by Dumping of Wastes and Other Matter, 1972 (LC)
was
signed in 1972 and regulates the disposal of waste at sea. Annex I of the London Convention prohibitssignatories (which include Sweden) from dumping persistent plastics and other non-biodegradable materials as well as other compounds into the sea from ships and other manmade structures. The convention does not address wastes that have been generated during the normal operation of ships. The Convention was recently reviewed to further strengthen the rules on dumping at sea, although there is still no direct reference to marine litter.
United Nations Convention on the Law of the Sea (UNCLOS) and the General Assembly (GA)
i
s a legal framework within which all activities in the oceans and seas must be carried out. Part XII of the Convention (Articles 192-237) addresses protection and preservation of the marine environment and gives basic obligations to prevent, reduce and control pollution from e.g. land-based sources, pollution from sea-bed activities, pollution by dumping and pollution from vessels.Further, articles 65-70 of resolution A/60/L.22 Oceans and the Law of the Sea from 2005 include a call for national, regional and global actions to address the problem of marine litter. The resolution notes e.g. the lack of information and data on marine litter and urges states to integrate the issue of marine litter within national environmental strategies, and encourages states to cooperate regionally and sub-regionally to develop and implement joint prevention and recovery programmes for marine litter.


](data:image/gif;base64,R0lGODlhAQABAIAAAP///wAAACH5BAEAAAAALAAAAAABAAEAAAICRAEAOw==)