Legibility of road marking symbols
in the roadway
ViP publication 2015-1
Authors
Sara Nygårdhs, VTI Göran Nilsson, SVMFPreface
The project Design and use of road marking symbols in the roadway is a collaborative project between the Swedish National Road and Transport Research Institute (VTI), the Swedish Road Marking Association (SVMF) and the Swedish Transport Administration (STA) within the competence centre Virtual Prototyping and Assessment by Simulation (ViP). The project was financed by ViP and the Swedish Transport Administration.
Project members have been:
Göran Nilsson (SVMF), project manager Björn Johansson (SVMF), supervisor Sara Nygårdhs (VTI), researcher Mats Lidström (VTI), supervisor
Jonas Andersson Hultgren (VTI), supervisor Anne Bolling (VTI), researcher
Sven-Olof Lundkvist (VTI), researcher Jonas Ihlström (VTI), researcher Torgny Augustsson (STA), supervisor Curt Danielsson (STA), supervisor Members of the reference group have been:
Lars-Eric Svensson (SVMF) Jonas Jansson (VTI)
Ruggero Ceci (STA)
The authors would like to thank Åsa Forsman at VTI for helpful assistance concerning data analyses, the participants for their participation in the different studies and Jonas Jansson at VTI for contributing to the Discussion chapter.
Linköping, December 2014
ViP 2015-1
Quality review
Peer review was performed on 14 January 2015 by Stas Krupenia, Scania and on 19 December 2014 by Lars Petersson, the Swedish Transport Administration. Sara Nygårdhs has made alterations to the final manuscript of the report on 4 February 2015. The ViP Director Lena Nilsson examined and approved the report for publication on 2 June 2015.
Table of contents
Executive summary ... 7
1 Introduction and aim ... 9
2 The simulator study ... 10
2.1 Procedure ... 10 2.2 Participants ... 11 2.3 Symbol characters ... 11 2.4 Symbol sizes ... 11 2.5 Speeds ... 12 2.6 Experimental design ... 12 2.7 Data analysis ... 14 2.8 Results ... 14
2.8.1 Influence of symbol size 15 2.8.2 Influence of number of characters and speed 16 3 Limited field study: Downscaled extremes of the simulator study ... 18
4 Validation field study: Constant symbol size (2.5 m) ... 19
4.1 Procedure ... 20
4.2 Data analysis ... 21
4.3 Results ... 21
5 Comparison between the simulator study and the validation field study 22 6 Questionnaires ... 25
7 Discussion ... 27
8 Conclusions ... 29
References ... 30
Appendix A – Participant instruction at simulator trial (in Swedish)
Appendix B – Questionnaire used in simulator study and in the field studies (in Swedish)
ViP 2015-1
List of Figures
Figure 1: Example views of road marking symbols in the simulator. Above: A two-character symbol. Below: A three-two-character symbol... 10 Figure 2: Effect of symbol size on compensated legibility distance. ... 16 Figure 3: Interaction effect of speed×number of characters on compensated legibility distance. ... 17 Figure 4: An example of the setting at the field test with downscaled extremes of the simulator study. Small (0.53 m) characters. ... 18 Figure 5: Photo from the validation field study with 2.5 m symbols. The characters in the current lane were the focus of attention for the participants. ... 19 Figure 6: Mean compensated legibility distance in the simulator study and in the
validation field study, 2.5 m symbol size and two-character symbols only. ... 23 Figure 7: Mean legibility distance dependence of study and speed for different reaction times. The continuous blue lines represent the simulator study, whereas the intermittent green lines represent the validation field study. The three graphs illustrate reaction times of 0.25 s, 0.5 s and 0.7 s, respectively. ... 24 Figure 8: Opinions on road marking symbols in the roadway. Questionnaire results from in total 31 participants in the simulator and field studies. ... 25
List of Tables
Table 1. Order of speed, symbol size and symbol combinations for participants in four different groups in the simulator study. Each group consisted of two women and two men. ... 13 Table 2. Results from the ANOVA of the simulator study. Significant effects are
marked in bold. ... 15 Table 3. Order of speed for the different symbols and participant groups in the
validation field study with constant symbol size (2.5 m). Each group consisted of three participants. ... 20 Table 4. Results from the ANOVA of the validation field study separately. Significant effects are marked in bold. ... 21 Table 5. Results from the nested ANOVA with the simulator study and the validation field study. Note that only two-character symbols and one symbol size were used. Significant effects are marked in bold. ... 22
Legibility of road marking symbols in the roadway
by Sara Nygårdhs1 and Göran Nilsson21 Swedish National Road and Transport Research Institute (VTI) 2 Swedish Road Marking Association (SVMF)
Executive summary
The regulations concerning road markings have recently opened up more for use of symbols in the roadway. However, regulations for the dimension of road marking symbols vary even between the Nordic countries, and research on how the symbols should be designed is lacking.
The aim of the ViP project described in this report was to establish guidelines for how symbols in the roadway should be extended along the road. In order to achieve the goal, a simulator study on legibility distances was carried out, followed by two minor field studies.
In the simulator study, four two-character symbols and four three-character symbols were used; 55, 56, 65, 66, 55N, 56N, 65S, 66S. For each of four symbol sizes; 1.6 m, 2.5 m, 4.0 m and 7.5 m and each of four speeds; 30, 50, 70 and 90 km/h, one two-character symbol and one three-two-character symbol were presented to the driver.
The simulator study resulted in a main effect of symbol size; the larger the symbol size, the larger the legibility distance. Another result was that the legibility distance
decreased when the speed increased.
As an attempt to check the results from the simulator a downscaled field study was carried out. The highest and lowest speed and the largest and the shortest symbol size in the simulator were used, although downscaled with a factor three. Comparing the results of the simulator and the downscaled field study, the speed effect was significant but weak, i.e. the effect size was small. To be able to establish if there is a speed effect that should be examined in a larger test, a validation field study was completed.
In the validation field study, the symbol size was always 2.5 m and the travel speeds were 30, 50, 70 and 90 km/h, in correspondence with the simulator speeds. The results of the validation field study showed no speed effect.
The simulator study in this project confirmed the logic of larger symbol sizes meaning longer legibility distances, but while the speed influenced legibility distance in the simulator this was not the case in the field. The legibility distances in the simulator were also shorter than in the field, possibly due to issues related to the graphics rendering. A conclusion from this is that in order to find out how much road marking symbols should be extended, supplementary field studies are needed. It is recommended that future studies include several symbol sizes but it would probably be sufficient to perform the tests at only two vehicle speeds; one low and one high. Data from such studies should also be used for developing the graphics rendering in the simulation.
1
Introduction and aim
During the recent years, the regulations concerning road markings have opened up more for use of symbols in the roadway (Trafikverket & Sveriges Kommuner och Landsting, 2012). In a report by Fors, Ihlström and Nygårdhs (2012) the existing regulations and guiding principles for use of road marking symbols in the Nordic countries together with the Netherlands, Great Britain and Germany were compiled. It was found that although there are regulations for the dimension of such symbols, mostly in terms of minimum symbol size in relation to the speed limit of the road, the regulations vary somewhat, even between the Nordic countries. Documented knowledge and research on how the symbols should be designed were also missing to a great extent. Some results of the studies referred to in the previously mentioned report were that speed markings coloured in white were just as good as using the regular colours of the corresponding road signs (Böök, Gärling & Gärling, 1989), and that using a triangular warning sign in the roadway increased the share of drivers looking to the right before arriving at an intersection with a bicycle crossing (Räsänen, Summala & Pasanen, 1998).
The aim of the ViP project described in this report was to establish guidelines for how much symbols in the roadway should be extended. To achieve the goal, a simulator study on legibility distances was carried out. To check the simulator results and to validate them, two minor field studies were accomplished. The three studies are reported separately but the results are discussed together in the Discussion chapter. Throughout the report, the word “size” is used to denote the length of the symbol along the road, i.e. the extension of the symbol.
10 ViP 2015-1
2
The simulator study
A simulator study was carried out in the vehicle simulator SIM III, which is a moving base simulator situated at VTI in Linköping, Sweden (for more info, see
http://www.vti.se/sv/forskningsomraden/fordonsteknik/vtis-simulatorer/ ). Eight road marking symbols (four two-character symbols and four three-character symbols), four symbol sizes and four speeds were used on a straight road.
Data from a total of 16 participants, eight men and eight women, was analysed. Each participant experienced only one two-character symbol and one three-character symbol for each size and speed combination, see Table 1.
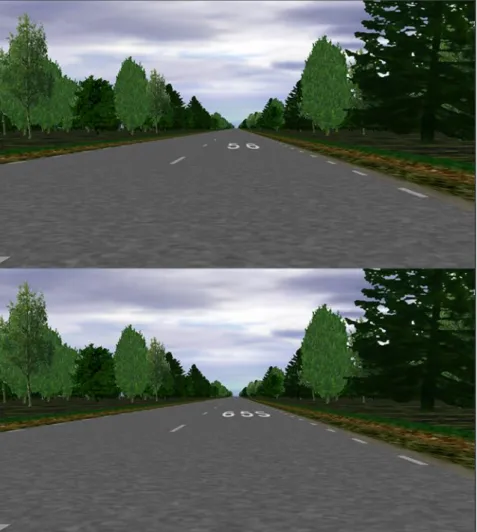
Figure 1 shows example views of the symbols used in the simulator.
Figure 1: Example views of road marking symbols in the simulator. Above: A two-character symbol. Below: A three-two-character symbol.
In a pre-study, the ViP project members drove the test, and after adjustments, a pilot study was carried out with two participants from VTI.
2.1
Procedure
Before arrival, the participants were prepared by reading some general information about the study that was distributed through mail in advance.
When arriving at VTI, the participants were given written (see Appendix A) and oral information about the test and were asked to fill out an informed consent form. Regularly through the driving session, road marking symbols were approached. The participants were instructed to press a hand-held button at the steering wheel in the car as soon as they were completely certain of what the symbol showed. When the button was pressed, the symbol disappeared and the participant verbally stated what the symbol had shown. A test leader noted in a protocol if the answer was correct or not. Every time that the button was pressed, the distance from the front axle of the vehicle to the part of the symbol that was nearest to the vehicle was registered.
The driving session started with a practice in which the drivers experienced all speeds, all symbol sizes and the characters used in the following experiment.
The driving session lasted for approximately 30 minutes and was followed by a small questionnaire regarding symbols in the roadway (see Appendix B). In total, the
participants stayed at VTI for about one hour and were given two tickets to the cinema for their participation.
2.2
Participants
The participants were mainly recruited from the VTI data base of volunteers. However, essentially due to lack of female volunteers, some participants were recruited within the circle of acquaintances of the project members. In total, 8 women and 8 men were included in the experiment, aged 20-69 years (median 39,5 years) and who took their driver’s license 2-51 years ago (median 18 years). The participants estimated their total mileage the last 12 months to be 700-25 000 km (median 10 000 km). In the analyses the participant variable is denoted Part.
2.3
Symbol characters
The symbols were chosen in order for the participants to have to read each character so no guessing could be suspected. The symbols were based on the Vienna convention (Utrikesdepartementet, 1989). The digits 5 and 6 are of similar shape using the fonts in the convention and therefore, all digit combinations of these were used as two-character symbols. To test three-two-character symbols, N and S for north and south were used. To avoid expanding the number of trials too much, the letters were not combined with all digits. Hence, the resulting symbols used were: 55, 56, 65, 66, 55N, 56N, 65S and 66S. In the analyses the variable for number of characters is denoted Char.
2.4
Symbol sizes
Each of the symbols was made in four different sizes, i.e. lengths of the symbols along the road, which were chosen on several grounds. First, 1.6 m and 4.0 m were chosen in accordance with the Vienna convention (Utrikesdepartementet, 1989). Second, 1.6 m is the minimum size for symbols on Swedish roads with speed limit less than 70 km/h and 2.5 m is the minimum size on roads with speed limit of 70 km/h and more, as stated by the Swedish Transport Agency (Transportstyrelsen, 2010). Third, the Swedish
Transport Agency also states a size of 7.5 m for lane change arrows if the posted speed limit is more than 60 km/h (Transportstyrelsen, 2010). In reality, symbols such as “E4” can also be seen in the size of 7.5 m. Hence, the symbol sizes chosen for the simulator
12 ViP 2015-1
2.5
Speeds
Four speeds were used in the simulator test. The speeds were automatically set and could not be influenced by the participants. Since the pre-study with the project members showed that the legibility of symbols in the roadway was inadequate for speeds of 100 km/h, speeds ranging from 90 km/h to 30 km/h were used in the study. Thus, the speeds used were 30, 50, 70 and 90 km/h. Half of the participants started with the lowest speed and experienced step-wise increased speed ending with the highest speed, while half started with the highest speed and experienced step-wise decreased speed ending with the lowest speed. In the analyses this variable is denoted Speed.
2.6
Experimental design
Although there is no reason to believe that the symbol order should influence the data, half of the participants were presented one symbol order and the other half another order (see “symbol” columns in Table 1). All participants experienced both combinations of number of symbol characters (2), all symbol sizes (4) and speeds (4), which was a total of 32 combinations. Table 1 shows the order of the combinations for the four groups with 4 participants in each group.
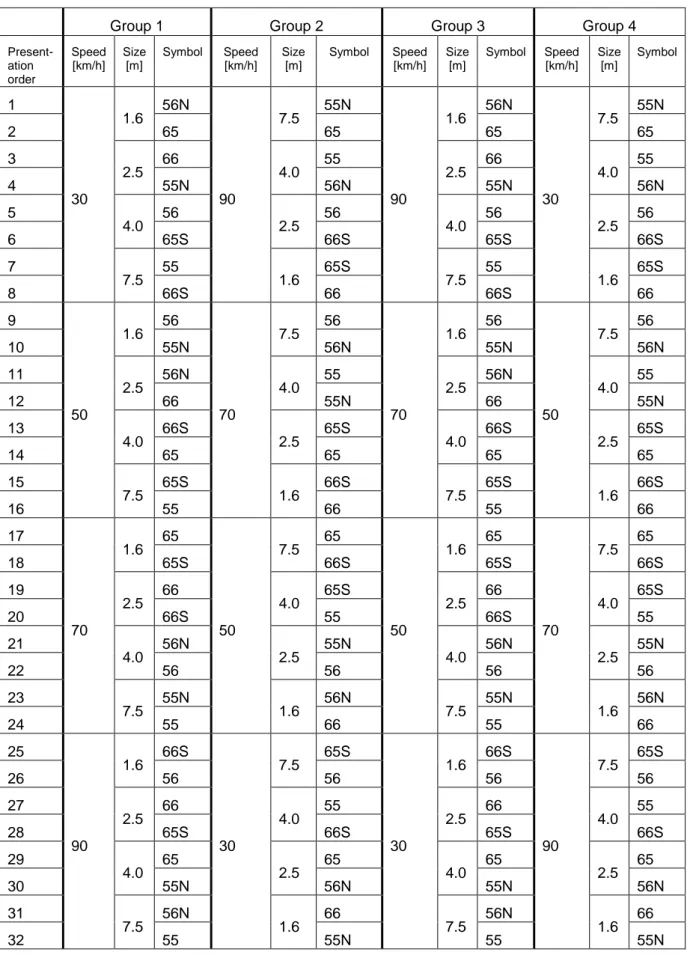
Table 1. Order of speed, symbol size and symbol combinations for participants in four different groups in the simulator study. Each group consisted of two women and two men.
Group 1 Group 2 Group 3 Group 4
Present-ation order Speed [km/h] Size [m] Symbol Speed [km/h] Size [m] Symbol Speed [km/h] Size [m] Symbol Speed [km/h] Size [m] Symbol 1 30 1.6 56N 90 7.5 55N 90 1.6 56N 30 7.5 55N 2 65 65 65 65 3 2.5 66 4.0 55 2.5 66 4.0 55 4 55N 56N 55N 56N 5 4.0 56 2.5 56 4.0 56 2.5 56 6 65S 66S 65S 66S 7 7.5 55 1.6 65S 7.5 55 1.6 65S 8 66S 66 66S 66 9 50 1.6 56 70 7.5 56 70 1.6 56 50 7.5 56 10 55N 56N 55N 56N 11 2.5 56N 4.0 55 2.5 56N 4.0 55 12 66 55N 66 55N 13 4.0 66S 2.5 65S 4.0 66S 2.5 65S 14 65 65 65 65 15 7.5 65S 1.6 66S 7.5 65S 1.6 66S 16 55 66 55 66 17 70 1.6 65 50 7.5 65 50 1.6 65 70 7.5 65 18 65S 66S 65S 66S 19 2.5 66 4.0 65S 2.5 66 4.0 65S 20 66S 55 66S 55 21 4.0 56N 2.5 55N 4.0 56N 2.5 55N 22 56 56 56 56 23 7.5 55N 1.6 56N 7.5 55N 1.6 56N 24 55 66 55 66 25 90 1.6 66S 30 7.5 65S 30 1.6 66S 90 7.5 65S 26 56 56 56 56 27 2.5 66 4.0 55 2.5 66 4.0 55 28 65S 66S 65S 66S 29 4.0 65 2.5 65 4.0 65 2.5 65 30 55N 56N 55N 56N
14 ViP 2015-1
2.7
Data analysis
Considering that it takes a certain time to react by pressing the button, the legibility distances were compensated for this using the following formula:
, where distancecomp is the compensated legibility distance, and distancemeas is the
measured legibility distance.
A reaction time of 250 ms was used for calculating the legibility distances for all participants. For instance, a speed of 70 km/h would result in a compensated legibility distance of:
4.86 m
For analysis of the influence of choice of reaction time, see also Chapter 5.
In analyses with only one value per cell, the error term cannot be calculated and hence there is no interaction estimate.
All tests are performed at the risk level 5% (significance level p<.05). The effect size measure ω2 is used for estimating how strong the effects are. An effect size of .01 represents a small effect, .06 a medium effect and .15 a large effect (see for instance Keppel, 1982).
2.8
Results
An ANOVA with (compensated) legibility distance as dependent variable and Size, Speed and Char as independent variables with Part as random variable was carried out in SPSS. Since every participant only experienced one symbol with two characters and one with three characters for every size and speed, no 4-way interaction effect of Size×Speed×Char×Part could be calculated. Table 2 shows the results of the ANOVA for the simulator study.
Table 2. Results from the ANOVA of the simulator study. Significant effects are marked in bold.
Effect F df sign. MS effect size,
ω2 Size 302.36 3 p<.001 14078 .66 Speed 22.97 3 p<.001 898 .04 Char 24.63 1 p<.001 374 .01 Part 9.77 15 p<.001 806 .17 Size×Speed 0.44 9 p=.912 4.7 .00 Size×Char 0.71 3 p=.550 6.7 .00 Size×Part 4.27 45 p<.001 47 .03 Speed×Char 3.46 3 p=.024 26 .00 Speed×Part 4.38 45 p<.001 39 .02 Char×Part 1.97 15 p=.098 15 .00 Size×Speed×Char 0.94 9 p=.497 8.5 .00 Size×Speed×Part 1.16 135 p=.193 11 .00 Size×Char×Part 1.03 45 p=.434 9.4 .00 Speed×Char×Part 0.82 45 p=.783 7.4 .00 Error 9.14
2.8.1 Influence of symbol size
In the simulator study there was a large main effect of symbol size, F(3,45)=302.36, p<.001, ω2 = .66, meaning that the larger the symbol size, the longer the legibility
16 ViP 2015-1
Figure 2: Effect of symbol size on compensated legibility distance.
2.8.2 Influence of number of characters and speed
There was a weak interaction effect of speed×number of characters, F(3,45)=3.46, p=.024, ω2 < .01. Figure 3 shows an inverse relationship between legibility distance and
speed, i.e. high speed means short distance. Furthermore, the legibility distance is shorter for three-character than for two-character symbols, at least at speeds higher than 30 km/h.
Figure 3: Interaction effect of speed×number of characters on compensated legibility distance.
18 ViP 2015-1
3
Limited field study: Downscaled extremes of the simulator
study
In an attempt to check the results obtained in the simulator a field study was carried out. It was limited to the extremes used in the simulator, i.e. to the highest and lowest speeds and the largest and smallest symbol sizes, although for practical reasons downscaled with a factor three to the speeds 10 km/h and 30 km/h and the symbol sizes 0.53 m and 2.5 m. Only two-character symbols were used.
The road used in the limited field study was a straight two-lane road stretch. An
example of the experiment setting is shown in Figure 4. Nine participants were recruited for the task, not the same as in the simulator study. The procedure was the same as in the validation field study, which is further described in Section 4.1.
The data analysis was basically the same as in the simulator study, with the addition that the legibility distance was further multiplied by a factor of three after the compensation for reaction time had been made.
Comparing the results of the simulator study and the downscaled field study in a nested ANOVA, the speed effect was significant, but the size of that effect was small and more of a tendency, F(1,19)=8.80, p=.008, ω2 < .01. In the simulator the mean legibility
distance was 29 m in 30 km/h and 23 m in 90 km/h, whereas in the field it was 61 m in 30 km/h and 59 m in 90 km/h.
To establish if there was a speed effect that should be examined in a larger test, a validation field study was carried out (see Chapter 4).
Figure 4: An example of the setting at the field test with downscaled extremes of the simulator study. Small (0.53 m) characters.
4
Validation field study: Constant symbol size (2.5 m)
In the validation field study, the symbol size was always 2.5 m and only two-character symbols were used. Figure 5 shows an example of the setting (the road used was the same two-lane road as in the limited field study). The travel speeds were 30, 50, 70 and 90 km/h, in correspondence with the simulator study.
Six people from VTI, four men and two women participated in this study. The
participants were aged 24-64 years (median 35.5 years), they took their driver’s license 5-38 years ago (median 16.5 years) and estimated their total mileage the last 12 months to be 600-25 000 km (median 12 500 km). Half of them started with the lowest speed and the speed was increased, whereas the other half started with the highest speed and the speed was decreased. See the experimental design in Table 3.
Figure 5: Photo from the validation field study with 2.5 m symbols. The characters in the current lane were the focus of attention for the participants.
20 ViP 2015-1
Table 3. Order of speed for the different symbols and participant groups in the
validation field study with constant symbol size (2.5 m). Each group consisted of three participants.
Presentation order Symbol Group 1 Group 2 Speed [km/h] Speed [km/h] 1 56 30 90 2 66 30 90 3 65 50 70 4 55 50 70 5 56 70 50 6 55 70 50 7 65 90 30 8 66 90 30
4.1
Procedure
The participants were transported by car to the test site, and given written and oral information about the test. Their instructions were the same as in the simulator study (see Appendix A) as well as in the downscaled field study, i.e. they should be absolutely sure of what the symbol showed before they pressed a button in the car and at the same time spoke out loud what the symbol showed. However, in contrast to the simulator, the participant was not a driver but a front seat passenger. When the participant had pressed the button in the car, a digital trip meter was set to zero and began counting meters. After this, the driver stopped the car and told the test leader how many meters were driven since the button was pressed. With the aid of markers on the side of the road the legibility distance to the symbol was estimated, with an uncertainty of approximately one metre.
The driving session started with a practice phase in which the participants experienced the speeds 30 km/h and 90 km/h as well as the characters that were used in the study. Then, the real experiment started and the legibility distances were communicated by the driver to the test leader who noted the results in a protocol. After each drive, i.e. after reporting each legibility distance, the driver drove to the end of the test route and stopped with the front of the car in the opposite direction of the symbol. The test leader arranged a new symbol setting and then communicated that everything was ready for the next drive, whereupon the driver drove the participant towards a new symbol. The procedure was repeated until the test was completed. The driving session lasted for about 15-20 minutes for each participant, and was followed by a small questionnaire regarding symbols on the roadway. The questionnaire was identical to the one used in the simulator study (see Appendix B). Including transportation to and from the test site as well as dwell time waiting for the other participants to finish their task, each person participated for less than two hours.
4.2
Data analysis
Considering that it takes a certain time to react by pressing the button the legibility distances were compensated for this using the same formula as in the simulator study:
, where distancecomp is the compensated legibility distance, and distancemeas is the
measured legibility distance.
In accordance with the simulator study a reaction time of 250 ms was used for calculating the compensated legibility distances for all participants.
In analyses with only one value per cell, the error term cannot be calculated and hence there is no interaction estimate.
All tests are performed at the risk level 5% (significance level p<.05). The effect size measure ω2 is used for estimating how strong the effects are. An effect size of .01 represents a small effect, .06 a medium effect and .15 a large effect (see for instance Keppel, 1982).
4.3
Results
The results of the validation field study show no influence of speed on legibility distance, F(3,15)=1.03, p=.406, ω2<.01 (see Table 4 for the analysis and Figure 6 for legibility distances).
Table 4. Results from the ANOVA of the validation field study separately. Significant effects are marked in bold.
Effect F df sign. MS effect size,
ω2
Speed 1.03 3 p=.406 37 .00
Part 15.34 5 p<.001 556 .75
Speed×Part 1.86 15 p=.085 36 .07
22 ViP 2015-1
5
Comparison between the simulator study and the validation
field study
Considering that the results of the simulator study and the validation field study were not consistent, it would be of interest to compare the results in a statistical analysis. Since each participant only participated in one of the studies, a nested ANOVA (a hierarchical ANOVA) was performed. Table 5 shows the analysis of variance.
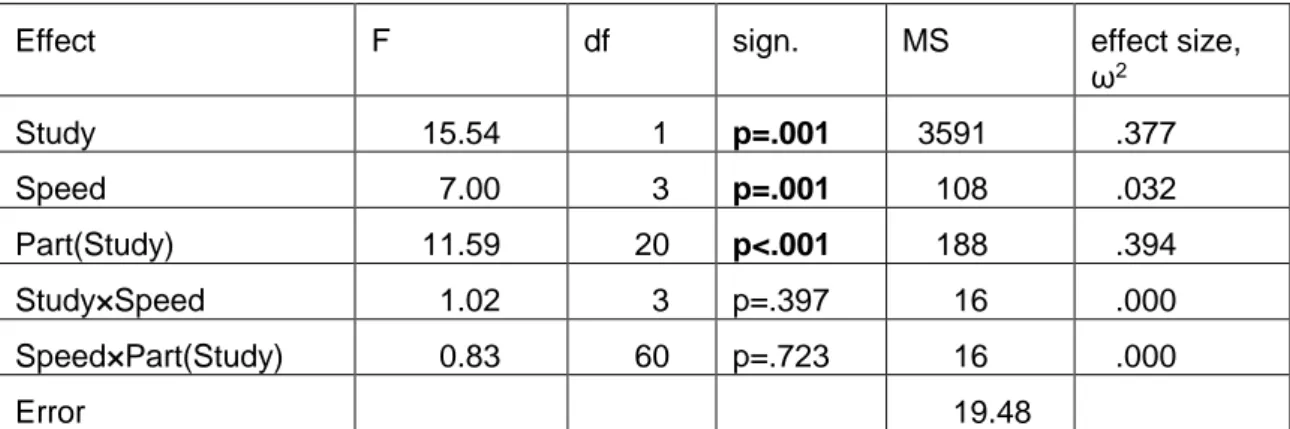
Table 5. Results from the nested ANOVA with the simulator study and the validation field study. Note that only two-character symbols and one symbol size were used. Significant effects are marked in bold.
Effect F df sign. MS effect size,
ω2 Study 15.54 1 p=.001 3591 .377 Speed 7.00 3 p=.001 108 .032 Part(Study) 11.59 20 p<.001 188 .394 Study×Speed 1.02 3 p=.397 16 .000 Speed×Part(Study) 0.83 60 p=.723 16 .000 Error 19.48
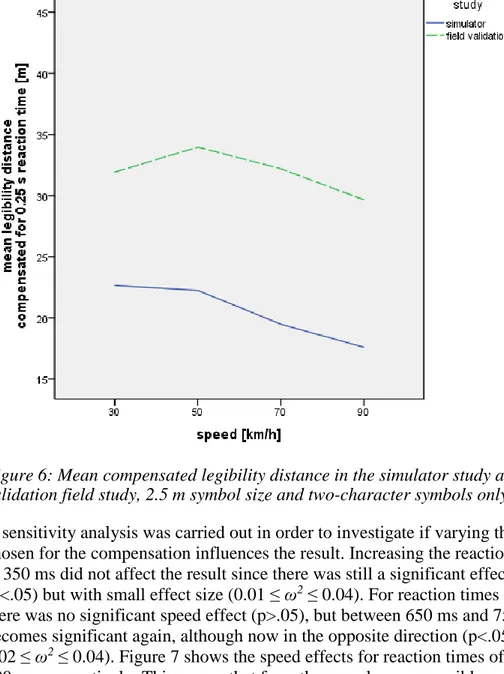
The analysis shows that there is a main effect of study (F(1,19)=15.5, p=.001, ω2 = .38) since the legibility distances (compensated for 0.25 s reaction time) were shorter in the simulator (mean=20.5 m, SD=5.2 m) than in the field (mean=31.9 m, SD=9.1 m). There was also a main effect of speed (F(3,33)=7.00, p=.001, ω2 = .03). However, the speed explains only 3% of the variance. Figure 6 shows these results.
Figure 6: Mean compensated legibility distance in the simulator study and in the validation field study, 2.5 m symbol size and two-character symbols only.
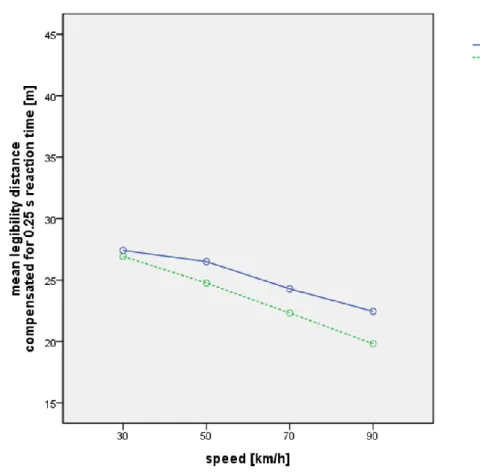
A sensitivity analysis was carried out in order to investigate if varying the reaction time chosen for the compensation influences the result. Increasing the reaction time from 250 to 350 ms did not affect the result since there was still a significant effect of speed (p<.05) but with small effect size (0.01 ≤ ω2 ≤ 0.04). For reaction times of 400-600 ms, there was no significant speed effect (p>.05), but between 650 ms and 750 ms the effect becomes significant again, although now in the opposite direction (p<.05;
0.02 ≤ ω2 ≤ 0.04). Figure 7 shows the speed effects for reaction times of 250, 500 and 700 ms, respectively. This means that from these analyses, a possible speed effect cannot be rejected. However, considering that the reaction times are probably less than one second, if there is a speed effect, it does not seem to be very large.
24 ViP 2015-1
Figure 7: Mean legibility distance dependence of study and speed for different reaction times. The continuous blue lines represent the simulator study, whereas the intermittent green lines represent the validation field study. The three graphs illustrate reaction times of 0.25 s, 0.5 s and 0.7 s, respectively.
6
Questionnaires
Results from the questionnaires given to the participants in the simulator study (16 persons) and in the two field studies (15 persons in total) are described in the following:
All of the participants both in the simulator study and in the field studies had experience of road marking symbols in the roadway; 71% stated that they had a little experience and 29% stated that they had large experience.
Concerning personal opinions on road marking symbols, the questionnaire contained seven statements which the participants should mark if they agreed to: unnecessary, useful, no opinion/do not know, good, bad, annoying and fun. Multiple answers were possible.
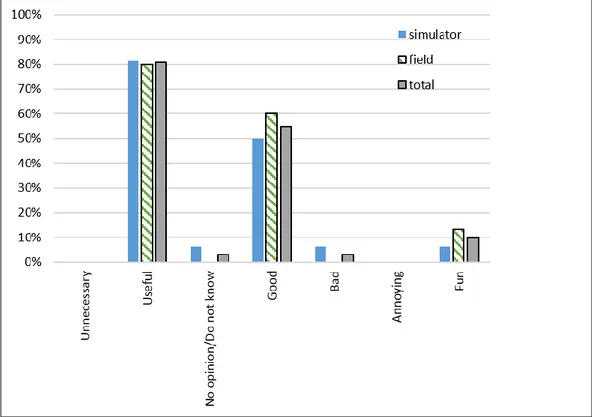
The proportion of participants (in the simulator study and in the field studies, separately as well as together) agreeing to each statement is given in Figure 8.
Figure 8: Opinions on road marking symbols in the roadway. Questionnaire results from in total 31 participants in the simulator and field studies.
Most participants, 81%, found road marking symbols to be useful. However, some additional comments on that were that road marking symbols can be used as
reinforcement of other information and that they are detected late (simulator participant comment) and may be hidden, explaining why this particular participant also marked that symbols in the roadway may be bad. Another comment from a simulator participant
26 ViP 2015-1
clear.) Another comment from a participant in the downscaled field study who stated that road marking symbols are useful was that they may be useful in certain
applications. Yet another comment from a participant in the validation field study, i.e. where the symbols were 2.5 m, was a wish for the symbols to be larger. It can be noted that the three participants considering road marking symbols fun, also considered them to be useful and good.
Finally, none of the participants thought road marking symbols in the roadway are unnecessary or annoying.
7
Discussion
Use of a driving simulator makes it possible to test a lot of different conditions in a fast and controlled way. The simulator study in this project confirmed the logic of larger symbol sizes meaning longer legibility distances, as well as more characters leading to shorter legibility distances. However, a simulator study cannot be trusted for absolute legibility distances.
When the validation field study had been carried out, it was clear that there were some discrepancies in results between the simulator study and the validation field study. Since only one of the symbol sizes and only two-character symbols were used in both studies, the influence of speed was interesting to examine. While the speed influenced legibility distance in the simulator, this was not the case in the field (although the time before passing the road marking symbol was of course shorter for higher speeds), at least not for the specific symbol size tested. Also, the legibility distances in the simulator were significantly shorter than in the field.
The cause for this has not been thoroughly analyzed. However, after the study was carried out some issues related to the graphics rendering in the simulation were noticed. It appears that the symbol was more blurred than the lane marking adjacent to the symbol at the same distance. There can be several explanations for this, e.g. the resolution on the texture of the symbol, the mapping of the texture to the 3D mesh, antialiasing and 3D settings of the graphics card etc. The visualization hardware also has restrictions in terms of brightness, contrast and resolution performance. Because of the perspective, markings on the road are much more challenging to the computer graphics compared to a road sign. However, this does not explain the perceived difference between the symbol and the lane marking.
A conclusion from this is that in order to find out how much road marking symbols should be extended, supplementary field studies are needed. Data from such studies should also be used for developing the graphics rendering in the simulation to find out if it is possible to achieve the same legibility distances in the simulator as in real life. Considering that the comment on that the symbols should be larger came from a participant (aged 64) who had experienced 2.5 m symbol sizes in the validation field study, symbol sizes larger than 2.5 should be tested. Limiting the symbols to be tested in a similar way as we did in this study, a future study should include several symbol sizes but it would probably be sufficient to perform the tests at only two vehicle speeds; one low and one high.
In the field tests described in this report, a test leader replaced each symbol with a new one by hand before each drive. Each character forming the 2.5 m long symbols used consisted of two pieces that had to be put together by hand to a “5” or a “6”,
respectively. However, the larger the symbols are, the more difficult they are to handle and therefore, in practice, it is probably not possible to use the same procedure for larger symbol sizes. If larger symbols are to be placed on the road, the legibility distances will most likely be longer. Hence, another challenge is to find a road stretch that is long enough to perform tests on.
It could be argued that the fact that there were different participants in the different studies could have influenced the results. Although there were some minor differences
28 ViP 2015-1
systematic differences in legibility ability between the participants in the simulator study and in the validation field study, but considering the similar age spans this is not very likely. A difference between the studies was that in the field it was not possible to make the symbols disappear as they did in the simulator study. Instead the participants were told to look away from the road as soon as they had pressed the button. Whether they really conformed to that was not controlled for.
A general result of the two field studies is that legibility distances are short, around 30 m, for minimum symbol sizes stated by the Swedish Transport Agency. In order to establish regulations for the use of road marking symbols, the road authority needs to know which symbol size to use at different traffic speeds. This means that absolute legibility distances must be estimated, which seems to be impossible from a simulator study. Therefore, in the future it is necessary to carry out further field studies, which must be so comprehensive that results can be generalized to all types of symbols on all types of roads. The results from a large field test could also be used as a basis for developing road marking symbols in the simulator.
Finally, it is worth mentioning that from the groups of people participating in the studies described in this report, a majority stated that they found road marking symbols useful. Considering the expected information given by road marking symbols to the drivers, the establishment of criteria for road marking symbol design is a deserving cause.
8
Conclusions
The aim of the project was to try to establish guidelines for how much symbols in the roadway should be extended. This was meant to be accomplished by simulator studies. However, one conclusion from the project is that the simulator, at least at the time of the trial, may not be suited for these kinds of studies. It would therefore be valuable to analyse why and how to get closer to the field situation. As a consequence, the question of how symbols in the roadway should be extended is still not answered. In order to do so, future studies in the field are recommended, but it would probably be sufficient to test only two vehicle speeds.
30 ViP 2015-1
References
Böök, A., Gärling, T., & Gärling, F. (1989). Bilförares förmåga att identifiera
vägmärken markerade på körbanan. Umeå: Trafik- & transportforskningsenheten i Umeå.
Fors, C., Ihlström, J., & Nygårdhs, S. (2012). Symboler i vägbanan. En
sammanställning av gällande regelverk i Danmark, Finland, Norge, Sverige, Nederländerna, Storbritannien och Tyskland. VTI notat 27-2012. Linköping: VTI (the Swedish National Road and Transport Research Institute).
Keppel, G. (1982). Design and Analysis: A Researcher’s Handbook. Second edition. New Jersey, USA.
Räsänen, M., Summala, H., & Pasanen, E. (1998). The safety effect of sight obstacles and road markings at bicycle crossings. Traffic Engineering and control, 39, pp. 98-102.
Trafikverket & Sveriges Kommuner och Landsting. (2012). Krav för vägars och gators utformning. Trafikverkets publikation 2012:179.
Transportstyrelsen. (2010). Transportstyrelsens föreskrifter om vägmarkeringar. Transportstyrelsens författningssamling, TSFS 2010:171.
Utrikesdepartementet. (1989). Tilläggsprotokoll om vägmarkeringar till den europeiska överenskommelsen som utgör tillägg till konventionen om vägmärken och signaler öppnad för undertecknad i Wien den 8 november 1968: Geneve den 1 mars 1973. Sveriges överenskommelser med främmande makter (Vol. 1989:5). Stockholm: Utrikesdepartementet.
Appendix A – Participant instruction at simulator trial (in Swedish)
ViP symboler i körbanan Deltagarinstruktion 1a 2013-05-20
Välkommen till ett simulatorförsök på VTI!
Detta projekt handlar om symboler i vägbanan. Du kommer att få köra bil i olika
hastigheter med en farthållare som sköts av försöksledaren så du behöver varken
röra gas eller broms utan bara styra.
Vid flera tillfällen kommer du att få se siffror och bokstäver på vägen. Dessa
ligger alltid i höger körfält och du ska köra i detta körfält. Ibland är det två
tecken bredvid varandra, ibland tre. Din uppgift är att läsa dessa tecken.
När du är helt säker på vad symbolen visar (vilka siffror och bokstäver det står)
ska du göra två saker:
1. Trycka på en knapp (som försöksledaren kommer att visa dig)
2. Högt och tydligt säga vilka siffror och bokstäver som fanns på vägen.
När du tryckt på knappen försvinner symbolen så det är viktigt att du är helt
säker på vad det står när du trycker på knappen!
Om tecknen du ser t.ex. är ”34” vill vi att du säger ”tre, fyra” istället för
”trettiofyra”.
Innan den riktiga körningen kommer du att få köra en träningsdel där du får öva
på denna uppgift.
Försöksledaren kan se och höra dig i simulatorn under hela försöket.
Försöksledaren kommer inte att prata med dig under försöket men det är viktigt
att du säger till så fort någonting inte känns bra. Du ska inte öppna dörren till
simulatorn själv.
Försöket tar ca 1 timme totalt, varav körning ca 30 minuter. Som tack för din
medverkan får du två biobiljetter.
Appendix B – Questionnaire used in simulator study and in the field
studies (in Swedish)
FP-nr: ______
Kvinna
Man
Födelseår: ____________
Körkortsår: ____________
Antal körda mil de senaste 12 månaderna: Ca______________mil_
Jag använder farthållare:
Aldrig Ibland Ofta
Jag har erfarenhet av symboler i vägbanan på verklig väg:
Inte alls Ja, liten Ja, stor
Vilken är din personliga uppfattning om symboler i vägbanan? Flera alternativ är möjliga.
Onödigt Användbart Ingen åsikt/Vet ej Bra Dåligt Irriterande Roligt Övriga kommentarer:________________________________________________________________
ViP
Virtual Prototyping and Assessment by Simulation
ViP is a joint initiative for development and application of driving simulator methodology with a focus on the interaction between humans and technology (driver and vehicle and/or traffic environment). ViP aims at unifying the extended but distributed Swedish competence in the field of transport related real-time simulation by building and using a common simulator platform for extended co-operation, competence development and knowledge transfer. Thereby strengthen Swedish competitiveness and support prospective and efficient (costs, lead times) innovation and product development by enabling to explore and assess future vehicle and infrastructure solutions already today.