The Price Boom in Oslo’s
Housing Market
The possibility of a bubble
Bachelor’s Thesis within Business Administration
Author: Kajsa Lindgren
Tutor: Urban Österlund
Bachelor’s Thesis in Finance
Title: The Price Boom in Oslo’s Housing Market – The possibility of a bubble
Author: Kajsa Lindgren
Tutor: Urban Österlund
Date: 2013-08-29
Subject terms: Housing market, price boom, price bubble, housing bubble, Oslo’s housing market, house buyers, price expectations, fundamental value, macroeconomic market variables, house bubble indicators, behavioral finance, irrational buying behavior
Abstract
The price of hosing in Norway has been increasing for well over 20 years. In the last decade the increase in price has gotten steeper and speculation about a house bubble, that lately have affected many other housing markets around the globe, now prevails Oslo’s housing market.
The purpose of this thesis is to analyze possible market factors impact on Oslo’s housing prices in order to understand the possible cause of the price increase and evaluate the possibility of a bubble.
The result of this thesis was gained by looking at:
1. Changes in market variables, such as income, interest rate and population that could possibly justify the price increase of housing.
2. Housing bubble indicators, tools to help predict a housing bubble.
3. The behavior and expectation of housing buyers, as the main cause of price bubble are said to be unjustified (price) expectations.
The study was performed by first collecting premade statistical data, which was used to review changes in the market, and by studying bubble indicators. Further, telephone interviews were made with real estate agents who were interviewed about their observations of housing buyer’s behavior in Oslo.
The result gained from the research was interpreted with the help of pre-studied theory on subject. The interviews regarding the housing buyers were interpreted in the light of behavioral finance that explains how human behavior can affect competitive markets. The conclusion of the study is that the buyers in Oslo’s housing market have affected price to some extent but a bubble is not predicted in the housing market of Oslo. Hence, the increase seen in the market can mostly be derived from changes in market variables.
i
Table of Contents
1 Introduction ... 1
1.1 Background ... 2
1.1.1 Defining a bubble in housing markets ... 2
1.1.2 Housing Markets ... 3
1.1.3 Comparing housing markets ... 3
1.3 Problem discussion ... 6 1.3.1 Purpose ... 6 1.3.2 Research questions ... 7 1.4 Delimitations ... 7 1.5 Method approach ... 8 1.6 Disposition ... 8
2 Frame of references ... 10
2.1 Economic variables affecting the housing market ... 10
2.1.1 The fundamental value ... 10
2.1.2 Construction costs ... 10
2.1.3 Income and interest rate ... 11
2.1.4 Employment and population growth ... 11
2.1.5 Supply of housing ... 12
2.1.6 The effects of macroeconomic variables ... 12
2.2 Bubble Indicators ... 13
2.2.1 Price-to-income and price-to-rent ratio ... 13
2.2.2 Indications of unstable lending ... 13
2.2.3 Indicators of speculation and irrational buyers ... 14
2.3 Behavioral finance – Human behavior’s effect on housing markets ... 15
2.3.1 Market inefficiency and word-of-mouth ... 16
2.3.2 Irrational price expectations ... 16
2.3.3. Over-confidence ... 17
2.3.4 Herd behavior ... 17
2.3.5 Consequences of the human behavior on housing markets ... 17
3 Method ... 19
3.1 Research philosophy and approach ... 19
3.2 Quantitative and qualitative methods ... 19
3.3 Question 1 – Market variables ... 20
3.4 Question 2 - Indicators ... 21
3.5 Question 3 – The housing buyers’ behavior ... 21
3.5.1 The survey ... 22
3.5.2 The Selection process ... 23
3.5.3 The result ... 23
3.6 Validity and reliability ... 23
4
Empirical findings and interpretation ... 25
4.1 Part I. Economic variables ... 25
4.1.1 Construction cost, income and interest rate ... 25
ii
4.1.3 The housing supply in Oslo ... 31
4.1.4 Aggregated impact of market variables ... 32
4.2 Part II. Bubble indicators ... 33
4.2.1 Indicator ratios ... 33
4.2.2 Number and age of homeowners compared to tenants ... 35
4.2.3 Loan-to-value ratio and interest payments in relation to income ... 37
4.3 Part III. The housing buyers’ behavior ... 38
4.3.1 The result and interpretation of the interviews ... 38
4.3.2 The opinion of the real estate agents ... 39
4.3.3 The housing buyers’ expectations and demand ... 39
4.3.4 Housing as investment and the perceived risk of house purchase ... 41
4.3.5 Housing market excitement ... 42
4.3.6 Summarizing the interview results ... 43
5 Conclusion ... 45
5.1 Answering research question one ... 45
5.2 Answering research question two ... 45
5.3 Answering research question three ... 46
5.4 Final conclusion ... 46
5.5 Reflections ... 47
5.6 Suggested further research ... 47
iii
Appendix
Appendix 1. Survey Questions for the telephone interview with estate agents in Oslo ... 51 Appendix 2-4. The answers from the telephone interviews ... 52
1
1 Introduction
Norway, the country of oil that stands strong outside of the European Union has seen an enduring increase in housing prices for over 20 years. Further, Norway’s economy was one of the few economies that were mildly affected by the financial crisis of 2008. Compared to many other economies in the world today, the economy of Norway is financially sound and stable and should have no problem to meet another international downturn. However, as the world economy is influenced by a high level of uncertainty it cannot be excluded that Norway’s economy might be unable to handle a new crisis as well as the they did in 2008. Of great concern are today’s high housing prices and the increasing debt level among households, both seen as the biggest national risk factors affecting Norway’s stable economy. If Norway’s economy suddenly would change direction house prices might fall as households would be forced to cut back on spending, which in turn would have further negative effects on the economy as a whole (Finanstilsynet, 2012). As of yet, housing prices in Norway are still increasing (Statistisk Sentralbyrå, SSB, 2013a).
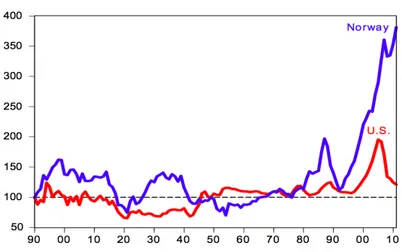
Figure 1.1, below, taken from the Bank of Norway shows the pattern of real housing prices in Norway compared to the United States whose bubble burst in 2006/2007. From the figure one can tell that Norway experienced a house bubble in the late 1980’s that burst in the beginning of the 1990’s. After that a rapid increase that even sharpens after the short downturn connected to the financial crisis is seen.
Figure 1.1 Real House Price Indices: 1890 to 2011. Source: Norges Bank (2013).
Looking at the price development presented in figure 1 it seems natural that speculations about a Norwegian house bubble occurs. The price development has been given a lot of attention in the media that has even reported warnings about a bubble in the housing market of Oslo, Norway’s capital. The buyers are said to act irrationally and believe that prices will keep increasing, which according to an expert would indicate a bubble (Varsler norsk boligboble, 2013). Yet, many doubt the existence of a bubble in Oslo’s housing
2
market. They claim the price boom can be explained by natural factors, such as increase in household income, low rate of unemployment and the growth in population (Boligprisene kan falle, 2013).
The aim of this thesis is to present a study of Oslo’s housing market that has the highest price of housing in Norway and where the price increase has been the most intense (Boligstatestik, 2013). The paper will study what underlying factors have caused the price to keep increasing and the possibility of a bubble.
1.1 Background
The background will begin with a look at the definition of a bubble in housing markets and continue with the concept of housings markets, which will be followed by short review of different housing markets.
1.1.1 Defining a bubble in housing markets
Bubbles in housing market are not a new occurrence (Quigley, 2001) however; the usage of the term is quite new. It was first in 2002 that media picked up on the term ‘housing bubble’ (Case & Shiller, 2003). Since then the term has been used frequently, especially lately as several housing markets around the globe have experienced bubbles, followed consequently by bursts. Yet the concept of a price bubble is rather complicated.
In peoples mind the occurrence of a price bubble imply a negative judgment and defines an opinion that current price levels cannot be sustained (Case & Shiller, 2003). Lind (2009), wish to focus on the price movement when defining a bubble; the extreme increase followed by a dramatic fall. There is no clear or recognized definition of bubble, yet, one of the most commonly known definitions of a price bubble is Stiglitz’:
"If the reason that the price is high today is only because investors believe that the selling price is high tomorrow - when 'fundamental' factors do not seem to justify such a price - then a bubble exists" (Stiglitz 1990, p. 13).
The definition implies that a bubble occurs as a result of irrational believes not based on fundamental factors. To understand the definition fully, the meaning of ‘fundamental’ factors should be identified. Fundamental factors are factors effecting supply and demand to change (Englund, 2011). When Case and Shiller (2003), wanted to examine whether changes in fundamental factors could justify the price booms in housing markets; they studied the change of different economic factors that are typically causing ‘natural’ price increases in housing, such as income growth, population growth and low interest rates. Thus, changes in a market’s economic conditions that cause price to fluctuate in response to these changes (Quigley, 2001). Stiglitz (1990) explains that the price of an asset is efficient when it represents pure fundamental value. Bubbles are then likely appearing when fundamentals become difficult to assess (White 1990). It is however not possible to eliminate suspicions about a bubble in a market by just looking at economic variables. Previous price increases, are often giving birth to expectations about prices increasing at the same rate in the future (Case & Shiller, 2003). Changes of the economic conditions may therefore initiate a boom that is sustained by an underlying bubble (White, 1990).
Lind (2009), who finds Stiglitz’ definition of a price bubble insufficient, developed a list of bubble indicators based on previous research of housing bubbles, to help predict housing
3
bubbles. These indicators measures or put focus on factors in the market that has contributed to previous house bubbles. Observing such factors in relation to price should help reveal an unstable development of a housing market. The purpose of bubble indicators is to be able to use them as warning signals with some kind of ability to predict a house bubble. Absolute prediction power of bubble indicators has never been empirically proven (Lind, 2009; Sjöling, 2012), but they can still be used as complementary tools to evaluate the state of a housing market.
Despite Lind’s discontentment towards Stiglitz’ definition of a bubble much recent research on house bubbles has its origins in his definition (Lind, 2009). According to many researchers expectations have a key role in defining and explaining a bubble but it is not only expectations about future price increases that is mentioned in Stiglitz’ definition that can affect price. Quigley (2001) concludes that expectations about fundamentals affect property markets. Case and Shiller (2003); Shiller (2007), finds that understanding the motivation of the buyers and the expectations they have on future price is the most central when predicting a house bubble. The buyers’ and potential buyers’ (further on included under the term buyers) behavior can reveal some information about expectations but of course it is much harder to access and estimate that kind of information than market numbers, which is why studies often include and begin with a study of market numbers.
1.1.2 Housing Markets
Housing markets contribute a great deal to a country’s national economy and housing is usually the biggest part of a household’s wealth (Boverket, 2011). Housing markets are known as inefficient, which Case and Shiller attribute to high transaction costs making exploitation of the inefficiency restricted and expensive (Shiller, 2007). It is the characteristics of an inefficient market that makes the risk of a housing bubble possible. If prices were only driven by new information a bubble could not exist (Lind, 2009). The individual price pattern seen in different housing markets reflects the variability in the forces affecting price and include local and regional variables (Conefrey & Gerald, 2011). With the variety of variables, that is dependent on the housing market in question, a set of necessary factors causing a bubble to occur does not exists (Lind, 2009). “A bubble can never be explained by a single factor, but is the result of a number of factors.” (Lind, 2009, p. 78) Hence, different market forces have to be combined when studying housing markets in order to gain result. As stated housing market are influenced by local characteristics affecting price and therefore the spread of housing bubbles used to be limited and not affect market simultaneously. However recently this seem to have changed as a large number of EU states such as Ireland and Spain, as well as the United States (US) have been affected by house market crisis that have caused significant economic instability (Conefrey & Gerald, 2011).
1.1.3 Comparing housing markets
The Nordic countries’ housing markets have experienced a similar price pattern since the beginning of the 1980s, all the way to 2006/2007. They have also shared an increase in household debt level during the same period. The rapid increase of real housing prices started, in all four countries, in the middle of the 90’s when inflation was low and slowed when higher interest rates were enforced 2006/2007, as a result of stricter monetary policies. In 2008/2009 housing prices in all Nordic countries were falling as a consequence
4
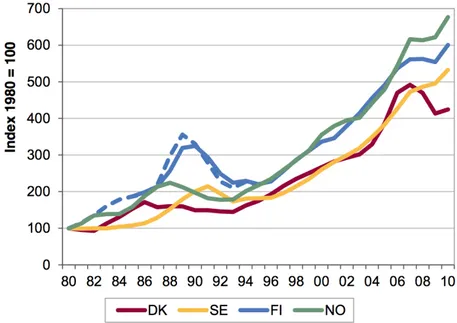
of the financial crisis (Boverket, 2011). After the financial crisis, prices developed differently in the Nordic countries. Between the fourth quarter of 2008 and the fourth quarter of 2012, price of detached houses in Norway increased by 32.5 percent and 11.6 percent in Sweden, while prices in Denmark decreased by 8.5 percent (SSB, 2013a).
Figure 1.2, shows the nominal price development of housing for the Nordic countries while figure 1.3, presents real increase in prices. Looking at the nominal price increases; Norway is seen to have had the highest increase in price but looking at real increase, Finland’s price increase is higher and Norway is rather seen to have had the same price development as Denmark until Denmark’s house prices kept falling while Norway’s house prices sharply rose again. Figure 1.4 illustrates the Nordic countries’ increase in real income, which can explain much of the increase in housing prices.
5
Figure 1.3 Real price of housing. Source: Boverket, (2011).
Figure 1.4 Real income. Source: Boverket, (2011).
In figure 1.5 Norway’s change in housing prices are compared to the changes with, again Denmark and Sweden, but also Spain, UK and the US changes in housing prices. Except for Norway and Sweden, all the other countries in the graph have experienced bursts of housing bubbles, which have caused prices to decrease to a lower level than the peak before the bubbles burst.
6
Figure 1.5 Nominal housing prices. Source: Englund, (2011).
1.3 Problem discussion
A relatively high number of housing markets in Europe, not far from Norway and with similar price pattern, have recently experienced housing bubbles. The explosive price boom, seen in Norway’s housing market has been ongoing for over 20 years. This has caused increase in the debt level among household which have become an increasing burden to the country’s economy and could in the future cause further damage in case of a change in Norway’s economic stability. In Oslo the price increase has been among the most extreme and the question is what have caused the price to increase these last ten years after the price had already been rising sharply for over a decade. Can the price increase be derived from changes in macroeconomic variables or does a bubble exists in Oslo’s housing market? From the definition of a bubble it can be concluded that in order to detect a bubble one needs to examine whether the fundamental factors can justify the price increase or if the price increase is built on irrational expectations. Observing changes in economic variables in the market is possible but it is hard to estimate the exact effect on price. As a complimentary tool to rate the state of a housing market, bubble indicators can be used. Finally, expectations despite being hard to evaluate, should be included when researching the possibility of bubble, as it is the main characteristic of a bubble.
This paper preforms a research of Oslo’s housing market and makes a prediction of weather a house bubble exists. By researching various housing markets and the causes of price booms the awareness of factors causing bubbles and the effect of market forces will increase and hopefully in the future bubbles can be more easily avoided
1.3.1 Purpose
The purpose of this thesis is to describe the rapid price increase seen in Oslo’s housing market between 2002 and 2012 by discussing and analyzing a number of underlying factors’
7
impact on price. This will create a greater understanding of what likely has caused the price increase, which will be used to evaluate whether the factors caused a justified price increase, or a price bubble.
To fulfill the purpose three research questions are stated with the purpose of guiding the study of Oslo’s housing market onwards and help make a prediction of whether a housing bubble is likely to exist.
1.3.2 Research questions
• What has likely been the impact of the changes in common market variables that are known to affect price of housing, on Oslo’s housing price, between 2002 and 2012? • Further, what kind of indication does a chosen set of house bubble indicators give
about the state of Oslo’s housing market?
• Finally, would an examination of the behavior and beliefs of Oslo’s housing buyers indicate any irrational market expectations, that could have affected price and contributed to a bubble formation?
1.4
Delimitations
First of all it should be stated that the research of Oslo’s housing market is limited and the prediction is based exclusively on changes in economic variable numbers, a set of bubble indicators and a study of housing buyers’ expectations of the housing market in Oslo.
This paper has chosen to focus on the price increase seen in Oslo over the last decade (between 2002 and 2012 or 2013 when material is available). For that reason a standardized timeframe for data collection have been sat to between five and ten years back in time. However, to be kept in mind, Norway’s, thus Oslo’s housing prices have been increasing for much longer than ten years, as seen in the introduction. Oslo has been targeted for the research, simply because price increase in housing usually are among the highest in capital cities and Oslo was proved to be no exception. Further, the study had to be limited to one single housing market as it would be difficult to study the whole country as one housing market when it in reality consists of many separated markets with different attributes and market forces. Finally, the last research question indicates that the irrational expectations of housing buyers, which include potential buyers, have a great impact on price and are therefore put in focus for this research. This does not mean that other actors in the market, like sellers, estate agents and different authorities cannot impact price as well but these actors are for the sake of the research extent excluded in this study. Further the buyers will be referred to as a group of people that act and think correspondingly, which is clearly a generalization. Finally the prediction of the state of Oslo’s housing market will be made on the date of writing and no concern for how the market will develop in the future is included.
8
1.5
Method approach
The continued study of Oslo’s housing market has its origins in the three research questions. These questions have created three areas of research on which the theory of this study and the rest of the thesis are based, namely economic variables affecting the housing market, housing bubble indicators and behavioral finance - the theory on which market expectations are formed. Despite the division, the three areas of research are not strictly separated; rather they overlap. It is the aggregated result of the research question, when studied together that brings value to the study and fulfillment of the purpose.
Examples of economic variables affecting housing price is found in most research about housing markets and bubbles: “The linkage between the real estate market and the general conditions of the economy has been studied extensively.” (Quigley, 2001, p. 129) In those kinds of researches the study will have its start.
The notion of including a section of bubble indicators has its roots in Lind (2009)’s study of price bubbles in housing markets where he develops a (uncompleted) list of indicators. Most of the chosen indicators used in this study are taken from his work, supplemented with information from other sources as well, as the use of indicators when researching house bubbles are not a new method.
Noticed from Robert J. Shiller’s many researches was how central psychological expectation is in explaining price increases and therefore he has influenced much of the research in that area. He argue that the field of behavioral finance have received little progress because it is against the view of many economists who prefer to rely on number, that price is affected by psychological factors and peoples’ behavior (Shiller 2007). This point of view has led to the introduction of behavioral finance into the study. The measurement of market variables resembles a great part of this research but a lot of emphasis is also put on the housing buyers’ behavior, hence behavioral finance. The theory explains how expectations can be derived from behavior observed in markets and common thoughts among investors. Expectations represent the unknown compared to economic variables that are more observable. It is also the expectations that separate a bubble from a justified price increase caused by the macroeconomic, fundamental factors and therefore the focus on behavioral finance is validated.
Much of the research process has lead itself forward as the research of one source leads to a number of other sources and so forth. However, Case and Shiller (2003)’s work has highly influenced this study as their research was based on market variables and an analysis of buyers’ expectations, similar to this study.
1.6
Disposition
Chapter 2: The following chapter will discuss the theory, which has influenced most of the
continued study. The theory chapter contains three main sections each based on one of the research questions.
Chapter 3: In the third chapter the chosen method used to fulfill the purpose is given. The
research questions are researched separately and an adapted method used to answer each one of the questions is presented in this chapter as well as the used method techniques.
9
Chapter 4: The fourth chapter contains the main findings and interpretation where the
result is connected to the theory given in chapter two. The chapter holds the information given from the study of the three research questions, which are presented respectively in three parts.
Chapter 5: The fifth and final chapter present answers to the three research questions
based on interpretation of the result given in previous chapter. The conclusion, the main content of this chapter that fulfills the purpose, is derived from the question’s answers. The chapter ends with critical reflections on the preformed study and suggestions for further research.
10
2 Frame of references
This chapter presents the theory on which the empirical study is based. The result gained in the research has been analyzed in the light of the presented theory. The theory chapter has been divided into three main sections, based on each of the research questions.
2.1 Economic variables affecting the housing market
Each one of the economic variables of this study and their effect will be presented below. Initially a clarification of fundamental value will be given.
2.1.1 The fundamental value
The interest for fundamental value evoke because of its central role in Stiglitz’ definition of a bubble. Stiglitz (1990) is aware that fundamental value of an asset is difficult to assess since it is derived from an estimation of end value and one can question how economists test whether the terminal price can be justified by fundamentals, without having data extended into the future. The uncertainty of an assets fundamental value is what usually influences the debates among researchers who argue the possibility of a bubble (Lind, 2009). These debates are usually influenced by disagreements of whether a bubble exists. The crash of the stock market in 1929, which most economists agree was a bubble is an example of this; even after the crash there were claims about the prices being a product of fundamentals and the expectations of price being justified (White, 1990). Hence, the fundamental value of an asset can be hard to derive and naturally changes over time, as future events are always uncertain. Yet, to the extent possible assets should represent pure fundamental values otherwise the efficiency of resource allocation in the market is weakened (Stiglitz, 1990).
The change in an assets value can be derived from changes in in economic conditions, which will be studied in this part of the theory. Yet, with an ever-changing market it is hard to measure the exact effect of these variables on the price, as well as to understand the effect of new macroeconomic variables (White, 1990). Furthermore, Oslo certainly has a unique set of market conditions that effects demand and supply of housing, hence the price, which are not all mentioned here. Following this clarification of fundamental value is a presentation of common economic variables used in this research. The presented macroeconomic variables belong to the most common universal factors used to explain price changes, found in the used research material.
2.1.2 Construction costs
For a long time the general view among economists was that housing prices were driven primarily by construction costs. This was also true in the old days as hosing basically was the value of constructing the house, just like any other good. At that time nobody bought a house as an asset believed to increase in value (Shiller, 2007). Construction cost naturally affect the supply of housing but previous research has shown that construction cost does not necessarily correlate with housing prices as much as other macroeconomic variables
11
(Englund, 2011). However, changes in construction costs are still used to explain part of price increases in housing but it is argued that the increased productivity implied by a housing market that is experiencing a boom in prices should be able to keep costs down (Sjöling, 2012). The biggest part of construction cost usually consists of the labor cost, which therefore is an important factor (Shiller, 2007). Laws and regulations of the housing market affect constructors, and as well as buyers they are dependent on loans from creditors (Quigley, 2001). A complication with the house-building sector is that when the market is working at its full capacity the cost of increasing housing is much higher than the normal average cost of building one piece of housing. If demand is sustained the constructors in the market should have time to adapt depending on flexibility of the construction sector. Yet, it can affect price of housing in the short run (Englund, 2011).
2.1.3 Income and interest rate
Increased level of income is one of the most common explanations for price swings seen in housing markets (Case & Shiller, 2003). Exceptions of price booms without much increase in income exist but most of the previous studies have shown that prices in housing is highly responsive to changes in income and income is generally what controls demand for housing. The elasticity between income and price, based on previous research made, are usually around one (or above), which means that an increase in income of one percent should lead to an increase in price of at least one percent as well. The demand for housing is however not as elastic in response to price changes as it is to changes in income, which can increase the effect of income change on price even further (Englund, 2011). The reason can be that prices are expected to move up-ward and are therefore slow to change direction (Case & Shiller, 2003), therefore buyers do not respond to the price increase by buying less housing. Further, buyers can somehow be attracted to high prices as they see housing as a saving plan and an investment that could lead to a next, even bigger house (Englund, 2011).
The demand for housing might not be very responsive to price of housing but instead to the cost of housing. Interest rate is the biggest part of the user cost of housing, the cost of owning a house (Quigley 2003). Except for interest rate, user cost depends on income tax rates, capital gains and inflation. Interest rate together with income is what makes housing more affordable. If interest rates are falling while the price of housing is rising the interest paid might remain the same (Case & Shiller, 2003), hence the cost of housing has not changed and therefore falling interest rates can cause housing prices to increase. The purpose of lowering interest rates is to increase the incentive to invest (Shiller, 2007). Housing investments have seem to be very responsive to lowered interest rates, as housing not only increases wealth but also brings quality of life benefits, (Case & Shiller, 2003), opposed to other investments. Mayer (Case & Shiller, 2003) discusses how interest rates affect price more today, which also implies that housing markets are more vulnerable to increases in interest. He further points out that lowered interest rates even caused housing prices in the US to increase during the beginning of the 2000-century when the county was in recession (Case & Shiller, 2003).
2.1.4 Employment and population growth
12
(Englund, 2011). Economic theory also suggests population growth to be a contributing factor of increasing prices. However, when tested on real cases, population density showed little correlation with price. Yet, this could be a more dependent factor in areas where land and supply of housing is more inelastic (Case & Shiller, 2003). Areas with high population density usually solve the problem by building vertically and investing in public transportation systems that can synchronize suburbs with city areas. Immigration is part of the population growth, hence affects the demand for housing (Shiller, 2007). Immigrants are often attracted to markets that are growing economically due to those markets demand for labor (Conefrey & Gerald, 2011).
Employment growth has shown higher correlation with price than population growth but not nearly as much as interest rate and income. Price changes often occur even when employment rate is steady. Rising house prices can have negative effect on employment as the region become less attractive for workers whose cost will increase (Case & Shiller, 2003).
2.1.5 Supply of housing
Many results from previous studies show that the supply of housing is highly relevant in explaining the price of housing. According to basic economic theory supply should adapt to increase in demand. Thus, when price of housing raises, due to increase in demand the suppliers, in this case the constructors should respond by increasing supply. This is usually the case (Case & Shiller 2003), but the elasticity of supply has been seen to differ between housing markets. In Sweden for example, prices in housing have been increasing. The supply has however, been observed as very slow in responding to the increased demand with the consequence of prices rising further due to the shortages in supply. In the housing market of Spain, US and Ireland on the other hand, the increased price lead to booms in the building sector, which instead caused housing prices to fall (Englund, 2011). The elasticity of housing supply (and land supply) is a key factor, affecting price of housing because if supply does not manage to keep up with the increased demand that comes from changes in the variables discussed above, then a very steep price increase can be expected (Englund, 2011).
Mayer (Case & Shiller, 2003) explains that if supply were perfectly elastic, price of housing would be driven only by the sum of construction cost and the opportunity cost of land. In the short run supply of housing is always very inelastic due to the lead-time involved in developing new housing. Other than that supply elasticity is dependent on the building sector’s flexibility and costs. In a housing market where supply is inelastic an increase in demand will have much bigger effect on price. The number of new housing explains the response in supply (Englund, 2011), but also the number of housing starts can be a proxy for supply restrictions (Case & Shiller, 2003).
2.1.6 The effects of macroeconomic variables
When looking at all the different macroeconomic variables it is easy to see that one should be careful to not overemphasize bubble stories by only looking at the price movements of housing. There are many macroeconomic factors that can effect price changes (Shiller, 2007). Studying the underlying factors behind the variables enhances the notion of how
13
dynamic the housing market is. Income does not only affect price of housing on the demand side but also on supply side by being a big part of construction cost. Interest rate similarly does not only affect the buyers’ affordability of buying a house but also the constructors affordability in constructing one. The central banks have a great responsibility in this area as monetary policies have a vital role. They control the interest rate levels, which affect the lending rate and discount rate (Shiller, 2007). Sudden tightening of monetary policies has also been seen to cause bursts of existing bubbles (Shiller, 2000).
2.2 Bubble Indicators
Unlike the macroeconomic variables that presents explanations to price changes, the indicators focus on signs that would indicate price increase caused by other, irrational factors, which have affected the behavior of actors in the market (Lind, 2009).
There would be a huge success if indicators with absolute certainty could predict a house bubble. So far we have to use them as warning signals of whether a housing market with a rapid price increase is in risk of facing a bubble. As it has been concluded that bubbles arise from a number of interacting factors (Lind, 2009), a set of indicators instead of just one, which would have little or zero ability predicting a bubble will be used. The presented list of indicators below is mostly based on indicators found in the research of Lind (2009). Lind gathered material by reviewing literature about house bubbles with the goal to create a broad set of indicators. Some indicators from other sources been added and some of Lind’s indicators have been excluded because they are either covered in the section about economic variables or in the next section on behavioral finance. The remaining indicators that are brought forward below are the price-to-rent- and price-to-income ratio, followed by indicators of unstable lending, which include interest payments in relation to income. Finally indicators regarding speculation and irrational buyers are covered and those final indicators have a natural connection to behavioral finance that will be studied in the following and final part of the theory.
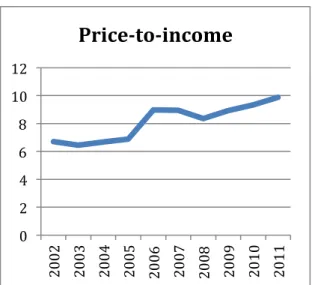
2.2.1 Price-to-income and price-to-rent ratio
The relationship between home prices and income should be rather stable over time. Volatility can assume a more unstable housing market. As price is very responsive to changes in income the ratio most often correlate or will soon fall back to a correlated level (Case & Shiller, 2003). The price-to-rent ratio should under normal conditions also be stable over time (Shiller, 2007). A deviation from a historical level where price have increased more than rent, implies expected future gains of the property whose price have increased. The question that follows is whether the buyer is right in anticipating this future increase in price. An increased level could however be explained by a decrease in the cost of buying or a house, referred to as a decrease in interest rate (Englund, 2011).
2.2.2 Indications of unstable lending
The credit market plays an important role in the housing market and risky financing as well as easy credit can be contributing factors in creating a bubble (Lind, 2009). In previous studies of housing bubbles the credit market’s lending policies have often been accused as a
14
contributing factor of bubble formations. According to many economists the ability to borrow money, already in the 1929’s stock market bubble, encouraged irrational speculation (White, 1990). The real estate bubble in Sweden in the 1990’s was also associated with banks’ generous lending policies (Lind, 2009). However, White (1990) concludes that it was the stock market’s demand for funding in 1929 that affected changes in other financial markets and not necessarily the opposite.
A hazard in the banking sector occurs when the lending institutions undertakes excessively risky investment for self-interest reasons. It is therefore important that there is free competition and transparency in the credit market as well as regulations from state authorities (Quigley, 2001). Alarming is also when banks start judging buyers’ credit worthiness more liberally. The risk of a bubble is said to be larger when households choose riskier investments. An extreme case of this is the subprime lending, used in the US, where interest payments and amortization was reduced the first year. Less extreme and more common is to choose interest that follows the current market rent at a time when interest is low, which is also riskier. A way of measuring banks’ lending policies is through a look at loan-to-value ratio, the level of loaned capital in relation to the value of the house, which is applied to house buyers when taking a loan. This ratio should not increase during a boom when housing prices are increasing, rather it should be lowered in a time of increasing prices (Lind 2009).
2.2.2.1 Interest payments in relation to income
The risk of a house purchase on the buyer’s economy is represented in the effect it has on direct expenditure. Interest costs are a large part of the household’s expenditure and a possible bubble indicator is the relation between the nominal interest payments of the average house owner and their income. If this is significantly higher than in earlier periods, the behavior might be unstable and indicate a bubble Lind (2009).
2.2.3 Indicators of speculation and irrational buyers
In the long run the markets should be determined by rational factors, by factors that knowledgeable actors take into account. If during a certain period with increasing prices it is observed that irrational factors are affecting the behavior of the actors then there is a higher probability of an unstable outcome on the market. Apprehensible indicators of this could be when buyers are entering ownership at an earlier age or choosing riskier financing alternatives. These examples of irrational behavior, which affects the price of housing, would then be seen as bubble indicators (Lind 2009). Irrationality and non-efficient markets are discussed in the third section of the theory, as the buyer behavior on the market will be studied and researched separately and in greater detail but below are a short review of what kind of behavior that could indicate a bubble in the housing market.
Changes in the level of homeowners compared to the level of tenants in the market can reveal whether the demand for owned housing has gone up in relation to renting. Shiller (2007), observed how the level of homeownership increased in the US and stated that this was encouraged by society since there was a general view that owning a house was much better than renting one. At that time however, people were also encouraged into risky investment in order to become a house owner. The level of excitement that influences the house market can also reveal some information about the state of market. Word-of-month
15
and the general amount of talk could be seen as indicator in itself for the excitement level in a housing market (Case & Shiller, 2003).
Speculation is known to drive up prices extremely fast and affects most financial markets. The housing market has been unaffected by this type of investor behavior, due to the high transaction cost when buying and selling a house (Shiller, 2007), at least until a few decades ago. The tendency to view housing as an investment has become a defining characteristic of a housing bubble. An indicator of this type of speculating behavior is when an increased number of people are selling the house they just bought rather quickly (Lind, 2009). People are then buying for the future price increase and not for the pleasure of owning a home. It leads to instability in the housing market, as the prices will drop sharply when the investment motive fades. Housing is often seen as a risk-free investment and in combination with speculation there is a risk of irrational people entering the market, increasing the probability of fatal consequences on the housing market. Indicators that signal urgency among house buyers who are afraid to wait can also be interpreted into irrational belief in the housing market. This belief could e.g. be that prices will increase so much that buyers think they will miss out on an opportunity to buy later and therefore cannot wait any longer, which is also connected to speculation behavior (Case & Shiller, 2003).
Illogical buying motives, irrational future expectations and skewed perception towards risk are major signals of a bubble but these are less tangible, which is the reason for using indicators that translates these into actions observed in the market. Still, these can of course lead to different actions in different housing markets and this is a limitation of using indicators, which is the reason why behavioral finance is studied next.
2.3 Behavioral finance – Human behavior’s effect on housing
markets
In general, economists like theories that consist of models, rules and a number of assumptions. Therefore it has taken a time for behavioral finance to receive recognition; “The field of behavioral finance is still in its infancy.” (Shleifer, 2000, p. 27) Shiller (2007) states that even though interest rates have an upward effect on home prices monetary policies are not as central as psychological expectations in explaining price increases, which is against the view of many economists. Supply is meant to stabilize house prices but the effect of increasing development of housing can easily diminish if the expectations remain high.
Behavioral finance is the study of human behavior in competitive markets. Shleifer (2000) describe this behavior as human fallibility but as unreliability and faultiness is seen as human characteristics it is natural consequence that human behavior will affect any market. To understand the true nature of the forces that effect price changes on a given market we need to turn to psychology (Shiller, 2000). It will help understand what influence people’s expectations, motivation and behavior. The study on the formation of buyers believes could go deep into endless psychological theories in order to fully understand the cause of an action. This study however, will settle with the most fundamental ideas of behavioral finance.
16
2.3.1 Market inefficiency and word-of-mouth
A market is called efficient when the price of an asset in the market is kept close to its fundamental value. One of the conditions for the efficient markets theorem to hold is the existence of substitutes in the market. Behavioral finance questions this by pointing at the lack of substitutes making arbitrage risky and limited (Shleifer, 2000). Further, the theorem of market efficiency relies on rational investors that value assets and securities for its fundamental value. This rationality also involves immediate reaction to information, such as increasing prices when news are good and decreasing prices when news are bad. The efficient market assumption that people in general are fully rational is hard to sustain in any market and not just the housing market that was clarified earlier as an inefficient market. There are many investors that react on irrelevant information in forming their demand. They buy and sell based on noise rather than information. The market efficiency theorem has however accounted for some irrational behavior by stating that, irrational actions among investor clearly exist but since the behavior is assumed to be random the effect on the market is always cancelled out (Shleifer, 2000).
It is true that random actions have little effect on the market since significant market events generally occur if there is similar thinking among large group of people. Because of humans’ information processing ability; the effective communication of important facts from one person to another, similar thinking among people is not unusual. In a modern society there is likely to be rapidly spreading conversations about a buying opportunity for a hot asset or about threats of personal wealth, etc. The controversial media, the print media, television and radio have also profound capabilities for spreading ideas (Shiller, 2000). A notion that helps develop a bubble in particular is stories that justify the price increase seen in the market. Shiller (2007; 2000) refers to them as ‘new era stories’. These word-of mouth stories and spreading of ideas explains why the deviation from rationality studied in behavioral finance, has turned out to be far from random but instead highly pervasive and systematic, which is against the assumption of market efficiency theorem (Shleifer, 2000). This kind of systematic deviation from rationality is surely a key in explaining a bubble and will therefore be discussed further.
2.3.2 Irrational price expectations
A fundamental observation about human society is that people communicate regularly with one another in similar ways. At any place and in any time there is a ‘Zeitgeist’, a spirit of the times. Understanding this similarity of thinking at a given time and place can help create an understanding for the fluctuations that attribute price pattern caused by human behavior (Shiller, 2000).
People deviate from the standard decision-making model in a number of fundamental areas. One area is illogical expectation formation, the prediction of uncertain outcomes. It has been studied that people often predict future uncertain events by looking at short history of data (Shleifer, 2000). People tend to make judgments in uncertain situation by looking for patterns and then assume that future patterns will resemble past ones without questioning the reasons for the pattern or the probability of the pattern repeating itself (Shiller, 2000). This way of identifying patterns is common among humans who like to simplify complicated information. A consequence of such behavior is the bad decisions made on the simplified information. Potential buyers may generalize short past histories of rapid price increase far into the future and therefore overprice assets today. People see
17
patterns in truly random sequences and overreact to positive news. Shleifer (2000) states; “Prices are high because investors expect them to go even higher, not because they are ready for prices to go down.” (p. 179) With this expectation the willingness to bear risk increases, which drives prices further up. In reality a history of high growth is unlikely to repeat itself (Shleifer, 2000). High expectations on price also have a tendency to become self-fulfilling (Englund, 2011).
People have a propensity to base their belief of what indicates the appropriate level of the market prices on numbers already given in the market. Hence, the price tomorrow will be based on the price of today meaning that whether price is over or underpriced in people’s minds depends on prices already expressed. This also explains why individual stock prices move together and are more influenced by other stocks with headquarters in the same location rather than in the same industry (Shiller, 2000).
2.3.3. Over-confidence
There seem to be a general human tendency toward overconfidence in in one’s own beliefs. People are ready to act on stories or reasons that rationally they should have little confidence in. People think they possess more information than they do. They like to express opinions on matters they know little about and they often act on these opinions. Further on people tend to overestimate the probability that they are right and investors have been shown to express overly strong opinions and rush to summery judgments. Another theory is that people make probability judgments by looking for similarities to other known observations, and they forget that there is much other possible observation with which they could compare. A consequence of overconfidence is the tendency to believe that one would have known actual events were coming before they happened. This is known as hindsight bias and encourages a view of the world as more predictable than it really is (Shiller, 2000).
A phenomenon in peoples mind, described as conservatism states that individuals are slow to change their beliefs in face of new evidence. If they react the reaction is not as strong as the response should have been (Shleifer, 2000). It takes some time before people begin to conclude that in the light of new evidence; the trend has changed and will continue in another direction (Shiller, 2000).
2.3.4 Herd behavior
The judgment of people’s opinion and behavior is not fully independent, which have been proven in many psychological experiments. If the majority of people have a certain belief other people tend to follow that belief based on the simple conclusion in peoples’ minds; that not all other people could be wrong and thus, their own senses are somehow not reliable. Another example of such heard behavior is when people only listen to experts without questioning (Shiller, 2000).
2.3.5 Consequences of the human behavior on housing markets
As stated, similar irrational thinking is not an unusual phenomenon rather it is observed as common that a large number of people in the same environment react alike to identical
18
information. Similar thinking can have effect on booms and busts in markets (Shiller, 2000). Hence, when similar irrational thinking affects a great share of the people in the same market the risk of a bubble formation increases.
In accordance with the study of how people anticipate further growth on assets based on past growth, homebuyers in cities where prices have increased rapidly in the past anticipate greater future price appreciation than in cities with no or stable growth. The research by Case and Shiller (2003) proves this statement. Homeowners in so-called bubble states, were prices had already increased significantly, were anticipating further large price increases in housing and larger increases than states with lower price increases. In the same way homebuyers have been known to irrationally expect the current low interest to last in the future. During a bubble period in the housing market people believe in prices continuing to increase as in recent years or that prices will stabilize on what is a very high level from a historical perspective. In this state of mind households underestimate the risk of house investment as close to risk free (Lind 2009).
During a period of rising prices on a housing market people might become impatient, thinking that cost will keep increasing and the desire to follow the rest in the market increases. Another example of herd behavior that is typical in housing markets occurs in situation when people perceive that ‘everybody’ in the surrounding is realizing their ‘dream’ of buying a house, with the given effect that people feel more motivated to do the same (Lind 2009). This kind of believes is naturally enhanced by word-of-mouth.
Prices in the housing market have been noted as sticky downwards. This is an example of conservatism in buyers’ and sellers’ minds as people are slow to change beliefs when given new information. The price of housing often stick to a certain price even if the market demand has gone down because the sellers have a reservation price, which they try do not fall under. This is connected to the belief among people in housing markets that price of housing never declines (Case & Shiller, 2003).
Understanding buyer sentiment and their deviation from rationality may generate more accurate predictions about price and returns, which can help to make markets more efficient. The progress of determining the asset prices is receiving further knowledge through behavioral finance as a valuable mean in predicting price. Yet, there is still lack of knowledge in the area of the key determinates of price such as expectations about fundamentals, discount rates, and simple movements of demand. The behavioral finance has yet many years to grow. In the future maybe attitude towards risk, forecasting and movements of uninformed demand can be used in a higher degree to explain the value of an asset (Shleifer, 2000), which would improve the possibility of predicting bubbles.
19
3 Method
This chapter presents the method used to create an understanding for the cause behind the price increase seen in Oslo’s housing market. The purpose of the method is to create a path that in the end leads to the conclusion of whether the price increase on Oslo’s housing market is believed justified or a price bubble is to be suspected. The method will begin with a look at the purpose of the research. Then the research philosophy and approach is discussed. This will be followed by a debate about the quantitative and qualitative data collection, which is continued with a description of the method used to solve each research question. The chapter ends with looking at how validity and reliability of this study is secured.
It is the purpose of this research that decides whether explorative, descriptive or explanatory research is to be used (Yin, 1994). This study initially wants to describe the price increase seen in the market. However the main purpose of this study is to explain the relationship between the price increase of housing with some observed changes in the market, which represents an explanatory research (Robson, 2002). Thus, this research will be mainly explanatory.
3.1 Research philosophy and approach
With three research questions guiding the study it was difficult to choose one appropriate research philosophy. The positivist ontology has its roots in natural science where an objective study based strictly on facts should be made, without including personal impressions (Saunders, Lewis & Thornhill, 2007). It was difficult, mainly because of the third research question that includes impressions and different interpretations of the housing buyers’ thoughts and behavior, to only touch upon facts in this research. The different areas of the research questions imply that neither positivist nor pure interpretivist ontology is the appropriate research philosophy for this study. In cases like that the applicable research philosophy to choose, which uses both ontologies is the pragmatist view (Saunders et al., 2007).
The study of Oslo’s housing market will take on mostly a deductive approach, as a main characteristic of the deductive approach is to explain relationships between different variables. However, the deductive approach calls for a structured research (Saunders et al., 2007), and the study’s outcome should either confirm the theory or create a modification to the theory (Robson, 2002). This is not in line with this study’s aims. Yet the alternative; the inductive approach is a study that wants to develop means that can help create a theory (Saunders et al., 2007), which is even further outside the frame of this research.
3.2 Quantitative and qualitative methods
A main question in the method choice was to determine whether a quantitative or a qualitative method should be used. Quantitative research method, which is influenced by the researcher being in control and beforehand determining possible results, is highly associated with the usage of statistical data (Holme & Solvang, 1997). Therefore the quantitative research approach fits the study that the author wants to perform, at least partly as market numbers are a big part of the study. However, the purpose of this thesis
20
also concerns a high degree of understanding, which symbolizes a qualitative research approach. Nonetheless, qualitative methods can be made systematically with quantitative influences. A qualitative approach aim is to create an understanding while a quantitative approach wants to explain (Holme & Solvang, 1997). This study tries to do both, which have led to a mixture of both qualitative and quantitative methods being used as an overall method approach. In the end qualitative data creates an overall picture of the research area and an increased understanding (Holme & Solvang, 1997), in line with the aim of this research. Thus, this study strives towards a qualitative result that is gained through the usage of both using qualitative and quantitative methods.
The numbers and graphs used, represent the quantitative approach, even if no statistic calculation has been performed. The statistical data is based on premade numbers and statistical data gathered mainly from Statistisk sentralbyrå (Statistics Norway, SSB). A graph representing the price increase of housing since 2002 initiates the empirical study to visualize what the following study wants to explain.
The qualitative information in this thesis is almost exclusively obtained through interviews with real estate agents.
Since the solution to the problem of this thesis relies on the three research questions, which require adapted research, a method for each question will be given respectively. Each method has been used as a tool for gathering the desired information in order to solve the problem and contribute to some new knowledge, in accordance with the function of a chosen method (Holme & Solvang, 1997).
3.3 Question 1 – Market variables
In order to judge whether the price increase in housing in the last decade can be attributed to changes in the market variables, different variables are presented in graphs, representing their annual changes between the years of 2002 and 2012. Unfortunately some variables’ data for 2012 were not compiled yet and consequently the final data is from 2011 instead. Data representing the following variables have been collected:
• Changes in construction costs • Income development
• Interest rate levels on property loans • Unemployment and employment numbers • Population growth, and
• Housing supply development.
The interest rate, income and construction cost increase have not been deflated as the price increase of housing was given in nominal terms and because the inflation has been rather low in Norway. The average inflation rate in Norway, between 2000 and 2011 was around two percent (SSB, 2013b). Interest rate represents part of the owner cost of housing, which also includes tax as stated in the theory. However, in Oslo there is no property tax to take into consideration (SSB, 2013c), interest rate will therefore in this study represent the full cost of housing. Employment statistics was only available from 2006 and the unemployment figure will be complemented with a few other countries’ unemployment rate for reference and to enhance the understanding of Oslo’s level of unemployment.
21
Housing supply is given in number of completed dwellings and number of started dwellings, both in relation to population, as the amount of increasing supply otherwise would be less interpretable. Interpretation of the variables will be performed continuously as the graphs are presented but an overall interpretation of the aggregated effect of the changes in the market with respect to the given theory comes after the presentation of the variables.
3.4 Question 2 - Indicators
The indicators’ that were tested on Oslo’s housing market are mostly presented over time, for comparison reasons. The results are partly presented in graphs and partly in tables with exception of the indicators regarding the credit market that are briefly discussed, while that information is not just given in just simple figures. The indicators listed below are the ones that have been tested on Oslo’s housing market:
• Price vs. income and rent • Price-to-income ratio • Price-to-rent ratio
• Number of homeowners vs. tenants • Age of entering home ownership • Interest payments in relation to income • The credit market, loan-to-value ratio
Data is gathered from SSB, but supplemented with information about the banks’ lending policies from Finastilsynet’s webpage. Since housing markets are very heterogeneous it will not give much result to compare the indicators to standardized indicators from other housing markets. To gain result the indicator have in the same way as the economic variables been compared over time to see if the market has made any remarkable changes towards an unstable housing market that would indicate a bubble. The timeframe is however, more flexible due to limitation in the statistical source’s data, regarding some of the chosen indicators. The indicators will similarly to the variables be interpreted systematically as the indicators are given.
Some of the indicators mentioned in the frame of reference not listed above, involving excitement, word-of-mouth, buyer believes and motivations, which are hard to gain information about in statistical numbers, will be researched together with the rest of the study of the buyers’ behavior in Oslo’s housing market.
3.5 Question 3 – The housing buyers’ behavior
The third question wants to gain access to the market expectation of Oslo’s housing buyers, since irrational market expectations are said to be the cause of bubbles. “Survey evidence on people’s expectations about future house price appreciation can therefore be a useful tool for diagnosing a bubble.” (Norges bank, 2013, p. 4). It is the belief of this research that information about the buyers’ market expectations can provide valuable information in itself, as well as to support and reflect on the information gained from the two previous research questions. With limited ability to gain access to first-hand
22
information about the buyers’ expectations, real estate agents were targeted as the source of information about the buyers’ behavior on Oslo’s housing market. Thus, information about the housing buyers’ possible motivation, beliefs and expectations has been collected through telephone interviews, made with a number of real estate agents in Oslo.
3.5.1 The survey
The used format in the telephone interviews was a standardized questionnaire, without any given answers to choose from. The first thought was to let the agents think of trends and behavior among the buyers without being directed into already given answers by using completely open-end questions. This kind of qualitative interviews are very flexible but the flexibility can also be a problem (Holme & Solvang, 1997). It was concluded that open questions would lead to too much varying answers with the consequence of little usable or interpretable information obtained. Therefore more standardized questions were needed to gain wanted information but it was still important that the real estate agents had the possibility to express their individual view and make comments. The interpretation of the answers is based on the theory of behavioral finance and the part of the bubble indication theory that involves irrational behavior among house buyers, which have also helped form the questions. The survey in itself was influenced by the survey Case and Shiller (2003), preformed in their study of the US house market.
3.5.1.1 Survey questions
The questionnaire, which can be found in appendix 1, consists of twelve questions. Possible attendant questions, marked with a hyphen were asked if the answer given was not sufficient or if the agent misinterpreted the main question.
In order to separate the agent’s own beliefs about Oslo’s housing market, from what the agent has interpreted as the buyer’s belief, questions about the agent’s opinions initiated the interviews to make the agent aware of her or his own views first (see question 2-4). Question 4, regarding the agent’s opinion of when housing prices would fall, was asked to also to see if the housing market prices, according to the agents, are perceived as predictable. Question 5, simply enquires the buyer’s beliefs and expectations regarding price and future price, while question 6 and 7 concerns demand changes. Especially question 7 that asks whether it is more common today with housing being sold above asking price, wants to tests whether the demand can be symbolized as irrational. Question 8 represents the buyers’ view of housing as an investment as well as question 9 that asks whether the average owning time of housing has decreased since housing sold rather quickly after the purchase would indicate speculation among buyers. Question 10 concerns the buyers’ appreciated risk associated with housing purchase and question 11 requests whether there are buyers who feel a sense of urgency to enter the market because of price expectations or any other expectations. Question 12, the final question wants to measure the general excitement that influences the housing market of Oslo. It brings up the word of mouth phenomena and inquires if there are any topic regarding the housing market that are the more frequently discussed.