TRAFFIC SAFETY PERCEPTION AND ITS POTENTIAL IMPACT ON
TRAVEL DEMAND CHOICES
Ali Pirdavani
Research Foundation Flanders (FWO) and Transportation Research Institute (IMOB) of Hasselt University
Wetenschapspark – Building 5, B-3590 Diepenbeek, Belgium Phone: +32(0)11 26 91 39 E-mail: ali.pirdavani@uhasselt.be
Tom Brijs, Tom Bellemans, Geert Wets; Transportation Research Institute (IMOB) of Hasselt University
ABSTRACT
In this paper we aim at investigating the potential influences of traffic safety concern and knowledge on travel demand choices and in particular travel mode choice. To this end, a survey is developed and a questionnaire is distributed to collect required information. The survey consists of several sections. First sociodemographic and socioeconomic characteristics of individuals are collected. Respondents are then asked to state their current mode choice decisions given the combination of activity type and trip length. In the next section respondents are informed of some safety figures demonstrating the general safety conditions attributed to each mode of transport. This is done with the intention of making them aware of how safe or unsafe a specific mode could be based on some empirical data. Furthermore they are asked to reveal their preferred mode they would choose by taking into account the knowledge they acquired and also from a pure hypothetical point of view without considering any additional condition. The results show that the general population does not tend to change their mode choice significantly. Moreover, their traffic safety perception was collected by asking them what they think about the probability of getting into an injury crash when taking each mode as well as the severity level of potential possible crash. The results confirmed that there is a collective conformity that public transportation is the safest mode while motorcycle followed by biking are the most dangerous modes of transport. Further analysis at the individual level is currently in progress so as to provide better mode choice models that include traffic safety along with other mode choice determinants.
1.
INTRODUCTION
This article is based on a research project that aims to incorporate road safety into travel demand forecasting. In view of this objective, three major sub-objectives are outlined to carry out the main objective, namely “integrating road safety with a demand model”, “integrating road safety in assignment model”, and “creating a feedback loop linking both models”. In this paper, the first sub-objective will be addressed where the impacts of traffic safety on mode choice are investigated. Reviewing the literature shows that incorporating traffic safety into demand models has not yet been explored decidedly. There are a few studies that investigated the traffic safety influence on mode choice that were particularly interested in school children travel preferences. In a study conducted by
Nevelsteen et al. (2012) travel mode choice of children aged between 6 and 12 years old was studied. For this age category, parents are the ones who predominantly determine children’s choice of travel. Their study shows that traffic infrastructure significantly affects both the real and the perceived traffic safety of parents, varying based on age and gender of children. In another study undertaken by Shokoohi et al. (2012) the average household income level and car ownership were found to be important determinants of mode choice. It was also concluded that traffic safety perception is partially dependent on socioeconomic status of household. The impact of traffic safety together with other indicators as latent variables was studied to analyze children’s travel mode choice (Kamargianni et al., 2015) by means of the new probit-kernel based Integrated Choice and Latent Variable model formulation developed by Bhat and Dubey (2014). The results indicate the need to improve walk and bus safety and subsequently publicize this to the public, particularly to high income level households. Moreover, it was concluded that safety consciousness positively influences the car mode choice, meaning that parents consider car as a safe travel mode for their children trips to and from school. To fulfill the objective of our study, literature review and a revealed/stated preference survey are considered as research methodologies in order to identify road safety preferences that affect and form individuals’ travel choices. By means of literature review, all relevant variables and dimensions are identified. The major objective of the survey is also to assess how individuals’ choices currently are or will differ in predefined hypothetical situations. This survey collects the data from individuals living in Flanders, Belgium. The target group for this research includes individuals who are 18 years of age and above, in possession of a valid driver’s license and are capable of using any transportation mode for their trips. The survey was carried out online by sending out emails to pre-identified respondents and posting the survey link on social media like Facebook.
2.
EXPERIMENTAL DESIGN
Traffic safety illustrates the degree of travelling throughout a road network safely. Several factors define the traffic safety level of a particular road network, including but not limited to travel distance, travel time, time of travel, speed levels, route choice, road design, behavior of road users and the probability of accidents in using certain routes and transport modes. Preference surveys have been employed in several road safety oriented studies where different safety related information was derived by means of this choice modeling technique (Jamson et al., 2008; Rizzi and Ortúzar, 2003). The designed survey should be able to address all possible impacts of traffic safety on different elements of travel choice and behavior. Hence, this survey has several goals to achieve, which are as follows:
Investigate sample population’s current travel behavior
Examine how would people make travel choices, considering traffic safety consciousness Examine how traffic safety concerns influences individuals mode choice
In view of the abovementioned goals, a questionnaire is formulated to collect individuals’ choices when they consider traffic safety while making mode choice decisions. This questionnaire has an introductory letter describing the goals of this research. It further consists of several sections and collects different information that is briefly described as follows:
Sociodemographic and socioeconomic characteristics of individuals including: o Gender
o Age category
o Possession of driver’s license o Driving experience
o Marital status
o Highest level of education o Current occupation
o Household status o Household income level
o Number of private cars in household Mode related attributes including:
o Respondent’s safety perception on the probability of getting injured while being on public transportation (PT)
o Respondent’s safety perception on the probability of getting injured while being a car driver (CD)
o Respondent’s safety perception on the probability of getting injured while being a car passenger (CP)
o Respondent’s safety perception on the probability of getting injured while being a cyclist (BIKE)
o Respondent’s safety perception on the probability of getting injured while being a pedestrian (WALK)
o Respondent’s safety perception on the severity level of crash while being on public transportation
o Respondent’s safety perception on the severity level of crash while being a car driver o Respondent’s safety perception on the severity level of crash while being a car
passenger
o Respondent’s safety perception on the severity level of crash while being a cyclist o Respondent’s safety perception on the severity level of crash while being a pedestrian
Revealed preference section:
In addition to the abovementioned questions, participants are asked to reveal their actual choices for transportation mode (i.e. mode choice from car driver, car passenger, public transportation, cycling and walking) in combination with trip purpose (i.e. work, bring/get children, shopping, leisure and social visit) and trip length (short, medium and long).Stated preference section:
After briefly introducing participants with some safety figures and informing them about potential consequences of particular mode choice decisions, the very same questions asked in the revealed preference section are asked again, but this time within the context of a stated preference survey. This implies that participants are not anymore confined with their restrictions in selecting any mode and are free to choose what they would choose if they had the opportunity of choosing any mode given the traffic safety awareness they acquired.3.
RESULTS
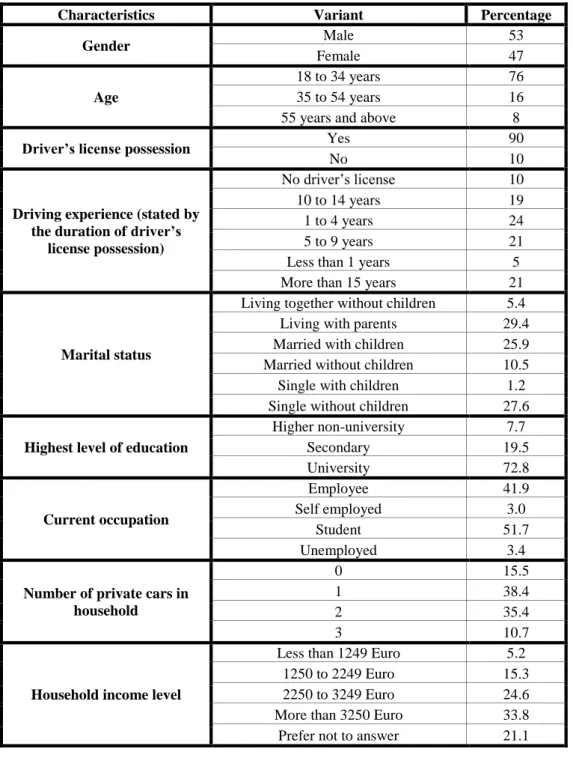
First we would like to describe the sociodemographic and socioeconomic characteristics of the respondents. Responses were distilled from 192 participants in the survey. Respondents characteristic distributions are shown in Table 1.
As outlined earlier, respondents were ask to choose their current mode choice given some predefined sets of choices with the combination of “activity type” and “trip length”. After being introduced to some safety figures (i.e. some historic crash data associated with each mode of transport), their mode choice behavior is again tested. In the second phase, they are asked to state their preferences given two conditions; first they were not anymore confined with any restriction in choosing any mode - like not choosing to be a car driver because you don’t possess a car – and moreover, take into account the
traffic safety knowledge they acquired together with other contributing factors they usually consider to make mode choices.
Table 1: Characteristics distribution of survey respondents
Characteristics Variant Percentage
Gender Male 53
Female 47
Age
18 to 34 years 76
35 to 54 years 16
55 years and above 8
Driver’s license possession Yes 90
No 10
Driving experience (stated by the duration of driver’s
license possession)
No driver’s license 10
10 to 14 years 19
1 to 4 years 24
5 to 9 years 21
Less than 1 years 5
More than 15 years 21
Marital status
Living together without children 5.4
Living with parents 29.4
Married with children 25.9
Married without children 10.5
Single with children 1.2
Single without children 27.6
Highest level of education
Higher non-university 7.7 Secondary 19.5 University 72.8 Current occupation Employee 41.9 Self employed 3.0 Student 51.7 Unemployed 3.4
Number of private cars in household
0 15.5
1 38.4
2 35.4
3 10.7
Household income level
Less than 1249 Euro 5.2
1250 to 2249 Euro 15.3
2250 to 3249 Euro 24.6
More than 3250 Euro 33.8
Prefer not to answer 21.1
In order to verify whether the current preferences (i.e. mode choices) are different from the hypothetical preferences for the whole population, the chi-square test is conducted. Due to the fact that several possible combinations of “trip length – trip purpose” (i.e. short, medium and long trips and trips to work, bring/get children, shopping, leisure and social visit) are studied, it is not possible to
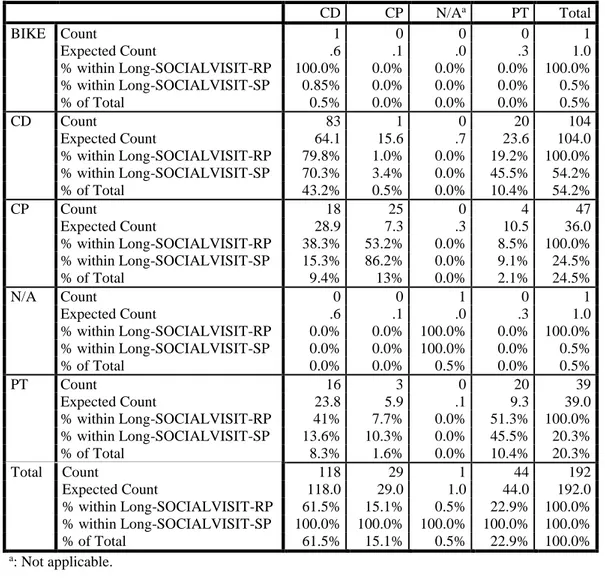
demonstrate all results here in this article. However, one sample combination is selected and the results of the cross tabulation and chi-square test are illustrated in Tables 2 and 3.
Table 2: Cross tabulation of stated preference vs. revealed preference mode choice for long trips (more than 30km of distance) and for social visits
CD CP N/Aa PT Total BIKE Count 1 0 0 0 1 Expected Count .6 .1 .0 .3 1.0 % within Long-SOCIALVISIT-RP 100.0% 0.0% 0.0% 0.0% 100.0% % within Long-SOCIALVISIT-SP 0.85% 0.0% 0.0% 0.0% 0.5% % of Total 0.5% 0.0% 0.0% 0.0% 0.5% CD Count 83 1 0 20 104 Expected Count 64.1 15.6 .7 23.6 104.0 % within Long-SOCIALVISIT-RP 79.8% 1.0% 0.0% 19.2% 100.0% % within Long-SOCIALVISIT-SP 70.3% 3.4% 0.0% 45.5% 54.2% % of Total 43.2% 0.5% 0.0% 10.4% 54.2% CP Count 18 25 0 4 47 Expected Count 28.9 7.3 .3 10.5 36.0 % within Long-SOCIALVISIT-RP 38.3% 53.2% 0.0% 8.5% 100.0% % within Long-SOCIALVISIT-SP 15.3% 86.2% 0.0% 9.1% 24.5% % of Total 9.4% 13% 0.0% 2.1% 24.5% N/A Count 0 0 1 0 1 Expected Count .6 .1 .0 .3 1.0 % within Long-SOCIALVISIT-RP 0.0% 0.0% 100.0% 0.0% 100.0% % within Long-SOCIALVISIT-SP 0.0% 0.0% 100.0% 0.0% 0.5% % of Total 0.0% 0.0% 0.5% 0.0% 0.5% PT Count 16 3 0 20 39 Expected Count 23.8 5.9 .1 9.3 39.0 % within Long-SOCIALVISIT-RP 41% 7.7% 0.0% 51.3% 100.0% % within Long-SOCIALVISIT-SP 13.6% 10.3% 0.0% 45.5% 20.3% % of Total 8.3% 1.6% 0.0% 10.4% 20.3% Total Count 118 29 1 44 192 Expected Count 118.0 29.0 1.0 44.0 192.0 % within Long-SOCIALVISIT-RP 61.5% 15.1% 0.5% 22.9% 100.0% % within Long-SOCIALVISIT-SP 100.0% 100.0% 100.0% 100.0% 100.0% % of Total 61.5% 15.1% 0.5% 22.9% 100.0% a: Not applicable.
Table 3: Chi-square test for social visit long trips (more than 30km of distance) and Value df Asymp. Sig. (2-sided) Exact Sig. (2-sided)
Pearson Chi-Square 366.830 12 .000 .000
Likelihood Ratio 86.587 12 .000 .000
Fisher's Exact Test 99.611 .000
N of Valid Cases 192
Statistically speaking, the results in Table 3 indicate that the choices in stated preference is associated with the mode choices of revealed preference (i.e. the null hypothesis is rejected). In other words, the differences between mode choice decisions are not statistically significant. Although some individuals change their mind and opt for a different mode choice when they are asked to declare their desired preference (please see Table 2), but the global picture does not change so considerably. Having said
that, further analysis has been initiated to develop more sophisticated joint multinomial regression models so as to capture the relationships between revealed and stated preference responses.
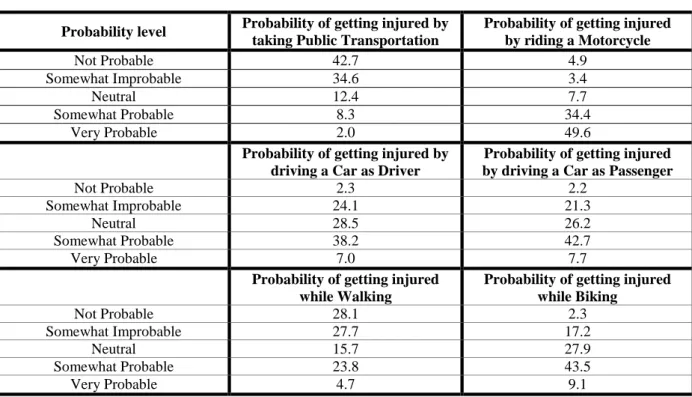
In addition to the mode choice section, the survey also investigates respondents’ perception on safety features of all transport modes. This is carried out by asking them to select their perceived probability level of getting injured while taking a mode and also the severity level of a possible injury crash. Probability levels are defined scalewise ranging from the least probable to the most probable level (i.e. “Not Probable”, “Somewhat Improbable”, “Neutral”, “Somewhat Probable” and “Very Probable”). Severity levels are also outlined as “No Injury”, “Slight Injury”, “Severe Injury” and “Fatal”. The results are shown in Tables 4 and 5 as distributions in percentage.
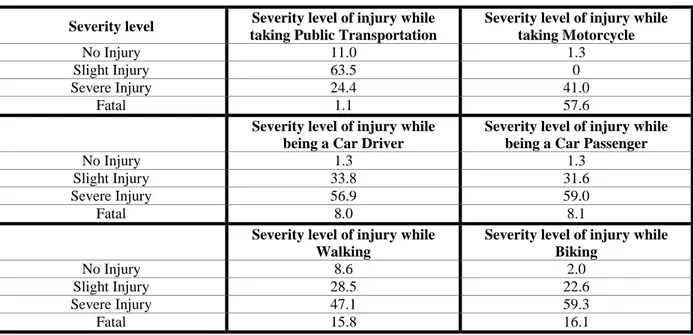
As can be seen in Table 4 respondents believe “Public Transportation” to be the safest mode while the most dangerous one is considered to be “Motorcycle” followed by “Biking”. They also don’t see any significant difference in the probability of facing an injury crash whether they are driving a car or sitting there as a passenger. Similar order is observed when looking at the results of the severity perception (please see Table 5). Respondents found “Motorcycle” to be the mode with the highest possible injury severity followed by “Biking”. Similar to the probability results, “Public Transportation” is believed to result in the least injury severity. Respondents expectedly stated that “walking” is rather a safe mode with low possibility of being involved in an injury crash, yet very serious if you would experience one.
Table 4: Respondents’ perception on probability level of getting injured while taking a transport mode Probability level Probability of getting injured by
taking Public Transportation
Probability of getting injured by riding a Motorcycle Not Probable 42.7 4.9 Somewhat Improbable 34.6 3.4 Neutral 12.4 7.7 Somewhat Probable 8.3 34.4 Very Probable 2.0 49.6
Probability of getting injured by driving a Car as Driver
Probability of getting injured by driving a Car as Passenger
Not Probable 2.3 2.2
Somewhat Improbable 24.1 21.3
Neutral 28.5 26.2
Somewhat Probable 38.2 42.7
Very Probable 7.0 7.7
Probability of getting injured while Walking
Probability of getting injured while Biking Not Probable 28.1 2.3 Somewhat Improbable 27.7 17.2 Neutral 15.7 27.9 Somewhat Probable 23.8 43.5 Very Probable 4.7 9.1
Table 5: Respondents’ perception on severity level of possible injury while taking a transport mode Severity level Severity level of injury while
taking Public Transportation
Severity level of injury while taking Motorcycle
No Injury 11.0 1.3
Slight Injury 63.5 0
Severe Injury 24.4 41.0
Fatal 1.1 57.6
Severity level of injury while being a Car Driver
Severity level of injury while being a Car Passenger
No Injury 1.3 1.3
Slight Injury 33.8 31.6
Severe Injury 56.9 59.0
Fatal 8.0 8.1
Severity level of injury while Walking
Severity level of injury while Biking No Injury 8.6 2.0 Slight Injury 28.5 22.6 Severe Injury 47.1 59.3 Fatal 15.8 16.1
4.
DISCUSSION
The primary results of this survey indicate that people do not significantly change their driving habits even if they are well-informed of the safety consequences of certain travel choices. This could be attributed to the fact that there are other determinants in opting for a certain travel mode - such as convenience, accessibility or travel cost – that are more persuasive compared with traffic safety concerns. This signifies the importance of providing non-behavioral safety strategies (e.g. safer vehicles or road infrastructures like self-explaining roads), which could improve the traffic safety irrespective of road users behavior and choices. More particularly, public transportation is generally known to be a safe mode, at least compared with private cars, however, some individuals feel safer when using their own private motorized vehicles (Ellaway et al., 2003). This could also be a reason why some individuals still tend to stay with their private cars inspite of the fact that the general population have chosen public transportation to be the safest travel mode.
The results presented here are merely the primary observations of the conducted survey. Despite insignificant changes at a global level, we observe many individuals who indicated their interest in shifting towards a different travel mode after taking into account the traffic safety concerns. It is worth investigating more in detail to uncover possible associations between sociodemographic and socioeconomic attributes of individuals with their travel demand behavior. To this end, a series of multinomial linear regression models are developed to demonstrate these associations. More complicated mode choice models by means of jointed revealed/stated preference multinomial linear regression models are currently under construction. The results of these models can potentially be used to derive policy relevant decisions so as to improve traffic safety.
REFERENCES
Bhat, C.R., Dubey, S.K., 2014. A new estimation approach to integrate latent psychological constructs in choice modeling. Transportation Research Part B: Methodological 67, 68–85. doi:10.1016/j.trb.2014.04.011
Ellaway, A., Macintyre, S., Hiscock, R., Kearns, A., 2003. In the driving seat: psychosocial benefits from private motor vehicle transport compared to public transport. Transportation Research Part F: Traffic Psychology and Behaviour 6, 217–231. doi:10.1016/S1369-8478(03)00027-5
Jamson, S., Wardman, M., Batley, R., Carsten, O., 2008. Developing a driving Safety Index using a Delphi stated preference experiment. Accident Analysis & Prevention 40, 435–442. doi:10.1016/j.aap.2007.07.014
Kamargianni, M., Dubey, S., Polydoropoulou, A., Bhat, C., 2015. Investigating the subjective and objective factors influencing teenagers’ school travel mode choice – An integrated choice and latent variable model. Transportation Research Part A: Policy and Practice 78, 473–488. doi:10.1016/j.tra.2015.06.011
Nevelsteen, K., Steenberghen, T., Van Rompaey, A., Uyttersprot, L., 2012. Controlling factors of the parental safety perception on children’s travel mode choice. Accident Analysis & Prevention 45, 39– 49. doi:10.1016/j.aap.2011.11.007
Rizzi, L.I., Ortúzar, J. de D., 2003. Stated preference in the valuation of interurban road safety. Accident Analysis & Prevention 35, 9–22. doi:10.1016/S0001-4575(01)00082-3
Shokoohi, R., Hanif, N.R., Dali, M., 2012. Influence of the Socio-Economic Factors on Children’s School Travel. Procedia - Social and Behavioral Sciences, AcE-Bs 2012 Bangkok, Sukosol Hotel, Bangkok, Thailand, 16-18 July, 2012 50, 135–147. doi:10.1016/j.sbspro.2012.08.022