ORIGINAL ARTICLE
Formation of tyrosine radicals in photosystem II under far-red
illumination
Nigar Ahmadova1 · Fikret Mamedov1
Received: 8 May 2017 / Accepted: 5 September 2017
© The Author(s) 2017. This article is an open access publication
Abbreviations
Chl Chlorophyll
Car Carotenoid
DPC Diphenylcarbazide
EPR Electron paramagnetic resonance Ferri Potassium ferricyanide K3[Fe(CN)6] PS II Photosystem II
Pheo Pheophytin
QA and QB Primary and secondary plastoquinone
accep-tor in PSII
TyrZ Tyrosine 161 on the D1 protein
Tris Tris(hydroxymethyl)aminomethane TyrD Tyrosine 160 on the D2 protein
Introduction
Solar energy is successfully utilized by plants, algae, and bacteria in the process called photosynthesis. In oxygenic photosynthesis, solar energy is converted to chemical energy in the form of carbohydrates and O2 is released as a
byproduct (Kern and Renger 2007; Renger and Renger 2008; Vinyard et al. 2013). The initial reaction of photosynthesis takes place in photosystem II (PS II), a multicomponent Chl protein complex embedded in the thylakoid membrane of chloroplasts and cyanobacteria. The active PS II complex is made from 25 protein subunits and host a chain of the redox-active cofactors involved in the key water oxidation reac-tion and subsequent electron transfer (Umena et al. 2011; Wei et al. 2016). These cofactors are bound by the PS II central core which is composed of the D1 and D2 proteins,
the inner pigment–protein antenna complexes CP43 and CP47, Cyt b559, and several low molecular weight essential
subunits (Danielsson et al. 2006; Umena et al. 2011; Suga et al. 2015). On the luminal side, water-oxidizing complex of Abstract Photosystem II (PS II) contains two redox-active
tyrosine residues on the donor side at symmetrical positions to the primary donor, P680. TyrZ, part of the water-oxidizing
complex, is a preferential fast electron donor while TyrD is
a slow auxiliary donor to P680+. We used PS II membranes
from spinach which were depleted of the water oxidation complex (Mn-depleted PS II) to study electron donation from both tyrosines by time-resolved EPR spectroscopy under visible and far-red continuous light and laser flash illumination. Our results show that under both illumination regimes, oxidation of TyrD occurs via equilibrium with TyrZ•
at pH 4.7 and 6.3. At pH 8.5 direct TyrD oxidation by P680+
occurs in the majority of the PS II centers. Under continuous far-red light illumination these reactions were less effective but still possible. Different photochemical steps were con-sidered to explain the far-red light-induced electron dona-tion from tyrosines and localizadona-tion of the primary electron hole (P680+) on the Chl
D1 in Mn-depleted PS II after the
far-red light-induced charge separation at room temperature is suggested.
Keywords Photosystem II · Tyrosine Z and D · Electron transfer · Far-red light
Electronic supplementary material The online version of this
article (doi:10.1007/s11120-017-0442-3) contains supplementary material, which is available to authorized users.
* Fikret Mamedov
fikret.mamedov@kemi.uu.se
1 Molecular Biomimetics, Department of Chemistry – Ångström Laboratory, Uppsala University, Box 523, 751 20 Uppsala, Sweden
plants and algae is shielded by three extrinsic proteins PsbO, PsbP, and PsbQ (Bricker et al. 2012).
The sequence of electron transfer reactions leading to the oxidation of water occurs in the following order. After light absorption by antenna, P680 is excited and rapidly loses an electron to the nearby primary electron acceptor Pheo. Reduced Pheo− passes an electron to the bound
plastoqui-none QA, forming QA− which in turn transfers an electron
to QB (Renger and Renger 2008). All these cofactors are single electron carriers while exchangeable plastoquinone QB can accept two electrons and then become double
pro-tonated upon reduction. Reduced QBH2 diffuses from the QB-pocket and is replaced by another plastoquinol from the membrane PQ pool (Renger and Renger 2008; Barber 2016). On the donor side of PS II, the water-oxidizing complex is composed of Mn4CaO5 cluster and redox-active tyrosine D1-161 (TyrZ), and mostly bound by the D1 protein. P680+ is
a strong oxidant with redox potential of 1.25 V, high enough to drive water oxidation reaction via TyrZ (Grabolle and Dau 2005; Cardona et al. 2012). Water oxidation occurs at the Mn4CaO5 cluster which goes through S-cycle to oxidize water to a molecular O2 and four protons by transferring four
electrons to P680+ via TyrZ (Rappaport et al. 2002; Renger
and Renger 2008; Vinyard et al. 2013).
In intact oxygen-evolving PS II TyrZ• oxidation has
half-time in nsec–µsec range (Brettel et al. 1984; Renger 2012). In the absence of Mn4CaO5 the half-time became by 2–3
orders of magnitude slower (Babcock and Sauer 1975a; Brettel et al. 1984). PS II contains another redox-active tyrosine D2-160 (TyrD), which is located symmetrically to
TyrZ on the D2 protein (Styring et al. 2012). Contrary to
TyrZ•, Tyr
D• is very stable and stays oxidized in the dark
for minutes to hours (Babcock and Sauer 1973; Styring and Rutherford 1987; Vass and Styring 1991). Due to the slow oxidation under physiological pH, TyrD is not competitive to
TyrZ as an electron donor to P680+. However, at elevated pH
with a pKa ~ 7.6, TyrD becomes a very efficient donor, with half-times comparable to those seen for TyrZ, (t1/2 = 190 ns)
(Faller et al. 2001, 2002). The difference in the environment of two tyrosines is the reason for their difference in oxidation kinetics (Umena et al. 2011). TyrD is in relative hydropho-bic environment, deeply buried in the protein interior. On the contrary, TyrZ is in more hydrophilic surrounding with
a cluster of water molecules nearby (Ferreira et al. 2004; Umena et al. 2011; Suga et al. 2015). Interestingly, TyrD has only a single water molecule nearby which can take two positions (2.6–3.1 and 4.3–4.5 Å) (Umena et al. 2011; Saito et al. 2013; Suga et al. 2015; Sjöholm et al. 2016; Ahmadova et al. 2017).
The primary donor in PS II, P680 consists of four Chl
molecules bound by the D1/D2 heterodimer denoted as PD1, PD2, ChlD1, and ChlD2, (see Scheme 1). The distance from reaction center Chl PD1 and PD2 to the TyrZ and TyrD,
respectively is 9.1–9.3 Å. Both tyrosines can be oxidized by P680 entity after light-triggered primary charge separation
formed P680+ Pheo− pair. It is still under debate which Chl
in P680 entity forms the primary donor (Rappaport and Diner 2008). Interestingly, apart from visible-light-driven charge separation, the far-red light-driven charge separation up to 800 nm was reported in PS II (Thapper et al. 2009). Tak-ing into account the lower energy of the far-red photons an alternative primary charge separation event was proposed (Thapper et al. 2009). It was also shown that at low tempera-ture the primary charge pair formed under the far-red light illumination is ChlD1+ Pheo− (Hughes et al. 2006; Romero
et al. 2012; Mokvist et al. 2014; Novoderezhkin et al. 2016). This conclusion was made based on the different yields of the electron donor pathways in PS II at 5 K (Mokvist et al. 2014). The situation at physiological temperatures is unclear (Reimers et al. 2016).
The slow oxidation behavior of TyrD makes it possible
to study by the conventional EPR spectroscopy while TyrZ
oxidation kinetics is too fast to be followed. Different bio-chemical treatment such as Tris and NH2OH washing can remove the Mn4CaO5 cluster and extrinsic proteins,
leav-ing PS II core exposed to the lumen (Boussac and Etienne
1982b; Gadjieva et al. 1999; Mamedov et al. 2007). This makes TyrZ oxidation to slow down by two or three orders of magnitude (t1/2 = 20–600 ms) (Buser et al. 1990). In this case
both tyrosine donors can be accessed by EPR spectroscopy. Symmetrically situated at the different sides of P680, they
constitute a useful, simplified system to study the far-red-induced photochemistry at room temperature (Scheme 1).
In the present work we investigate the primary charge separation through oxidation of two tyrosines under two different excitation wavelengths. We have studied tyrosine
Scheme 1 Electron transfer components and primary charge
separa-tion events in PS II under visible and far-red light illuminasepara-tion. Num- illumination. Num-bers indicate distances between components in Å
oxidation kinetics in the Mn-depleted PS II membranes at different pH values. The difference in the oxidation effi-ciency of TyrZ and TyrD allowed us to suggest localization
of the primary electron donor Chl in P680 after far-red illu-mination at physiological temperature.
Materials and methods
Sample preparation
PS II-enriched membranes (BBY type) were isolated from hydroponically grown spinach (Spinacia oleracea) by the method of Berthold et al. 1981 with some modifications according to Völker et al. (1985). The samples were resus-pended in a 25 mM MES buffer, pH 6.1, 400 mM sucrose, 15 mM NaCl, and 3 mM MgCl2 at a Chl concentration of 5–6 mg/mL and stored at −80 °C until use. All sample preparations were performed in darkness or under the dim green light.
The Mn4CaO5 cluster and extrinsic subunits were removed by the Tris washing (Gadjieva et al. 1999, Mame-dov et al. 2007). PS II membranes were resuspended in 1.0 M Tris buffer at pH 9.1 with Chl concentration 1 mg/ mL. They were stirred at 4 °C for 30 min under room light. After centrifugation, the pellet was washed twice with a low molar buffer containing 2 mM MES–NaOH pH 6.1, 300 mM sucrose, 10 mM NaCl, 3 mM MgCl2, and stored at −80 °C. This treatment washed away >90% of bound Mn and all three extrinsic proteins (Gadjieva et al. 1999). TyrD
reduction in Tris-washed PS II samples was obtained by
incubation samples at a concentration of 4–5 mg of Chl/ mL in the dark for 10 h at room temperature (21 °C). The incubation treatment reduced about 95% of the TyrD (Fig. 1).
For the experiments samples were diluted to 2 mg Chl/ mL by addition of the appropriate amount of high molar measuring buffer, containing 300 mM sucrose, 10 mM NaCl, and 3 mM MgCl2 with 150 mM of either glutamic acid (pH
4.7), MES (pH 6.3), or glycylglycine (pH 8.5). The final buffer concentration after addition of high molar buffer was 25 mM.
Steady-state oxygen evolution activity was measured with a Hansatech Clark-type electrode at 20 µg of Chl/mL in a measuring buffer at pH 6.1. 2 mM potassium ferricya-nide K3[Fe(CN)6] and 0.5 mM PpBQ were used as electron
acceptors. The activities of the PSII membrane preparation was ∼550 µmol of O2× (mg of Chl)−1 × h−1 (pH 6.3), while
Tris-washed samples did not show any oxygen evolution. EPR measurements
Room temperature EPR measurements were performed with ELEXSYS E500 spectrometer (Bruker Biospin GmbH) equipped with a SuperX bridge and a super high Q SHQE4122 cavity. The measurements were done in a 250 μL quartz flat cell at a sample concentration of ∼2 mg of Chl/mL. Steady-state TyrZ/D oxidation was monitored after
induction with LED setup (white or far-red light, see below) mounted at the EPR cavity window at field position of 3465 G. In addition, TyrZ/D oxidation kinetics was triggered with a 6 ns, 100 mW, 523 or 732 nm laser flash given to the sam-ple. Data analysis was performed with the Bruker Xepr 2.1
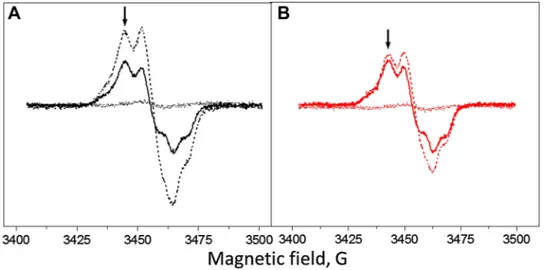
Fig. 1 EPR spectra of the Tyr radicals from the Tris-washed PS II
membranes at pH 8.5 induced by white light illumination (A, black spectra) or far-red light illumination (B, red spectra). Spectra shown are after 10 h dark incubation at room temperature (dotted line spec-tra), during continuous illumination (dashed line spectra) and after
5 min of dark incubation (solid line spectra). The arrows indicate the field position (3465 G) for the kinetics measurements. EPR condi-tions: microwave frequency 9.75 GHz, microwave power 8 mW, mod-ulation amplitude 5 G, temperature 293 K
software. The standard error in the signal amplitude estima-tion in our EPR measurements was less than 5%.
Light sources
Samples were illuminated with two kinds of LED: white and far-red light. White light LED had one major emission peak at 450 nm and two smaller peaks at 549 and 600 nm. Far-red light LED had an emission peak at 732 nm. Two cut-off Schott filters CC4 and RG9 were used with far-red LED to ensure no visible-light contamination (see Supple-mentary Fig. 1S for the actual output spectra of used LED light sources). LEDs were set up at the EPR cavity window. 532 and 732 nm laser flashes (20 mJ, pulse duration 6 ns, pulse bandwidth ±0.1 nm) were provided by the Quanta-Ray MOPO-730 optical parametric oscillator, driven by Nd: YAG laser (Spectra Physics, USA).
Results
TyrD• is much less stable in the Mn-depleted PS II than in
the active PS II samples with the full O2-evolving activity,
where reduction of TyrD• requires application of the
reduc-ing agents (Vass and Styrreduc-ing 1991; Sjöholm et al. 2016; Ahmadova et al. 2017). The dark incubation of our Tris-washed PS II membranes for 10 h at room temperature resulted in the reduction of 90–95% of TyrD• (Fig. 1,
dot-ted line spectra). Under illumination, both tyrosines can be observed by the conventional EPR spectroscopy; however, their different kinetic properties allow to clearly distinguish between TyrD• and Tyr
Z• after light is switched off.
Moreo-ver, similar EPR properties of both radicals in the absence of the Mn cluster allow to quantify TyrZ• on the basis of
TyrD• radical (Boussac and Etienne 1982a, 1984; Roffey
et al. 1994).
Illumination of the sample for 2 min with white light at pH 8.5 and subsequent 5 min dark adaptation resulted in full oxidation of TyrD• (Fig. 1A, solid line spectrum). Any
induced TyrZ• has decayed during 5 min of dark
adapta-tion (decay half-time of TyrZ• is ca 600 ms in Tris-washed
PS II at this pH, Table 1) and any decay of TyrD• is
neg-ligible. Thus, the resulted spectrum is taken for 100% of TyrD• and was used in further quantifications. When
meas-urements were performed under illumination conditions, tyrosine radical spectrum arose from TyrD• (100%) and the
additional intensity, which is attributed to the TyrZ• radical
(75%, Fig. 1A, dashed line spectrum). When measurements were done under far-red illumination, the additional inten-sity from TyrZ• amounted to only 15% (Fig. 1B, dashed line
spectrum).
The kinetics of TyrD and TyrZ oxidation were measured
by monitoring the EPR signal induction at 3465 G (arrow in Fig. 1) under continuous illumination at three different pH values (Fig. 2). The field position chosen for kinetic meas-urement is lying outside of the magnetic field range in which signals from Chl and Car cations could contribute (Visser et al. 1977; Hanley et al. 1999).
Tyrosine oxidation under continuous white or far-red light illumination
Steady-state oxidation of TyrD and TyrZ residues in the
Mn-depleted PS II membranes under continuous illumination with white or far-red light are shown in Fig. 2. The oxidation kinetics was accelerated towards the higher pH values under both illumination conditions. The total yield of tyrosine radi-cal formation was also pH dependent and increased towards high pH. The maximum formation of tyrosine radicals was observed at pH 8.5 (Fig. 2C).
Under white light illumination, the steady-state level of tyrosine oxidation reached maximum at any given pH quite fast within ca 50 s (Fig. 2, black traces). The maximum cor-responded to 65% at pH 4.7, 100% at pH 6.3, and 195% at pH 8.5. Almost 200% of oxidation indicates that full induc-tion of both TyrZ• and TyrD• was achieved at high pH. Some
decay of the steady-state level of the signal was observed during illumination after 50 s at pH 6.3 (~5%) and 100 s at pH 8.5 (~10%) (Fig. 2B, C, black traces). This decay is due to the full reduction of the acceptor side which leads to the backflow of electrons from QA− or Q
B− to TyrZ• and/or
pho-toinhibition. Such decay was not observed in the presence
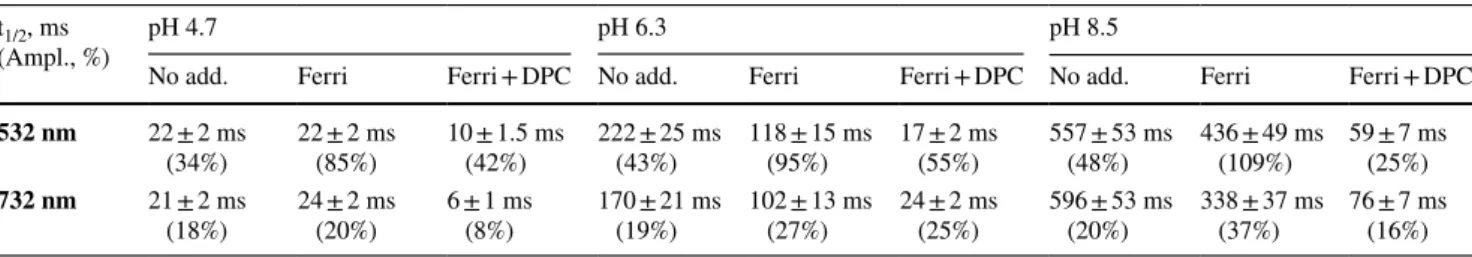
Table 1 Fitted half-times and amplitudes of TyrZ• exponential decay after induction by 532 and 732 nm laser flash in the Tris-washed PSII membranes without any additions or in the presence of 2 mM ferricyanide (Ferri) and 2 mM ferricyanide and 1 mM DPC (Ferri + DPC)
The standard error in the signal amplitude estimation in our EPR measurements was <5% t1/2, ms
(Ampl., %) pH 4.7 pH 6.3 pH 8.5
No add. Ferri Ferri + DPC No add. Ferri Ferri + DPC No add. Ferri Ferri + DPC
532 nm 22 ± 2 ms
(34%) 22 ± 2 ms (85%) 10 ± 1.5 ms (42%) 222 ± 25 ms (43%) 118 ± 15 ms (95%) 17 ± 2 ms (55%) 557 ± 53 ms (48%) 436 ± 49 ms (109%) 59 ± 7 ms (25%)
732 nm 21 ± 2 ms
of exogenous acceptor (see below). Interestingly, after the light was turned off and 5 min of dark incubation of white light illuminated samples, no decay of tyrosine amplitude was observed at pH 4.7 (Fig. 2A, black dot). While at higher pH, the amplitude of tyrosine signal decreased to 67% at pH 6.3 and to 105% at pH 8.5 (Fig. 2B, C, black dots).
The kinetics of tyrosine oxidation under the far-red illu-mination was different from the kinetics under the white light illumination at all three pH values investigated. Oxida-tion of tyrosine was much slower at pH 4.7 and 6.3 (Fig. 2A, B, red traces). However, the sharp rise has been observed at pH 8.5 and was comparable to the white light oxidation rise (Fig. 2C, red trace). The total yield of Tyr• under
far-red light illumination was 47% at pH 4.7, 60% at pH 6.3, and 105% at pH 8.5. At pH 4.7 and 6.3 Tyr oxidation never reached the steady-state level even after illumination for 325 s (Fig. 2A, B, red traces), whereas at pH 8.5, the oxida-tion reached half of the level of tyrosine oxidaoxida-tion under white light illumination very fast within 50 s and was contin-ued to slowly rise afterwards (Fig. 2C, red trace). Incubation of far-red illuminated samples for 5 min resulted in the addi-tional rise of tyrosine amplitude at pH 4.7 and 6.3 to 67% (Fig. 2A and B, red dot). In contrast, at pH 8.5 decrease of tyrosine amplitude to 91% was observed (Fig. 2C, red dot).
To conclude this part, continuous illumination of the reduced Mn-depleted PSII membranes with white light resulted in the formation of stable TyrD• radical at pH 4.7
and 6.3 as could be judged from its post-illumination stabil-ity. The formation was much slower and less effective under far-red light illumination if compared with white light illu-mination. In contrast, at pH 8.5 illumination with white light resulted in the formation of both TyrZ• radical and TyrD•
rad-ical, while illumination with far-red light resulted in albeit fast but only TyrD• formation. Thus, the only conditions
which resulted in the observation of semi-stable TyrZ• were
high pH and white light.
Flash-induced tyrosine signal formation
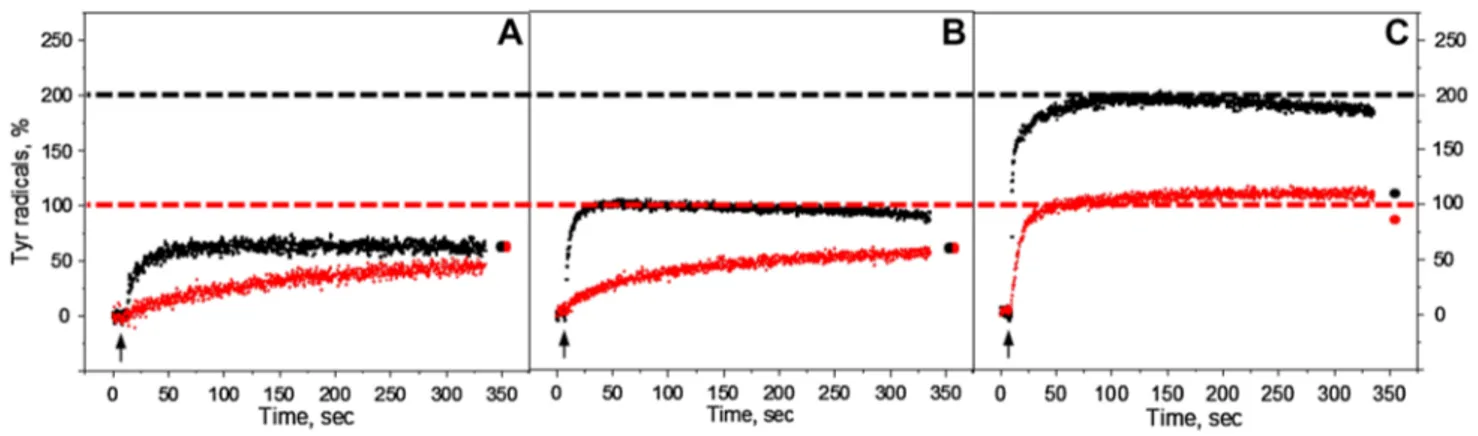
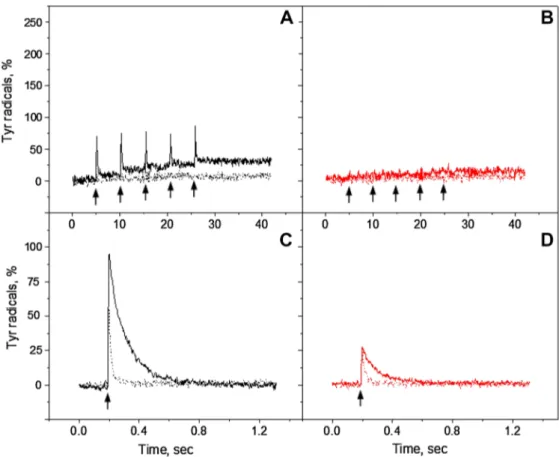
In order to further investigate the sequence of tyrosine radi-cal formation in PS II, the monochromatic laser flashes at 532 and 732 nm were used. Figure 3A-C show the kinetic of TyrZ• and Tyr
D• formation and decay after five consecutive
flashes separated by 5 s interval (indicated by arrows). Tyr•
was formed after each flash is divided into the decaying and non-decaying tyrosine signal. According to the decay half-times of TyrZ• and Tyr
D• in the Mn-depleted PSII
prepara-tions, the decaying part of tyrosine signal is attributed to TyrZ• and non-decaying part to TyrD• (Babcock and Sauer 1975a; Vass and Styring 1991). At pH 4.7, with green and far-red flashes, TyrZ and TyrD oxidation took place in 5–10% of PS II centers (Fig. 3A). Similarly, very small induction of TyrZ• and TyrD• was observed at pH 6.3 with far-red flashes
(15–20%, Fig. 3B, red trace). With green flashes at pH 6.3 however, both tyrosines were induced in the substantial number of PS II centers, resulting in 41% of non-decaying TyrD• (black trace). At pH 8.5 significant amount of both
tyrosines was formed at both wavelengths as could be judged from the decaying and non-decaying parts similarly to what was observed under continuous illumination. Again the final amplitude of TyrD• induced by green flashes (117%) was
higher than induced by far-red flashes (72%, Fig. 3C). Contribution of TyrZ• to the total oxidation process was
studied in more detail in the same samples after TyrD
oxi-dation was completed (Fig. 3D-F). After accumulation, it is clear that TyrZ• signal was inducible at all three pHs by
both 532 and 732 nm wavelengths. The amplitude of TyrZ•
was twice higher after green flashes if compared to far-red
Fig. 2 Kinetics of tyrosine oxidation recorded at 3465 G under
con-tinuous white light (black traces) or far-red illumination (red traces) in the reduced Mn-depleted PS II membranes at pH 4.7 (A), pH 6.3 (B), and pH 8.5 (C). Each trace represents an average of four single measurements in independent samples. The amplitude of tyrosine
radical after 5 min dark incubation is indicated as a black or red circle at the end of the each trace. The arrows indicate starting time point of illumination. EPR conditions: microwave frequency 9.75 GHz, micro-wave power 8 mW, modulation amplitude 5 G, temperature 293 K
flashes. Similarly to the continuous illumination experi-ments, TyrZ oxidation was pH dependent and was small at
pH 4.7 and increased towards pH 8.5. This difference was pronounced with green flash induction (Fig. 3D-F, black traces). TyrZ• signal decay was also pH dependent and
slowed down towards higher pHs with both wavelengths, from 21 ms at pH 4.7 to 596 ms at pH 8.5 (Fig. 3D-F; Table 1).
Influence of exogenous electron acceptor
Better oxidation of tyrosines could be achieved by addition of ferricyanide which also prevents the loss of charge sepa-ration by recombination of QA− TyrZ• and QB− TyrZ• states
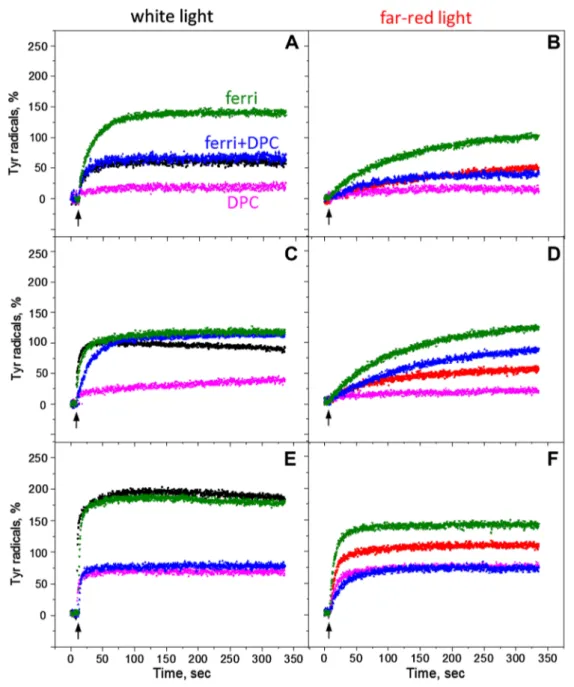
(Bishop and Spikes 1955; Delrieu and Rosengard 1989). We have measured oxidation of tyrosine in the presence of ferricyanide in order to further understand the tyrosine oxi-dation in Mn-depleted PS II under continuous illumination with white and far-red light. Figure 4 (green traces) show the oxidation kinetics in the presence of ferricyanide at pH 4.7, 6.3 and 8.5 respectively. At pH 4.7 the amplitude of tyrosine oxidation was twice higher in the presence of ferricyanide if compared to a trace without any addition (Fig. 4, green traces). However, under far-red illumination, the kinetics
was slower, but more efficient, and still rising after 325 s of illumination (Fig. 4B, green trace).
The kinetics of tyrosine oxidation measured at pH 6.3 with the ferricyanide addition under white light was very similar to the kinetics obtained without any addi-tions (100% oxidation), except for the absence of the small decay after the maximum amplitude was reached (Fig. 4C, green and black traces). This is reasonable since the pres-ence of the acceptor is preventing decay to the steady-state equilibrium between tyrosine oxidation and recombination reactions. Under far-red light however, the oxidation kinet-ics were much slower and rose to the higher level in the presence of ferricyanide than without any additions and reached the same amplitude (100%) as under white light illumination (Fig. 4D, green trace). At higher pH, under white light illumination, the oxidation kinetics and ampli-tude were again very similar in the presence or absence of ferricyanide reaching ca 200% indicating full oxidation of both TyrZ and TyrD (Fig. 4E, green and black traces).
Interestingly, under far-red light at pH 8.5, the amplitude was higher than without acceptor almost reaching 142% (Fig. 4F, green trace) if compared to the black trace with-out additions (100%). This indicates that in addition to the full induction of TyrD•, 50% of Tyr
Z• was induced by
Fig. 3 TyrZ and TyrD oxidation kinetics at 3465 G in the reduced Mn-depleted PS II membranes, induced by a train of five 532 nm (black traces) or 732 nm laser flashes (red traces) at pH 4.7 (A), pH 6.3 (B) and pH 8.5 (C). Each trace represents an average of four sin-gle measurements in independent samples. TyrZ oxidation kinetics
induced by single 532 nm (black traces) or 732 nm laser flash (red traces) at: pH 4.7 (D), pH 6.3 (E) and pH 8.5 (F). Each trace repre-sents an average of 199 flashes. EPR conditions are the same as in Fig. 2
far-red light at pH 8.5 in the Mn-depleted PS II centers. The rise of the signal was also fast and comparable to the white light induction at these conditions.
Influence of exogenous electron donor
To distinguish between direct (by P680+) or indirect (via
equilibrium with TyrZ•, see Scheme 2) oxidation of TyrD,
DPC as an exogenous electron donor to TyrZ• was added
to the samples before illumination. It is known that addi-tion of DPC accelerates the TyrZ• lifetime and this makes
it less available for TyrD oxidation (Babcock and Sauer
1975b; Yerkes and Babcock 1980; Roffey et al. 1994). Figure 4A-D (pink traces) show oxidation kinetics under continuous white and far-red light illumination in the pres-ence of DPC at pH 4.7 and 6.3, respectively. It is clear that addition of DPC significantly inhibited tyrosine oxi-dation in the majority of PS II centers under both illumi-nating conditions. At pH 6.3 oxidation was slightly better than at pH 4.7; however, at both pHs tyrosine oxidation did not reach the complete equilibrium and the kinetics were still rising after 325 s of both white and far-red light
Fig. 4 Kinetics of tyrosine oxidation recorded under white light (A, C, E, black traces) or far-red light illumination (B, D, F, red traces)
at pH 4.7 (A, B), pH 6.3 (C, D) and pH 8.5 (E, F). Pink traces—in
the presence of 1 mM DPC; green traces—in the presence of 2 mM ferricyanide and blue trace—in the presence of 1 mM DPC and 2 mM ferricyanide. EPR conditions are the same as in Fig. 2
illumination (Fig. 4A-D, pink traces). Interestingly, at pH 8.5 the tyrosine induction was better and both white and far-red light illumination have the same effect on oxidation
which reached 70% of the PS II centers (Fig. 4E, F, pink traces).
We also performed these measurements in the presence of both exogenous donor and acceptor, DPC and ferri-cyanide, to see how the steady-state equilibrium between tyrosine oxidation and recombination reaction will be affected (Fig. 4, blue traces). The effect was very pH dependent. At pH 4.7 the presence of both DPC and fer-ricyanide resulted in higher tyrosine amplitude than in the presence of only DPC under both light conditions (Fig. 4A, B, blue traces). It restored amplitude to the level which was achieved in the measurements without any additions (compare to black and red traces). At pH 6.3 the effect was bigger and final amplitude of Tyr• was significantly higher
than in the presence of only DPC and 25–35% higher than in a sample without any additions (Fig. 4, compare black, pink, and blue traces (C) and red, pink, and blue traces (D). The oxidation kinetics under white light was however slowed down (Fig. 4C, blue trace). At pH 8.5 addition of ferricyanide had no effect and the final oxidation level was very similar to the level obtained only in the presence of DPC (Fig. 4E, F, pink and blue traces).
Scheme 2 Electron transfer events and redox equilibria leading to
TyrD and TyrZ oxidation in the Mn-depleted PS II centers
Fig. 5 TyrZ and TyrD oxidation kinetics in the reduced Mn-depleted PS II membranes, induced by a train of five 532 nm (A, black traces) or 732 nm laser flashes (B, red traces) at pH 4.7 in the presence of 2 mM ferricyanide (solid line) or in the presence of 2 mM ferricya-nide and 2 mM DPC (dotted line). TyrZ oxidation kinetics induced by
single 532 nm (C, black traces) or 732 nm laser flash (D, red traces) at pH 4.7 in the presence of 2 mM ferricyanide (solid line) or in the presence of 2 mM ferricyanide and 2 mM DPC (dotted line). EPR conditions are the same as in Fig. 3
It should be noted that only TyrD• was formed in the
pres-ence of DPC or DPC and ferricyanide under both white and far-red light as can be estimated from the residual signal after the light was switched off (not shown). We were not able to observe any fast decaying TyrZ• and the signal was
never higher than 100% at all pH values measured. Our con-clusion from these measurements is that DPC is an effective donor to TyrZ• at all three pH values and the addition of
fer-ricyanide only eliminates the recombination reaction from the acceptor side of PS II which takes place at low pH values (Ahmadova et al. 2017).
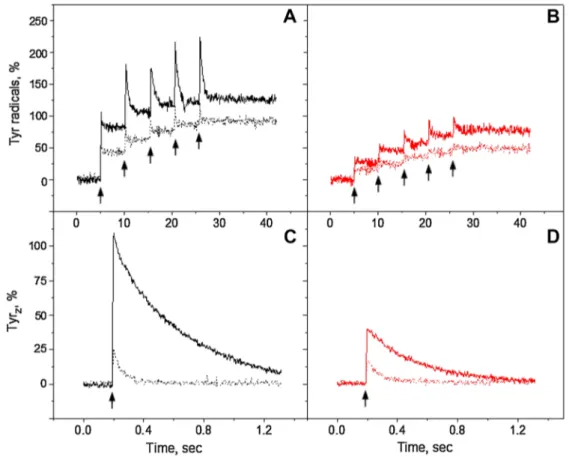
Flash-induced tyrosine signal formation in the presence of donor and acceptor
Figures 5, 6, and 7 show the kinetics of TyrZ· and Tyr D·
for-mation and decay after five consecutive laser flashes sepa-rated by 5 s each (indicated by arrows) in the presence of electron donor and acceptor. In the presence of only fer-ricyanide we observed TyrZ oxidation at pH 4.7 and 6.3 from the first given green flash (Figs. 5A, 6A, black solid traces). At pH 8.5 oxidation was very efficient and resulted
in complete oxidation of TyrZ with consequent decay and of
TyrD (Fig. 7A, black solid trace). Interestingly, no fast decay
was observed after the first flash, similar to measurements without any additions (Fig. 3C, black trace).
Interestingly, we did not detect TyrZ oxidation with single
far-red flashes in the presence of ferricyanide and final TyrD
oxidation was less than 12% at pH 4.7 or at pH 6.3 (Figs. 5B,
6B, red solid traces). At pH 8.5 with far-red flashes, we observed almost full oxidation of TyrD after five flashes
(80%, Fig. 7B, red solid trace). Unlike in oxidation with green flashes, the fast decay kinetics (TyrZ•) was observed
on the third flash and onward but seemingly the first two flashes induced only TyrD oxidation in the majority PS II
centers at high pH (48%, Fig. 7B, red solid trace).
Accumulated TyrZ• signal induced by green or far-red
flashes in the presence of ferricyanide is shown in Figs. 5,
6, and 7C and D, solid traces. With 532 nm induction, the amplitude of TyrZ• slightly increased towards high pH and
corresponded to 85% at pH 4.7, 95% at pH 6.3, and 109% at pH 8.5. With 732 nm induction, we observed only 20% at pH 4.7, 27% at pH 6.3, and 37% at pH 8.5. The decay half-times were also pH dependant and corresponded to 22 ms
Fig. 6 TyrZ and TyrD oxidation kinetics in the reduced Mn-depleted PS II membranes, induced by a train of five 532 nm (A, black traces) or 732 nm laser flashes (B, red traces) at pH 6.3 in the presence of 2 mM ferricyanide (solid line) or in the presence of 2 mM ferricya-nide and 2 mM DPC (dotted line). TyrZ oxidation kinetics induced by
single 532 nm (C, black traces) or 732 nm laser flash (D, red traces) at pH 6.3 in the presence of 2 mM ferricyanide (solid line) or in the presence of 2 mM ferricyanide and 2 mM DPC (dotted line). EPR conditions are the same as in Fig. 3
at pH 4.7, 118 ms at pH 6.3, and 436 ms at pH 8.5, Figs. 5,
6, and 7C and D, solid traces, Table 1. The decay half-time was independent of the induction wavelength.
We also investigated the kinetics of flash-induced tyrosine signal formation in the presence of both DPC and ferricya-nide (Figs. 5, 6, 7A and B, dotted traces). The addition of DPC almost completely inhibited the tyrosine formation at pH 4.7 and 6.3. We did not observe any TyrZ• formation in
the presence of DPC and the final TyrD• formation was less
than 5% at these two pH values (Figs. 5, 6A and B, dotted traces). At pH 8.5, the TyrZ• signal was still unresolvable
in the presence of DPC but TyrD oxidation occurred in the
majority of the PS II centers with 532 nm flashes (>75%, Fig. 7A, black-dotted trace) and in less centers with 732 nm flashes (45%, Fig. 7B, red-dotted trace). Figures 5, 6, and 7C and D show that in the presence of DPC the TyrZ• induction
is strongly inhibited and very short lived (ca 20 ms or less, Table 1) at low pH values, while at high pH the half-time was less affected and significant loss of TyrZ• amplitude
could be attributed to competitive reduction of P680+ by TyrD
(Scheme 2) (Fig. 7C, D, dotted traces).
Discussion
The special Chl molecules, P680, serve as a primary electron donor in PS II. P680 is a tetrameric pigment entity which comprises four Chl molecules. The central Chl pair, PD1 and
PD2 are weakly excitonically coupled and situated at 30°
angle to the horizontal plane. The other two Chls, ChlD1 and ChlD2 are occupying symmetrical positions at 10 Å center-to-center distance each from PD1 and PD2, respectively
(Scheme 1) (Umena et al. 2011; Suga et al. 2015; Wei et al.
2016). The localization of excitation energy in P680 and the first Chl+ electron donor formed after the “standard” charge
separation conditions (visible-light excitation) have been extensively studied by different spectroscopic methods (Zech et al. 1997; Diner et al. 2001; Groot et al. 2005; Holzwarth et al. 2006; Romero et al. 2010, 2012). The primary hole is consensually placed on the PD1 Chl (PD1+) (Scheme 1)
(Hillmann et al. 1995; Diner et al. 2001; Schlodder et al.
2008b; Cardona et al. 2012) although some groups reported that weak spectral differentiation among all four Chls might lead to a distribution of the excitation energy at ambient tem-perature (Romero et al. 2010, 2012). There are also reports
Fig. 7 TyrZ and TyrD oxidation kinetics in the reduced Mn-depleted PS II membranes, induced by a train of five 532 nm (A, black traces) or 732 nm laser flashes (B, red traces) at pH 8.5 in the presence of 2 mM ferricyanide (solid line) or in the presence of 2 mM ferricya-nide and 2 mM DPC (dotted line). TyrZ oxidation kinetics induced by
single 532 nm (C, black traces) or 732 nm laser flash (D, red traces) at pH 8.5 in the presence of 2 mM ferricyanide (solid line) or in the presence of 2 mM ferricyanide and 2 mM DPC (dotted line). EPR conditions are the same as in Fig. 3
that the reduction of PheoD1, which is the primary acceptor in PS II (Scheme 1) occurs prior to the oxidation of PD1/PD2
(Groot et al. 2005; Holzwarth et al. 2006).
The far-red photochemistry at low temperature has been suggested to induce different primary charge pair, ChlD1+
Pheo− (Mokvist et al. 2014). This was based on the different
donation efficiency to P680+ from Tyr
Z and Cyt b559/ChlZ
pathways under green and far-red illumination at 5 K, in the so-called product analysis of the charge-separated state (Mokvist et al. 2014). It seems that nature of the primary electron hole in P680+ varies depending on the
tempera-ture and excitation wavelength (Raszewski et al. 2008). In this paper, we investigate if the similar effect of excitation wavelength (visible vs. far-red light) on the primary donor occurs at physiological conditions. TyrZ and TyrD, which
are symmetrically positioned at about 9.2 Å distance from the central PD1 and PD2 Chls, respectively, (Scheme 1) were used as competing electron donors to elucidate the nature of the primary charge-separated state at room temperature.
The task is complicated by the fact that there are two electron transfer pathways for TyrD to be oxidized in the Mn-depleted PS II. The first one is occurring via TyrZ• which
is formed rapidly after oxidation by P680+. TyrD, with its
lower redox potential, is then slowly oxidized in the fol-lowing reaction (Boussac and Etienne 1982c, 1984; Faller et al. 2001):
This oxidation pathway occurs at low and middle pH val-ues. However, at high pH (above pKa of TyrD (Vass 1991;
Faller et al. 2001; Ahmadova et al. 2017)), direct TyrD
oxida-tion by P680+ was reported in the Mn-depleted preparation
in at least half of the PS II centers (Faller et al. 2001). As a result, partial localization of the electron hole on PD2 Chl
was suggested (Faller et al. 2001).
Our data show that under continuous illumination we mostly observed oxidation of TyrD (except white light illumination at high pH where both TyrZ• and TyrD• were
formed (Fig. 2)). The pH dependence of TyrD• induction was
similar to what was reported on green flash-induced TyrD•
formation in intact PS II (Vass and Styring 1991; Sjöholm et al. 2016; Ahmadova et al. 2017). In our Tris-washed PSII membranes, under continuous white light illumination TyrD
oxidation takes place in 65 and 100% at pH 4.7 and 6.3, respectively (Fig. 2A, B, black traces). With far-red light illumination (732 nm LED light), oxidation at these pH values was much slower and less effective (Fig. 2A, B, red traces). The diminished formation of TyrD under far-red light
could be due to either less effective charge separation or due to the different nature of the primary donor which makes the far-red photochemistry less effective.
(1)
TyrDTyrZ���������������light→ TyrDTyrZ∙ → Tyr∙DTyrZ
The first hypothesis seems unlikely because under 732 nm light most of the PS II centers undergo charge separation. As it was shown by (Thapper et al. 2009) illumination with 730 nm light resulted in P680+ Pheo− primary charge pair
formation in the vast majority of the PS II centers. This is by far in more centers than the decreased tyrosine radi-cal formation under similar 732 nm illumination (Fig. 2A, B). Thus, the possibility of the second hypothesis cannot be ruled out. At pH 8.5 continuous white light illumina-tion induces both tyrosines. Interestingly, illuminaillumina-tion with 732 nm light resulted in only TyrD• formation (Fig. 2C, red
trace). Full induction of TyrD• (100%) also indicates that
far-red light excites 100% of the PS II centers, as mentioned above. The difference between tyrosine formation at pH 8.5 under visible and far-red illumination could originate either from different tyrosine oxidation pathways (TyrD vs. TyrZ) or different localizations of the primary donor. Here our data with the addition of exogenous donor and acceptor to regu-late the “redox pressure” in and out from TyrZ· (Scheme 2)
will help to answer these questions.
The addition of ferricyanide increased oxidation ampli-tude of TyrD at low pH by efficiently preventing
recombina-tion from the acceptor side of PS II (Fig. 4, green traces). At pH 6.3 and 8.5, the effect of ferricyanide addition was only observable under the far-red illumination (Fig. 4D, F). Since we also observed that the addition of ferricyanide also increased the amplitude of TyrZ• induction (Table 1), it is
clear that final oxidation of TyrD, at pH 4.7 and 6.3, takes place via TyrZ• as described in reaction (1). More
impor-tantly, this indicates that recombination reaction was more efficiently prevented by the ferricyanide addition under far-red light illumination. This implies different recombination partners formed under the far-red light on the donor side of PS II. Since TyrZ• is the same at both illumination
con-ditions, the only difference could be assumed at the P680+
entity.
The most important and informative results were obtained when measurements were done in the presence of DPC. DPC is known to be an efficient electron donor to TyrZ•
in the Mn-depleted PS II preparations (Babcock and Sauer
1975b; Yerkes and Babcock 1980; Roffey et al. 1994). In our case, both TyrD and DPC are competing for the TyrZ•
reduction and in the presence of DPC the decay half-time of TyrZ• is significantly decreased (Table 1); thus, effectively
blocking indirect TyrD oxidation (Scheme 2). The addition of DPC severely inhibited TyrD• formation at pH 4.7 and
6.3 under both white and far-red illuminations (Fig. 4A-D, pink traces). DPC inhibition of the TyrD• formation was
more effective under far-red light illumination (only 18 and 19% formation at pH 4.7 and 6.3, respectively). Interest-ingly, even under white light illumination at pH 8.5 only TyrD oxidation was observed in the presence of DPC and no extra intensity could be attributed to the TyrZ oxidation
(Fig. 4E, F, pink traces). This is another indication for the direct oxidation of TyrD by P680+ at high pH (Scheme 2)
(Faller et al. 2001).
In the presence of both DPC and ferricyanide, the oxida-tion kinetics was found to be similar to what was found in the absence of any additions (Fig. 4A-D, blue traces). In this case, availability of the electron donor (DPC) and accep-tor (ferricyanide) to and from TyrZ• allowed the same final
steady-state oxidation level, thus, effectively restoring the original “redox pressure” on TyrZ•.
Flash-induced TyrZ• oxidation was observed at all pHs
and under both 532 and 732 nm laser flash in our Tris-washed PS II membranes. It was both pH dependent (as was reported before (Boska et al. 1983)) and wavelength dependent (Table 1; Figs. 3E, D, and 5, 6, 7C and D). The decay half-time of TyrZ• was pH dependent (Babcock and
Sauer 1975a; Shigemori et al. 1997) but wavelength inde-pendent (Table 1). This indicates that after the TyrZ•
forma-tion (if any), its consequent reducforma-tion either from TyrD• or
DPC (when present) or by recombination from the acceptor side (Scheme 2) was independent on the way of how the primary charge separation occurred. At pH 4.7 and 6.3 the presence of DPC decreased the amplitude of TyrZ•,
espe-cially under 732 nm flash (to final 3% and 25%, respectively if compared to 532 nm flash (Figs. 5, 6C and D; Table 1)). This resulted in significantly less TyrD• formation, especially
after far-red flashes (Figs. 5, 6A and B). In contrast at high pH 8.5, even if the effect of DPC addition on TyrZ•
kinet-ics was similarly dramatic, a significant amount of TyrD•
was formed. The absence of the fast decay on the first flash in Fig. 7A, B points out to the direct oxidation of TyrD•
by P680+ under both green and far-red (although much less
efficiently) flashes.
Thus, our data indicate that different photochemistry is involved in oxidation of two tyrosines in the Mn-depleted PS II membranes. The far-red light-induced photochemis-try is taking place in the majority of the PS II centers. At normal pH values, it results in the decrease of TyrZ•
forma-tion and correspondingly higher recombinaforma-tion rate under the far-red light illumination. Recombination reaction takes place between the acceptor side of PS II (QA− or Q
B−) and
P680+ which prevents TyrZ• formation. The reason for this
could be a different primary charge separation event and correspondingly the localization of the electron hole in P680+
(Scheme 1).
The central Chl pair, PD1 and PD2 is excitonically weakly
coupled. The greater physical separation, the slight differ-ences in tetrapyrrole ring orientation, and the smaller dipole strength of the Qy transition cause weaker electronic interac-tion between special Chl pair (Diner and Rappaport 2002; Raszewski et al. 2005; Schlodder et al. 2008a). This is why the Chl pair, PD1 and PD2 do not represent the lowest energy sink for the excitation energy (Diner and Rappaport 2002;
Raszewski et al. 2005; Schlodder et al. 2008a). Whereas the monomeric ChlD1 has the lowest site energy because
of the absence of such coupling (Schlodder et al. 2008a). The far-red light bears low excitation energy if compared to white light. Therefore, far-red light-induced excitation migration among four Chls in P680 would be an
energeti-cally less favorable process. It is more likely that under the far-red light the excitation localized on ChlD1, closer to the primary electron acceptor, Pheo (Scheme 1) was shown to take place at very low temperatures (Mokvist et al. 2014).
Localization of the electron hole on ChlD1 is not an ideal
situation since recombination from the acceptor side ChlD1+
QA− is faster and efficiently quenches productive charge
sep-aration. On the other hand, TyrZ is still in the close distance
to both ChlD1 and PD1 to have an efficient donation in the
centers where ChlD1+ is still available. Moreover, at
physi-ological temperatures, as soon as ChlD1 loses an electron, the hole can migrate to the neighboring PD1 and PD2. After
the hole jumps on PD1, the localization of the hole on PD1 or
PD2 becomes a very random process. This why at high pH direct oxidation of TyrD by P680+ (via P
D2+ as was suggested
by Faller et al. 2001) is possible at least in part of the PS II centers under the far-red light illumination.
Thus, our results indicate that in the Mn-depleted PS II at room temperature the primary charge separation pathway under the far-red excitation occurs via ChlD1+ PheD1−
pri-mary pair, similar to what was reported for the active PS II at ultra-low temperature (Mokvist et al. 2014). The question if the same reaction occurs in the active PS II under physi-ological conditions requires further investigations.
Acknowledgements The Swedish Research Council is gratefully
acknowledged for the financial support. NA further acknowledges the State Oil Fund of Azerbaijan for a PhD research stipend.
Open Access This article is distributed under the terms of the
Creative Commons Attribution 4.0 International License (http://crea-tivecommons.org/licenses/by/4.0/), which permits unrestricted use, distribution, and reproduction in any medium, provided you give appro-priate credit to the original author(s) and the source, provide a link to the Creative Commons license, and indicate if changes were made.
References
Ahmadova N, Ho FM, Styring S, Mamedov F (2017) Tyrozine D oxida-tion and redox equilibrium in photosystem II. Biochim Biophys Acta 1858(6):407–417. doi:10.1016/j.bbabio.2017.02.011 Babcock GT, Sauer K (1973) Electron paramagnetic resonance
sig-nal II in spinach-chloroplast. 1. Kinetic asig-nalysis for untreated chloroplasts. Biochim Biophys Acta 325(3):483–503. doi:10.1016/0005-2728(73)90209-0
Babcock GT, Sauer K (1975a) A rapid, light-induced transient in electron paramagnetic resonance signal II activated upon inhibi-tion of photosynthetic oxygen evoluinhibi-tion. Biochim Biophys Acta 376(2):315–328. doi:10.1016/0005-2728(75)90024-9
Babcock GT, Sauer K (1975b) Two electron donation sites for exog-enous reductants in chloroplast photosystem II. Biochim Biophys Acta 396(1):48–62. doi:10.1016/0005-2728(75)90188-7 Barber J (2016) Photosystem II: the water splitting enzyme of
photo-synthesis and the origin of oxygen in our atmosphere. Quart Rev Biophys 49:1–20. doi:10.1017/s0033583516000093
Berthold DA, Babcock GT, Yocum CF (1981) A highly resolved, oxy-gen-evolving photosystem II preparation from spinach thylakoid membranes: EPR and electron-transport properties. Febs Lett 134(2):231–234. doi:10.1016/0014-5793(81)80608-4
Bishop NI, Spikes JD (1955) Inhibition by cyanide of the photochemi-cal activity of isolated chloroplasts. Nature 176(4476):307–308 Boska M, Sauer K, Buttner W, Babcock GT (1983) Similarity of
electron paramagnetic resonance Signal IIf rise and P680+ decay kinetics in Tris-washed chloroplast photosystem II preparations as a function of pH. Biochim Biophys Acta 722(2):327–330. doi:10.1016/0005-2728(83)90080-4
Boussac A, Etienne A-L (1982a) Spectral and kinetic pH-dependence of fast and slow signal II in tris-washed chloroplasts. FEBS Lett 148(1):113–116. doi:10.1016/0014-5793(82)81254-4
Boussac A, Etienne AL (1982b) Heterogeneity of system II secondary electron acceptors in tris-washed chloroplasts. Biochim Biophys Acta 682(2):281–288. doi:10.1016/0005-2728(82)90109-8 Boussac A, Etienne AL (1982c) Oxido-reduction kinetics of signal II
slow in tris-washed chloroplasts. Biochem Biophys Res Commun 109(4):1200–1205. doi:10.1016/0006-291x(82)91904-0 Boussac A, Etienne AL (1984) Midpoint potential of signal II (slow)
in tris-washed photosystem-II particles. Biochim Biophys Acta 766(3):576–581. doi:10.1016/0005-2728(84)90117-8
Brettel K, Schlodder E, Witt HT (1984) Nanosecond reduction kinet-ics of photooxidized chlorophyll-aII (P-680) in single flashes as a probe for the electron pathway, H+-release and charge accu-mulation in the O2-evolving complex. Biochim Biophys Acta 766(2):403–415. doi:10.1016/0005-2728(84)90256-1
Bricker TM, Roose JL, Fagerlund RD, Frankel LK, Eaton-Rye JJ (2012) The extrinsic proteins of photosystem II. Biochim Bio-phys Acta 1817(1):121–142. doi:10.1016/j.bbabio.2011.07.006 Buser CA, Thompson LK, Diner BA, Brudvig GW (1990) Electron
transfer reactions in manganese-depleted Photosystem II. Bio-chemistry 29:8977–8985
Cardona T, Sedoud A, Cox N, Rutherford AW (2012) Charge sepa-ration in photosystem II: a comparative and evolutionary over-view. Biochim Biophys Acta 1817(1):26–43. doi:10.1016/j. bbabio.2011.07.012
Danielsson R, Suorsa M, Paakkarinen V, Albertsson PA, Styring S, Aro EM, Mamedov F (2006) Dimeric and monomeric organiza-tion of photosystem II - Distribuorganiza-tion of five distinct complexes in the different domains of the thylakoid membrane. J Biol Chem 281(20):14241–14249. doi:10.1074/jbc.M600634200
Debus RJ, Barry BA, Babcock GT, McIntosh L (1988) Site-directed mutagenesis identifies a tyrosine radical involved in the pho-tosynthetic oxygen-evolving system. Proc Natl Acad Sci USA 85(2):427–430
Delrieu M-J, Rosengard F (1989) Interaction of erogenous qui-nones with photosystem II in inside-out thylakoids. FEBS Lett 251(1):161–166. doi:10.1016/0014-5793(89)81447-4
Diner BA, Rappaport F (2002) Structure, dynamics, and energetics of the primary photochemistry of photosystem II of oxygenic photo-synthesis. Annu Rev Plant Biol 53:551–580. doi:10.1146/annurev. arplant.53.100301.135238
Diner BA, Schlodder E, Nixon PJ, Coleman WJ, Rappaport F, Lavergne J, Vermaas WFJ, Chisholm DA (2001) Site-directed mutations at D1-His198 and D2-His197 of photosystem II in synechocystis PCC 6803: sites of primary charge separation and cation and tri-plet stabilization. Biochemistry 40(31):9265–9281. doi:10.1021/ bi010121r
Faller P, Debus RJ, Brettel K, Sugiura M, Rutherford AW, Boussac A (2001) Rapid formation of the stable tyrosyl radical in pho-tosystem II. Proc Natl Acad Sci USA 98(25):14368–14373. doi:10.1073/pnas.251382598
Faller P, Rutherford AW, Debus RJ (2002) Tyrosine D oxidation at cryogenic temperature in photosystem II. Biochemistry 41(43):12914–12920. doi:10.1021/bi026588z
Ferreira KN, Iverson TM, Maghlaoui K, Barber J, Iwata S (2004) Architecture of the photosynthetic oxygen-evolving center. Sci-ence 303(5665):1831–1838. doi:10.1126/sciSci-ence.1093087 Gadjieva R, Mamedov F, Renger G, Styring S (1999) Interconversion
of low- and high-potential forms of cytochrome b(559) in tris-washed photosystem II membranes under aerobic and anaerobic conditions. Biochemistry 38(32):10578–10584. doi:10.1021/ bi9904656
Grabolle M, Dau H (2005) Energetics of primary and secondary electron transfer in photosystem II membrane particles of spin-ach revisited on basis of recombination-fluorescence measure-ments. Biochim Biophys Acta 1708(2):209–218. doi:10.1016/j. bbabio.2005.03.007
Groot ML, Pawlowicz NP, van Wilderen LJGW, Breton J, van Stok-kum IHM, van Grondelle R (2005) Initial electron donor and acceptor in isolated photosystem II reaction centers identified with femtosecond mid-IR spectroscopy. Proc Natl Acad Sci USA 102(37):13087–13092. doi:10.1073/pnas.0503483102
Hanley J, Deligiannakis Y, Pascal A, Faller P, Rutherford AW (1999) Carotenoid oxidation in photosystem II. Biochemistry 38(26):8189–8195. doi:10.1021/bi990633u
Hillmann B, Brettel K, van Mieghem F, Kamlowski A, Rutherford AW, Schlodder E (1995) Charge recombination reactions in photosystem II. 2. Transient absorbance difference spectra and their temperature dependence. Biochemistry 34(14):4814–4827. doi:10.1021/bi00014a039
Holzwarth AR, Müller MG, Reus M, Nowaczyk M, Sander J, Rögner M (2006) Kinetics and mechanism of electron transfer in intact photosystem II and in the isolated reaction center: Pheophytin is the primary electron acceptor. Proc Natl Acad Sci 103(18):6895– 6900. doi:10.1073/pnas.0505371103
Hughes JL, Smith P, Pace R, Krausz E (2006) Charge separation in photosystem II core complexes induced by 690–730 nm excitation at 1.7 K. Biochim Biophys Acta 1757(7):841–851. doi:10.1016/j. bbabio.2006.05.035
Kern J, Renger G (2007) Photosystem II: structure and mechanism of the water: plastoquinone oxidoreductase. Photosyn Res 94(2– 3):183–202. doi:10.1007/s11120-007-9201-1
Mamedov F, Gadjieva R, Styring S (2007) Oxygen-induced changes in the redox state of the cytochrome b559 in photosystem II depend on the integrity of the Mn cluster. Physiol Plant 131(1):41–49 Mokvist F, Sjöholm J, Mamedov F, Styring S (2014) The
photochem-istry in photosystem II at 5 K is different in visible and far-red light. Biochemistry 53(26):4228–4238. doi:10.1021/bi5006392 Novoderezhkin VI, Croce R, Wahadoszamen M, Polukhina I, Romero
E, van Grondelle R (2016) Mixing of exciton and charge-transfer states in light-harvesting complex Lhca4. Phys Chem Chem Phys 18(28):19368–19377. doi:10.1039/C6CP02225A
Rappaport F, Diner BA (2008) Primary photochemistry and energetics leading to the oxidation of the (Mn)4Ca cluster and to the evolu-tion of molecular oxygen in photosystem II. Coord Chem Rev 252(3–4):259–272. doi:10.1016/j.ccr.2007.07.016
Rappaport F, Guergova-Kuras M, Nixon PJ, Diner BA, Lavergne J (2002) Kinetics and pathways of charge recombination in photo-system II. Biochemistry 41:8518–8527
Raszewski G, Saenger W, Renger T (2005) Theory of optical spectra of photosystem II reaction centers: location of the triplet state and the identity of the primary electron donor. Biophys J 88(2):986– 998. doi:10.1529/biophysj.104.050294
Raszewski G, Diner BA, Schlodder E, Renger T (2008) Spectroscopic properties of reaction center pigments in photosystem II core com-plexes: revision of the multimer model. Biophys J 95(1):105–119. doi:10.1529/biophysj.107.123935
Renger G (2012) Mechanism of light induced water splitting in photosystem II of oxygen evolving photosynthetic organisms. Biochim Biophys Acta 1817(8):1164–1176. doi:10.1016/j. bbabio.2012.02.005
Reimers JR, Biczysko M, Bruce D, Coker DF, Frankcombe TJ, Hashi-moto H, Hauer J, Jankowiak R, Kramer T, Linnanto J, Mamedov F, Müh F, Rätsep M, Renger T, Styring S, Wan J, Wang Z, Wang-Otomo Z-Y, Weng Y-X, Yang C, Zhang J-P, Freiberg A, Krausz E (2016) Challenges facing an understanding of the nature of low-energy excited states in photosynthesis. Biochim Biophys Acta 1857(9):1627–1640
Renger G, Renger T (2008) Photosystem II: the machinery of pho-tosynthetic water splitting. Photosynth Res 98(1–3):53–80. doi:10.1007/s11120-008-9345-7
Roffey RA, van Wijk KJ, Sayre RT, Styring S (1994) Spectroscopic characterization of tyrosine-Z in histidine 190 mutants of the D1 protein in photosystem II (PS II) in Chlamydomonas reinhardtii. Implications for the structural model of the donor side of PS II. J Biol Chem 269(7):5115–5121
Romero E, van Stokkum IHM, Novoderezhkin VI, Dekker JP, van Grondelle R (2010) Two different charge separation pathways in photosystem II. Biochemistry 49(20):4300–4307. doi:10.1021/ bi1003926
Romero E, Diner BA, Nixon PJ, Coleman WJ, Dekker JP, van Gron-delle R (2012) Mixed exciton–charge-transfer states in photosys-tem II: stark spectroscopy on site-directed mutants. Biophys J 103(2):185–194. doi:10.1016/j.bpj.2012.06.026
Saito K, Rutherford AW, Ishikita H (2013) Mechanism of tyros-ine D oxidation in photosystem II. Proc Natl Acad Sci USA 110(19):7690–7695. doi:10.1073/pnas.1300817110
Schlodder E, Coleman WJ, Nixon PJ, Cohen RO, Renger T, Diner BA (2008a) Site-directed mutations at D1-His198 and D1-Thr179 of photosystem II in Synechocystis sp. PCC 6803: deciphering the spectral properties of the PS II reaction centre. Philos Trans 363(1494):1197–1202
Schlodder E, Renger T, Raszewski G, Coleman WJ, Nixon PJ, Cohen RO, Diner BA (2008b) Site-directed mutations at D1-Thr179 of photosystem II in Synechocystis sp. PCC 6803 modify the spectro-scopic properties of the accessory chlorophyll in the D1-branch of the reaction center. Biochemistry 47(10):3143–3154. doi:10.1021/ bi702059f
Shigemori K, Mino H, Kawamori A (1997) pH and temperature dependence of tyrosine Z¨ decay kinetics in tris-treated PS II parti-cles studied by time-resolved EPR. Plant Cell Physiol 38(9):1007– 1011. doi:10.1093/oxfordjournals.pcp.a029264
Sjöholm J, Ho FM, Ahmadova N, Brinkert K, Hammarström L, Mame-dov F, Styring S (2016) The protonation state around TyrD/TyrD· in photosystem II is reflected in its biphasic oxidation kinetics. Biochim Biophys Acta 1858:147–155
Styring S, Rutherford AW (1987) In the oxygen evolving complex of photosystem II the S0 state is oxidized to the S1 state by D+ (signal II slow). Biochemistry 26(9):2401–2405. doi:10.1021/ bi00383a001
Styring S, Sjöholm J, Mamedov F (2012) Two tyrosines that changed the world: interfacing the oxidizing power of photochemis-try to water splitting in photosystem II. Biochim Biophys Acta 1817:76–87
Suga M, Akita F, Hirata K, Ueno G, Murakami H, Nakajima Y, Shimizu T, Yamashita K, Yamamoto M, Ago H, Shen JR (2015) Native structure of photosystem II at 1.95 Å resolution viewed by femtosecond X-ray pulses. Nature 517(7532):99–U265. doi:10.1038/nature13991
Thapper A, Mamedov F, Mokvist F, Hammarström L, Styring S (2009) Defining the far-red limit of photosystem II in spinach. Plant Cell 21(8):2391–2401. doi:10.1105/tpc.108.064154
Umena Y, Kawakami K, Shen JR, Kamiya N (2011) Crystal structure of oxygen-evolving photosystem II at a resolution of 1.9 Å. Nature 473(7345):55–U65. doi:10.1038/nature09913
Vass I, Styring S (1991) pH-dependent charge equilibria between tyros-ine-D and the S states in photosystem II. Estimation of relative midpoint redox potentials. Biochemistry 30:830–839
Vinyard DJ, Ananyev GM, Dismukes GC (2013) Photosystem II: the reaction center of oxygenic photosynthesis. In: Kornberg RD (ed) Annual review of biochemistry, vol 82. Annual Reviews, Palo Alto, pp 577–606. doi:10.1146/annurev-biochem-070511-100425 Visser JWM, Rijgersberg CP, Gast P (1977) Photooxidation of chlo-rophyll in spinach chloroplasts between 10 and 180 K. Biochim Biophys Acta 460(1):36–46. doi:10.1016/0005-2728(77)90149-9 Völker M, Ono T, Inoue Y, Renger G (1985) Effect of trypsin on PSII
particles: correlation between Hill-activity, Mn-abundance and peptide pattern. Biochim Biophys Acta 806:25–34
Wei X, Su X, Cao P, Liu X, Chang W, Li M, Zhang X, Liu Z (2016) Structure of spinach photosystem II–LHCII supercomplex at 3.2 Å resolution. Nature 534 (7605):69–74. doi:10.1038/ nature18020. http://www.nature.com/nature/journal/v534/n7605/ abs/nature18020.html#supplementary-information
Yerkes CT, Babcock GT (1980) Photosystem II oxidation of charged electron donors. Surface charge effects. Biochim Biophys Acta 590(3):360–372. doi:10.1016/0005-2728(80)90207-8
Zech SG, Kurreck J, Eckert H-J, Renger G, Lubitz W, Bittl R (1997) Pulsed EPR measurement of the distance between P680+ and QA− in photosystem II. FEBS Lett 414(2):454–456. doi:10.1016/ S0014-5793(97)01054-5