I
C
ONTEXT
S
ENSITIVE
T
RANSFORMATION
OF
G
EOGRAPHIC
I
NFORMATION
II
Context sensitive transformation of geographic information Ola Ahlqvist
Department of Physical Geography Stockholm University
ISSN 1104-7208 ISBN 91-7265-213-6 © Ola Ahlqvist 2000
Cover figure: Aspects of semantic uncertainty in a multiuser context
Mailing address:
Department of Physical Geography Stockholm University
S-10691 Stockholm Sweden
Visiting address:
Svante Arrhenius väg 8 Telephone:+46-8-162000 Facsimile: +46-8-164818
III
ABSTRACT
This research is concerned with theoretical and methodological aspects of geographic information transformation between different user contexts. In this dissertation I present theories and methodological approaches that enable a context sensititve use and reuse of geographic data in geographic information systems.
A primary motive for the reported research is that the patrons interested in answering environmental questions have increased in number and been diversified during the last 10-15 years. The interest from international, national and regional authorities together with multinational and national corporations embrace a range of spatial and temporal scales from global to local, and from many-year/-decade perspectives to real time applications. These differences in spatial and temporal detail will be expressed as rather different questions towards existing data. It is expected that geographic information systems will be able to integrate a large number of diverse data to answer current and future geographic questions and support spatial decision processes. However, there are still important deficiencies in contemporary theories and methods for geographic information integration
Literature studies and preliminary experiments suggested that any transformation between different users’ contexts would change either the thematic, spatial or temporal detail, and the result would include some amount of semantic uncertainty. Consequently, the reported experiments are separated into studies of change in either spatial or thematic detail. The scope concerned with thematic detatil searched for approaches to represent indiscernibility between categories, and the scope concerned with spatial detail studied semantic effects caused by changing spatial granularity.
The findings make several contributions to the current knowledge about transforming geographic information between users’ contexts. When changing the categorical resolution of a geographic dataset, it is possible to represent cases of indiscernibility using novel methods of rough classification described in the thesis. The use of rough classification methods together with manual landscape interpretations made it possible to evaluate semantic uncertainty in geographic data. Such evaluations of spatially aggregated geographic data sets show both predictable and non-predictable effects. and these effects may vary for different environmental variables.
Development of methods that integrate crisp, fuzzy and rough data enables spatial decision support systems to consider various aspects of semantic uncertainty. By explicitly representing crisp, fuzzy and rough relations between datasets, a deeper semantic meaning is given to geographic databasses. The explicit representation of semantic relations is called a Geographic Concept Topology and is held as a viable tool for context transformation and full integration of geographic datasets.
Key words:Geographic information, geographic context, semantic models, conceptual models, interoperability, uncertainty, scale, classification , rough sets, fuzzy sets, decision support, uncertainty
V
ACKNOWLEDGEMENTS
Apart from the support granted through the Department of Physical Geography at Stockholm University, this research was made possible by funding from the Swedish Council of Building Research (BFR), the Swedish Board for Co-ordination of Research (FRN), the Swedish Board for Engineering Sciences (TFR), the Swedish Board for Technological and Industrial Development (NUTEK), the Swedish Board for Communications Research (KFB) and the Swedish Defense Research Establishment (FOA) through the Centre for Geoinformatics, Stockholm. Additional funding from Knut and Alice Wallenberg's foundation through the Sweden-America foundation and from Lillemor and Hans W:son Ahlmanns fund for Geographic research made possible my fellowship at NCGIA, University of California Santa Barbara, during the final year of this project.
Personally, I would like to thank my supervisor, ass. Prof. Wolter Arnberg. His never ending enthusiasm, his sharp intellect and him being at least ten years ahead of mainstream geographic information science has meant a lot to my work on this thesis.
Rolf Ruben has also been a companion and discussion partner throughout this work and I owe him a lot for his concern for important details and all the interesting data he has provided for this treatise. I also want to thank Ivonne Anders, Jonas Lind, and Sabine Aflerbach for helping me with some of the figures and maps. To all staff, faculty and students who courteously hosted my 11-month visit at the National Center for Geographic Information & Analysis, Santa Barbara I direct my deepest thanks. I especially want to thank Prof. Mike Goodchild, LaNell Lucius, Abby Caschetta, Christian Brown, and Sum Huynh for your invaluable help.
To my loving parents Sture and Vera, I owe more then can be expressed by words, thank you for everything. Finally to my family, my beautiful wife Åsa, and our wonderful sons, Mathias, Jakob and Isak. You are the center of my universe.
VII Contents
CONTEXT SENSITIVE TRANSFORMATION OF GEOGRAPHIC INFORMATION ...I ABSTRACT... III ACKNOWLEDGEMENTS ... V
1. FRAMEWORK AND OBJECTIVES... 1
Introduction... 1
Framework... 1
Scope ... 2
Objectives ... 2
Approach and thesis structure... 2
Expected scientific contribution... 3
2. ENVIRONMENTAL MANAGEMENT AND INFORMATION SOURCES ...
5
An applied perspective... 5
Models of the real world ... 6
Real world models and Geography... 8
Real world models and geographic information systems... 11
3. DETAIL IN GEOGRAPHIC INFORMATION MODELS ... 17
Quality – Detail, Granularity, Accuracy, Fitness-for-use and Uncertainty ... 17
Spatial granularity... 20
Temporal granularity ... 23
Categorical granularity... 24
Knowledge representation and uncertainty... 27
A geographical concept topology ... 29
4. DISCRETE METHODS FOR INTERPRETATION OF LANDSCAPE INFORMATION... 33
Introduction... 33
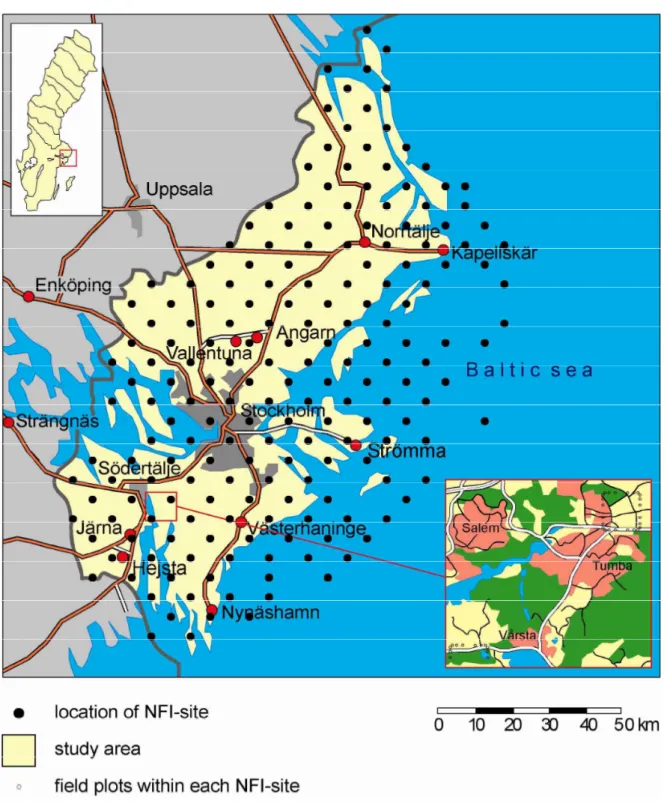
Description of the study area ... 35
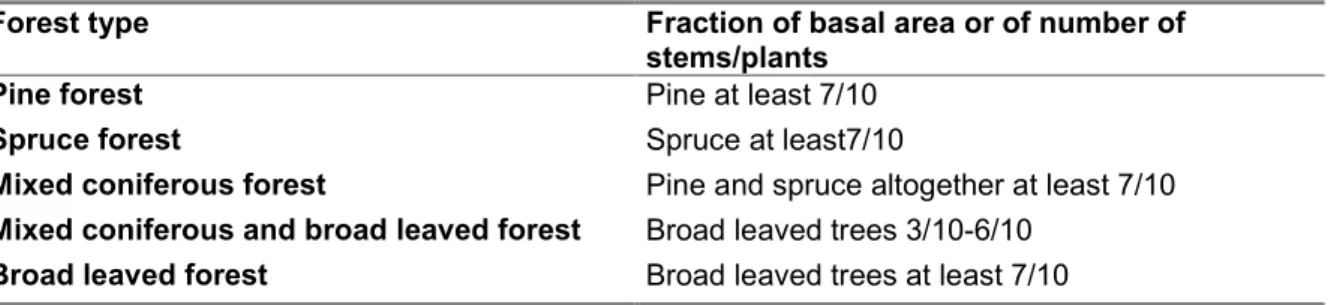
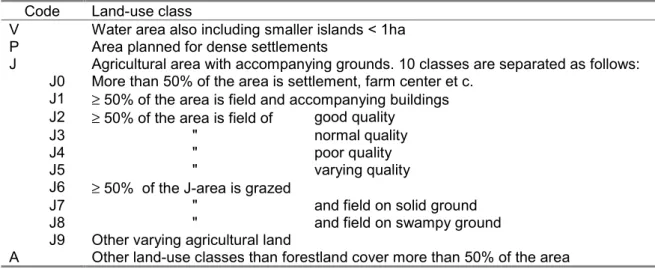
The National Forest Inventory ... 37
Material and methods – the R-method ... 38
Results – R-data ... 50
Material and methods – Structural data; classification of economic map sheets according to landscape type ... 53
Results – Structural data ... 55
Discussion and conclusions ... 55
5. PILOT STUDIES... 63
Introduction... 63
Pilot study 1 ... 63
Pilot study 2 ... 71
Overall discussion and conclusions ... 73
Acknowledgements... 74
6. ROUGH CLASSIFICATION AND ACCURACY ASSESSMENT ... 75
Introduction... 75
7. ESTIMATING SEMANTIC UNCERTAINTY IN LAND COVER CLASSIFICATIONS ... 99
Introduction... 99
Experimental design: Conceptual discussion... 99
Methods ... 100
Results... 111
VIII
8. CRISP, FUZZY AND ROUGH DECISION SUPPORT IN GIS... 121
Introduction ... 121
Method development ... 122
Experiment ... 123
Discussion and conclusions ... 130
9. CONCLUSIONS... 135
Summary of findings and objective fulfillment... 135
Conclusions ... 136
Framework and objectives • 1
F
RAMEWORK AND OBJECTIVES
Our truth is the intersection of independent lies.
RICHARD LEVINS
Introduction
Current decision making with an expanding amount of information to take into consideration calls for an effective information service. The development of computer technology has implied considerable changes of work routines as well as an improved efficiency in a number of sectors. Computerized systems have the ability to handle large sets of information, which could assist the mental, human parts in completing the decision process. Future systems for decision support are expected to give quick overviews and extract necessary information based on questions, available facts and other considerations given. This would give the opportunity to concentrate the human resources on the overall visions and decisions.
A computerized treatment of geographic datasets is today made possible through commercial Geographic Information System-packages. The use of these software is however hampered by lack of information on data quality, the functions and processes included in the data and relations between the data. Variations in temporal and spatial scale are another major bottleneck when trying to integrate different data in a Geographic Information System.
One of the reasons why all these obstacles emerge when using a Geographic Information System is that the potential sources of information are so diverse. Given a certain location we may have to deal with material from a detailed level up towards highly generalized levels of information, each developed for a specific purpose and assembled in different ways. The use of Geographic Information System as a tool to handle all this data has been suggested for some time now.
The theoretical base for how to treat highly diverse data properly in an integrated fashion has not been developed as quickly as the technical tools available. In geography there is no such thing as a single representation of the world that incorporates every possible viewpoint. This is of
fundamental importance and must be considered when we organize spatial data for integrated use in a Geographic Information System
From efforts to integrate geographic datasets in analyses from local to global scales, in which generalization constitutes one important process, we may conclude that we still lack a firm theoretical and methodological basis for this process (Wilkinson, 1998; Devogele et al., 1998; Thomlinson et al., 1998; Van Beurden and Douven, 1999). Increasing amounts of available data at increasingly better levels of detail give us theoretically an almost infinite possibility to choose at what spatial, temporal and thematic resolution we perform geographic analysis. This is a fairly recent turn into a data rich situation where each implementation raises some important questions.
The problem outlined above, indicates a substantial gap between geography and contemporary use of geographic information systems. This is used as an outset for this thesis.
Framework
This thesis project was initiated through the Swedish Centre for Geoinformatics as one of seven research foci carried out as PhD-student projects. The original title of this project was "Knowledge based digitisation of thematic maps”. This title wanted to emphasise that map reading is an intellectual process and as such would require a context-sensitive digitisation for further use as information in a Geographic Information System. The main goal of the project was formulated: “…to find a model how to digitise map symbols together with the mapping model so that the context can be exploited in a GIS.” An alternative interpretation of this goal is to look for an inverse to the mapping process in order to achieve more effective reuse of data in different situations.
As a PhD-student I was given relatively free hands to interpret this project focus into a research plan according to my own understanding of the problem. Coming from six years of professional practice within local and regional Chapter
2 • Framework and objectives
environmental planning and management, I naturally projected the research question onto these experiences. Together with my supervisor, ass. Prof. Wolter Arnberg, I also developed several contacts with other researchers and one of the more imortant ones has been the involvement in the “Sustainable Landscapes” project.
The Swedish research program Remote Sensing for the Environment (RESE) has highlighted the landscape perspective in the project “Sustainable Landscapes”. In landscape studies a major concern is to integrate variables that depict structure and composition as well as operative processes within the landscape. As such the landscape as it is treated by the “Sustainable Landscapes” project seemed to provide a suitable testbed for the development of a conceptual model for geographic information handling. This dissertation may not show any concrete evidence from this collaboration but many of the discussions and work by other members within this group have certainly influenced my work.
Scope
This research is concerned with theoretical and methodological aspects of geographic information transformation between different contexts. My own academic and professional experience has affected this scope in two important ways:
1. Examples and discussions are restricted to certain parts of biology and earth sciences, mainly within the realm of ecological geography and landscape ecology.
2. The research questions are formulated from an application oriented view, emanating from my own experience of current practice in regional and local environmental management.
Thus, worked examples mainly concern information with relevance to managerial issues of nature conservation, such as the local implementation of global conventions on for example biodiversity (UNEP, 1992) and sustainable development (WCED, 1987). Tests uses information from vegetation maps, scalar, ordinal and categorical variables interpreted from maps and aerial images, and continuous data from digital elevation models. Findings are expected to be applicable to situations where any sort of categorization is applied to geographic data.
Objectives
The main goal of this study is to enable a context sensitive use and reuse of geographic data. In
other words to make it possible to organize geographical information of different origin in such a way that this information can be used at other levels of scale and detail and in other contexts than those used to assemble the information. To reach this general goal it has been broken down into a handful of objectives toward which focused efforts have been directed:
• To review both theoretical and methodological aspects of integrating geographic data.
• To identify important deficiencies or gaps in contemporary theories and/or methods for geographic data integration.
• To identify approaches that consider geographic context information.
• To suggest a feasible solution to support a context sensitive use of existing geographic data.
• To demonstrate an application of a context sensitive integration of geographic data. These objectives are to be interpreted within a framework of computerized geographic analysis. An important outset is the current ambition of geographic information science that tries to integrate geography, philosophy, physics and mathematics with the realms of cognitive and sociocultural sciences (Couclelis, 1999). Located within an admittedly complex intersection of separate sciences this work does not try to develop the general theory of spatiotemporal phenomena. I do however detail some important means of improving methods for transfer of geographic information between different user contexts.
Approach and thesis structure
The dissertation is divided into several chapters each addressing one or several of the research objectives. The chapter organization intends to lead the reader through a logical order of argumentation and findings.
This first chapter provides an overall introduction to the problem as well as the background for the study. It also intends to define the limits of the presented research and to give a general overview of the thesis.
To address the main goal of this dissertation I recognized early in my preliminary studies the problems that multiple world views will impose on any change of spatial or categorical detail or any effort to translate information from one context into another. These preliminaries are
Framework and objectives • 3 mainly articulated in chapter 2 and 3, which
describe some of the problems associated with a computer-assisted analysis of geographic information. Chapter 4 and 5 were also part of the preliminary studies. The suite of chapters from 2 through 5 has been revised later on, and especially chapters 2 and 3 have been continuously updated during the entirety of this project.
Early in my work with this dissertation I also had to formulate an experimental design that was suitable for investigating transformation between different user’s contexts. From the preliminary studies it seemed reasonable to assume that any such transformation would either change the thematic, spatial or temporal detail. I consequently decided to perform experiments on data that could isolate effects caused by either change in spatial or thematic detail. The limited amount of previous research on temporal aspects as well as the limitations in time for a dissertation led to a very restricted treatment of this dimension in my studies.
The continued preliminary work included data assemblage and two case studies presented in chapters 4 and 5. The findings from these studies both confirmed that the general experimental design gave interesting results and they also called for a methodology to handle categorical uncertainty. The continued studies therefore followed two parallel trails. One concerned with categorical detatil that searches for approaches to represent indiscernibility between categories, reported in chapter 6, and one concerned with further studies of effects caused by changing spatial detail, reported in chapter 7. Finally, in chapter 8, I pull together the initial discussions from chapters 2 and 3 with some of my experimental results to demonstrate a combination of map algebra with different extensions of set theories to define semantically certain, graded and indiscernible relations between geographic concepts.
Expected scientific contribution
I hold the most important contribution of this dissertation to be the Geographic Concept Topology construction. This is theoretically established in chapter 3 and demonstrated in chapter 8. Although still unverified in a wider setting, I claim that this structure enables an explicit representation of semantic relations for geographic concepts. In addition I propose that a Geographic Concept Topology can be used as a
primary tool for a context sensitive transformation of geographic information. The Geographic Concept Topology acknowledges that different spatial representations may be used in concert and it is capable of handling important aspects of semantic uncertainty simultaneously. Still, the feasibility of the Geographic Concept Topology framework remains to be tested in a wider practical situation with large amounts of diverse, real data.
Furthermore, the Geographic Concept Topology serves as a first suggestion to formalize the due process and boundary object ideas first proposed by Star (1989) and introduced to the wider geographic decision and planning community by Harvey and Chrisman (1999). These notions are fully explained in chapters 2 and 3 but the actual achievement is the connection with the Geographic Concept Topology construct, as a concrete example of the ideas of “due process” and “boundary objects”.
Geographic information science has only recently directed its interest towards the full suite of uncertainty aspects possible in geographic information. Among the least researched parts are uncertainty related to poorly defined objects or concepts, yet these are very common in the geographic discipline (Fisher, 1999). I view the research reported in chapters 6 and 8 as important theoretical foundations for further development of general considerations of imprecision in geographic information.
These findings and the experimental design in chapter 7 enabled the investigation of various aspects of semantic accuracy in a geographic data set. These aspects have only recently been acknowledged and so far a very limited amount of research on appropriate methods for measuring semantic quality aspects of geographic data has been conducted. In chapter 7 I describe a test design that uses manual interpretations at different resolutions. This design makes it possible to detect generalization effects other than purely statistical, and this has recently been acknowledged to be a neglected and problematic part of a quality report for geographic data (Weibel and Dutton, 1999).
Environmental management and information sources• 5
E
NVIRONMENTAL MANAGEMENT AND
INFORMATION SOURCES
Uncertainty sends the brave on the trail of discovery and the coward on the route of the herd.
DARTWILL AQUILA, http://www.bentarz.se/me/dartwill.htm
An applied perspective
During the last 10 years or so the concept of spatial decision support systems (SDSS) has evolved to improve the performance of decision makers and managers when they confront semi structured spatial decision problems (Malczewski, 1999, p.277). Still the application of computerized geographical analysis is to many people an overwhelming task. Given a local authority, the department responsible for natural conservation may wish to use the information produced by some other department. Or it may even want to compare a new survey with an older one to identify changes in the vegetation. Besides problems of getting data to match into the geographic information system currently used by the department some profound questions will be articulated sooner or later. At what scale can we use this information? Do we need to perform some kind of generalization on these data? And if so, what generalization method should we use? And how accurate is the result? Some of these questions have been tackled to some extent but sufficient knowledge is still lacking to be able to recommend a standardized set of methods. Notably the issue of reliability or quality has received some well-deserved attention lately. One requirement is of course to minimize the error in the final output, but from an informational viewpoint we also need to make sure that the information is carried through the analysis process without being distorted in terms of the semantic content, the meaning of the data.
In the beginning of the work I came from an applied environment. Following my undergraduate education I was employed by the Åland Landskapsstyrelse, office for regional planning, to develop an environmental database with geographic references. The database was developed using the PC-network based Paradox
software with loose coupling to a custom graphics software. The main issues were database design and integration of information from separate offices within the administration. This work gave me a thorough introduction into the problems of information sharing, database development, geographic data types and programming of user interfaces. Also the problems related to homogenization and integration of data from different users became evident to me.
Following this employment I held a substitute position as ecologist within the municipal administration of Järfälla, located just northwest of Stockholm. My main duties were the management of natural areas owned by the municipality and the management of two larger natural reserves. This also included management of the forest resources within the natural areas. I also had responsibility for nature conservation issues within the local planning process. In this I participated in the development of new management plans for the nature reserves as well as a municipality-wide water management plan. Much work was performed using traditional cartographic techniques and it included development of new cartographic products as part of geographic analyses and presentations.
The projects I have been involved in often required the production of a map of some kind depicting a situation of interest. One report wanted to define and delineate ecologically sensitive areas; another report included suggested areas for water conservation and protection purposes. Each report reflected a specific purpose and a specific question.
The title of this PhD project was in the beginning “knowledge based digitization of geographical information”. The idea was to see if maps and other existing data could be digitized into a computer using the knowledge of skilled experts to enrich the database with some ‘extra’ Chapter
6 • Environmental management and information sources information that made it possible to access these data for other purposes, to answer new questions than those used at the time of collecting this information.
I started out to try to compare my own exam-work from my undergraduate studies, a vegetation map (Ahlqvist and Wiborn, 1992), with another vegetation map collected over the same area 15 years earlier (Edberg, 1971). I found not only geometrical deviations, but also a large difference in classification systems, which specifically caught my attention. Could these two maps ever be used to answer the question if the vegetation had changed during this period? This question turned out to be a very researchable one, and the work with this dissertation finally landed in a study of translating the classification system of the new map into the old map producing two semantically similar maps (chapter 8). How similar they are is still a question, but the general idea to convert information from one context background into another has wide applications.
This and the next chapter will outline some general factors influencing the process of transforming geographic phenomena, or things “out there”, into computer representations. First of all I will treat the issue of how models of the real world may be constructed as a way to describe and understand the world that surrounds us. This review of previous research will almost immediately acknowledge the second factor, which is the importance of the user context or the purpose behind the construction of a certain model. The third factor, the mode of observation acts as a kind of mediator between the other two. The mode of observation articulates the observational detail or granularity, which is directly related to the detail of the knowledge, and it also includes aspects of uncertainty in the observation. This outline parallels work by Couclelis (1996) who sketched a similar division between factors that are in part responsible for how we choose to create a computer representation of a geographic entity. Toward the end of chapter 3 the discussion has both summarized previous research as well as the findings in this dissertation. At that point the requirements for a context sensitive transformation of imprecise geographical data have been articulated together with some suggested solutions to these requirements. This is then finally brought into the proposed Geographical Concept Topology framework
capable of supporting a context sensitive use and reuse of existing geographic data
Models of the real world
How to understand the real world has been an issue ever since the development of life on earth but from a shorter history-of-science perspective it seems to be a matter of “faith”. When scientists try to make models of the real world they have different ‘models’ or perceptions of the real world, different ‘world views’. At a very broad level Johnston (1999) list three types of science models, or “faiths” – empirical, hermeneutic and critical – that may be separated into a multitude of separate approaches with their own detailed exemplars, paradigm instances of how science should be done.
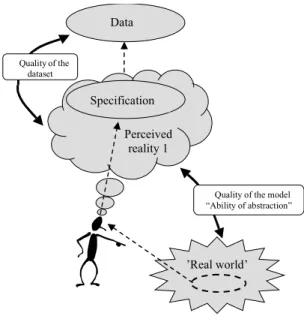
The simplified illustration in Figure 1 is an attempt to illustrate the relation between the real world, our perception of this as perceived reality, and the specification that ultimately leads to a data representation of the real world. From the geographic literature it could be assumed that ‘perceived reality’ or ‘abstract view of the universe’ (Salgé, 1995, David et al. 1996, Mark and Frank, 1996) is formed through some kind of understanding or modeling within the human mind. Also, a separation can be distinguished between a) a perceived reality which is inherently virtual, represented by human knowledge structures and b) a conceptual and logical specification which can be used to collect data into a database and which is somehow a subset of the perceived reality. The perceived reality might also be termed ‘world view’. Since certain parts of every individual worldview are shared - both cognitive and bodily - with other individuals, some authors suggest that this overlap might be synthesized into a ‘shared world’ (Gould, 1994). This notion corresponds with the idea of experiential realism discussed by Mark and Frank (1996) that is based on a real world (shared world) that people share mental experiences within.
To start with the question of “what exists?” there is a problematic and old philosophical controversy between “plenum” and “atomic” ontologies (Couclelis, 1992; Couclelis, 1999). Is the world made up by discrete objects (atomic) or is it a continuum of named attributes (plenum)? Ontology is the branch of metaphysics that deals with the nature of being. The term has during the last five years or so been used in the geographic
Environmental management and information sources • 7 information science literature where its meaning
ranges from the metaphysical science of being, to the more computer scientific view that ontology is a formalization of how to represent objects and concepts and their interrelations within an area of interest. These different interpretations led Smith (1998) to make a terminological distinction between R-ontology (referent) and E-ontology (epistemological). R-ontology refers to a theory about how a given referent-domain is structured, what sorts of entities it contains, relations and so on. This relates mostly to the short introduction above. E-ontology on the other hand is a theory about how a given individual or group or language or science conceptualizes a given domain. It follows from that definition that there are as many proper E-ontologies as there are conceptualizations, and it is this type of ontology that will be dealt with in this dissertation.
So, how does ontology take us any further? The experiential or cognitive perspective advocated by Mark and Frank (1996) suggests that humans deal with categories in a way that depart in a few fundamental ways from the traditional set-theoretic view that until recently has been the dominating idea for a formalized treatment of geographic information. I have no intention to go deeper into the philosophical or psychological sciences and theories of knowledge (epistemology). I will instead follow one of
Pawlak’s (1991) propositions and hold knowledge as being deep seated in the abilities of human beings and other species to classify anything; (apparently) real things, states, processes, moments of time and all other more or less abstract concepts we can think of. By this definition, knowledge is necessarily connected with the classification patterns related to specific parts of the real or abstract world and seen from the opposite direction classification is one of the fundamental tools of science (Mark, 1993). Knowledge thus consists of a family of classification patterns (conceptualizations or E-ontologies) of a domain of interest, which provide explicit facts about reality – together with a reasoning capacity able to deliver implicit facts derivable from explicit knowledge (Sowa, 1999). By a classification or conceptualization I mean any subdivision or partition of a real or abstract world using concepts and it is assumed from here on that classification is used to create categories which are also assumed to be basic “building blocks” of knowledge.
The terms ‘category’, ‘class’ and ‘concept’ are held synonymous although the common use of ‘class’ within computer implementations make this term ambiguous for this discussion and is the reason for me to prefer ‘category’ or ‘concept’ in this treatise. The term ‘entity’ refers to instances of concepts in the real world and as a consequence of Figure 1 that will be instances of concepts in the perceived reality. The related term ‘object’ refer to the digital representation of the entity and is therefore relevant to the specification and data in Figure 1. Entities and objects may also be termed grains and the term granularity is thus related to the resolution of the information. Unfortunately the term resolution is already associated with specific meanings for both spatial and temporal measurements (Veregin, 1999). I prefer here to use granularity as a more generic term in the sense that information contain grains such as classes, pixels and time units, that are limited in their spatial, temporal and categorical extent. Thus the granularity imposes restrictions on the possibilities to discern between entity/object elements within a grain.
The full process of creating a model of reality from the real world through human perception to a computer representation will be readdressed at the end of this chapter. For now it suffice to conclude that real world perceptions are inherently complex but seem to be possible to ’Real world’
Perceived reality Specification
Data
Figure 1 The abstraction process from perception of real world phenomena as entities in the perceived reality through a specification to an object representation in a database.
8 • Environmental management and information sources divide into building blocks that we call categories. Through E-ontology these categories may be defined and given significance and hopefully further organized in the framework of a geographical decision support system. Dealing with the where, when, and why of the real world, geography has developed some workable theories and methods to be able to conduct study and analysis of real world phenomena. It is impossible here to provide a full review of current methods or theories. In the following section I will simply elaborate on the notion of real world models in geography and the traditional use of a cartographic language to express geographical knowledge.
Real world models and Geography
Models of the real world have within geography a tradition of being space-time centered where descriptions of space seem to have dominated until work by Newton in the seventeenth century made it possible to treat time in a similar manner (Couclelis, 1999). The ‘object’ or ‘plenum’ views lead either to a world view focused on objects or on fields (Couclelis, 1992) which in turn may suggest a scale dependency of geographic space into for example small scale and large scale space (Mark and Frank, 1996). It is also commonly noticed that a separation can be made between true objects and humanly constructed objects, for example fiat vs. bona-fide objects (Smith 1995), non-geographic vs. geographic entities (Nunes, 1991). As a contrast one can also argue for a psychological definition of space where scale is defined not by the actual or apparent absolute size but on the basis of the projective size of the space in relation to the human body (Montello 1993). In this case a room in a house and the surface of the earth as seen from an airplane would belong to the same psychological space domain as they can both be apprehended from the same position. The lack of consensus on this issue indicates that we probably have to deal with some combination of these notions (Peuquet, 1988). The plenum and atomic (Couclelis, 1982) ‘space paradigms’ are probably at work in parallel in our way to use our own ‘external models’ of reality. The traditional map actually supports some of these ideas as it uses small-scale space to represent a large-scale space, extending the well known Euclidean geometry of everyday objects into a geographic
space of realms and regions (Montello 1993) and geographic information systems have theoretically the ability to incorporate both plenum and atomic views represented as rasters (fields) and vectors (objects) respectively.
Geographical information includes indiscreet values, inaccurate attribute definitions as well as variations in temporal and spatial scale. Traditionally geography has been communicated through maps but also through texts and images. The latter becomes evident whenever visiting a geography library where books constitute a significant part of the information volume. During the last few decades increased use and availability of remotely sensed data has added a variety of new information sources for geographic analyses, for example aerial photographs, satellite images and radar data. Despite the fact that remote sensing devices provide an increasing amount of geographic information, I still regard the map as one of the most important sources of documented spatial information. It is also a well-refined model of communicating the atomic view of the real world. In addition, the fact that maps in many cases are the only available historical spatial record, the set of existing maps is an invaluable source for environmental information. Considerable amounts of geographical data collected in textual form with some sort of geocoding inherent, together with numerous inventories that have been carried out during the past few decades also form an extensive source, however mostly textual, for information on the environment (Frank and Mark, 1991).
Communication through a ‘map-interface’, which usually consists of a set of symbols, colors, text, is adapted to and designed for human-to-human communication. This communication process includes at least two steps where human interpretation is involved: first the real world is interpreted by the cartographer who produces a map using sets of well-known semantics and abstractions, then the user reads the map and tries to extract the necessary realism from the abstractions in the map. The map metaphor has been described and also further developed by several authors, among which Christopher Board and Arthur Robinson have made substantial contributions (MacEachren, 1995).
Environmental management and information sources • 9 The form a representation of geographic
phenomena takes on a map or other display cannot be divorced from its purpose and the requirements of the society in which the visual language gains currency (Gombricht, 1977). This is essentially an expression of underlying faith, the hermeneutic science metaphor (Johnston, 1999) or the socio-cultural perspective on time and space (Couclelis, 1999). Still, we cannot
ignore the fact that each spatial entity has been identified for a specific purpose and that the way this entity is visually represented on the map can be different according to the cultural preferences of the cartographer or the intended audience.
The examples in Figure 2 show the same geographic region as three different thematic maps compiled at1:50 000 scale portray it, and where some common features are shown. Figure 2 Three different thematic maps covering the same area compiled in 1:50 000 scale. The legends cover some common features among which the boulder concept is discussed in the text. (From Lind 1997)
10 • Environmental management and information sources Although the maps have been compiled in the same cultural setting and with mapmakers from the natural science disciplines, the representation of ‘boulder’ in Figure 2 within the mapped area differs from 0 to 7 symbol instances. The symbols should be interpreted as an indication of actual place for the feature and to some extent the areal coverage or frequency.
Some of the differences in Figure 2 might be held as interpretation inaccuracy during map compilation, but when we are given information on the purpose of each map the differences become understandable: For vegetation mapping the presence of boulders can be a significant character of the vegetation type and control the variation of the vegetation within one given class unit. The signs are to be taken as a secondary label indicating the presence of boulders within the area and the location should not be expected to be of high spatial accuracy. To a geomorphology map, boulders are of vital importance to the interpretation of the landforms and their genesis. In this map we can therefore expect a higher amount of boulder signs and relatively high spatial accuracy in their location. The geology map finally does use boulder signs, but we would expect them to appear only when the boulders are used as an indicator of actual bedrock.
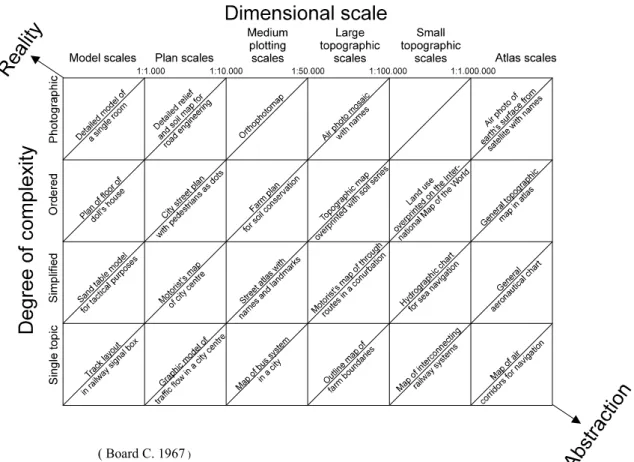
So, we see that maps can serve a multitude of purposes. Important for this work is that maps can be considered as spatial representations of real world features which can in turn stimulate other spatial representations and all such representations are acts of knowledge-construction (MacEachren 1995). No matter how far this process is driven, the geometric representation of a feature on a map will always be a generalized abstraction of its current form and status (Livingstone and Raper 1994). The map as a representational model to communicate something of the nature of the real world is only able to deliver a fraction of the total amount of information present in the real world. So, we are either forced, or we deliberately choose to use different levels of detail in our representation of the features of interest. The example in Figure 3 taken from Board (1967) illustrates how representations of spatial features can be seen as organized along a gradient from an infinite reality to an ultimate ideal abstraction. It also indicates that relative abstraction levels can be identified as a function of two important components:
dimensional scale and degree of complexity. Along this abstraction gradient we trade faithful complexity with distorted understanding (Board 1967). It is apparent that by chosing a certain level of abstraction a certain amount of detail gets lost. Still manual map reading may gain some of the lost detail through inference.
Given some knowledge of the purpose of an information collection, a knowledge based reasoning on the information value of each map element reveals more than can be read only be coupling the map legend to a concept definition. This is a kind of ‘back-tracking’ of the map-making processes by using some knowledge about the context in which the map features were assembled. The meaning of ‘context’ may vary among people but I intend to embrace a wide meaning of the term and define geographic context as the historical, social, physical, and disciplinary domain where geographic abstractions are formed. The geographic entities we try to describe such as those mentioned in the examples above own three special characteristics responsible for the shortcomings of current representational techniques according to Peuquet et al. (1995).
• The data volume needed to adequately represent geographic entities can be very large.
• Spatial relationships between geographic entities tend to be imprecise and application-specific, and the number of possible spatial interrelationships very large.
• The definitions of geographic objects tend to be inexact and context-dependent. As if the volumes of data and complex relations were not enough, two of these three statements include formulations such as ‘application-specific’ and ‘context-dependent’, which illustrates the complex nature of geographic representations. In fact, that there can never be a single uniform representation of the geographic world is well known to geographers. The two latter statements also talk about imprecise relationships and inexact definitions, which will be subject for further elaboration in following sections about accuracy and knowledge representation.
To summarize, communication of geography through maps is traditionally a manual task that is now turning increasingly automated and information intensive. Nonetheless, any qualitative or quantitative spatial analysis need to
Environmental management and information sources • 11 consider that every representation of geographical
features, be it on a map or in a digital database, is an abstraction of the reality, and as such they have been generalized for some specific purpose, therefore depending on the geographic context.
Real world models and geographic
information systems
Apart from highlighting the context dependent nature of all geographic information, the map example in the previous section also shows how the cartographic language has been used to exploit the human ability to understand a situation by simultaneously overview a large area and pick up details. In Figure 2 a general pattern is given as colored areas and important details are given as symbols. Boulders would not really be visible in the given scale, but by using symbols one can indicate the presence and approximate location of these phenomena. It also makes sense to the map-reader, as it is possible to extrapolate cognitively the ‘boulders’ from the given location of the representation. This possibility of using a combination of detail and generalizations is not readily implemented in current geographic information systems but it might be possible to do, given that we can develop enhanced
possibilities to express geographical meaning for entities in a geographical database.
In a geographic information system the visualization and the storage of data are separate. Possibilities to change scale by zooming in and out, reclassify data, create great opportunities for geographical analysis. In a geographic information system we are theoretically not constrained anymore by a paper map sheet with finite size and depth. ‘The map’ may instead be used as an abstract algebra paradigm (Tomlin, 1990) where the map elements are handled in a GIS toolbox to perform spatial analysis. The map itself will become a process as the on-screen map will play a key role as an interface to data in future GIS use (Kraak, 1995) GIS map-use is therefore two-way oriented in a way that include a large amount of user interaction with the data. In the light of the previous discussion on map communication and multiple world-views, the user-producer dialogue in a GIS makes it even more important that communication can be carried out within the ‘shared world’ of the user and the producer. On the downside, there is at least one serious concern that must be dealt with. There is no guarantee that the displayed information will appear in the same way as in the
( Board C. 1967)
Figure 3 The gradient between reality and abstraction indicating examples of types of maps at their appropriate level of abstraction (after Board 1967)
12 • Environmental management and information sources source material. The previous map example illustrated that many map features have a symbolic meaning, and these features have been designed for use with other map features in the scale and extent set by the paper map. This suggests that a straightforward transfer, that is digitization, of map features into digital format is a difficult task. A further aggravation is that the GIS user interface tends to mask the different origins of data, thereby leaving the user unaware of inherent limitations in the information. Even if the user should be aware of this problem it is not always possible to trace the origin and the limitations of the data stored in a GIS database. Nevertheless, digitized map data is widely used in geographic information systems.
Any attempts to use GIS to integrate data from environmental databases and to use models or analytical tools upon data need a full understanding of the origin and context of each data set used. Thus taking data using several different conceptualizations from different contexts the GIS integration process relies upon a transformation of this information into the desired conceptualization and current context. The issue of finding automated methods for that kind of GIS integration has been the focus of much work. Recently the above described integration process has been put into a comprehensive framework of interoperability of geographic information systems (see for example collections edited by Vckovski, 1998 and Goodchild et al. 1999). Interoperability has earlier been understood as a capability to transfer data from one computer system to another. It is only recently, and at a more general level, that the term has found its way to the wider geographic information science community. At the general levels of geographic information systems and applications, interoperability is concerned with the establishment of a smooth interface between multiple information sources (Harvey, 1999). At the GIS level, problems of interoperability can be created by different geometric syntactic representations, difference in class hierarchies, and different semantics (Bishr, 1998). Since different applications have different worldviews and semantics, interoperability at the application level is essentially a semantic problem (Bishr et al., 1999)
The discussion so far has elaborated on the fact that geographical data is subjected to major influences from various individual
conceptualizations of the same reality. Furthermore I have argued that a geographic information system theoretically has the ability to do spatial analysis of integrated geographical data. Still there are apparently some fundamental aspects of context and semantics that need to be resolved. I now intend to resume the initial discussion on models of the real world in the context of modeling a computer representation of the real word and how the geographic context can be represented in this model.
Existing models in use
The individual worldview and the shared world concepts correspond to the external and conceptual models in the ANSI-SPARC definition, which has been used as a general framework for designing geographic information systems (Laurini and Thompson 1992, p.357). An overview of this model framework is given in Figure 4. The external models are defined by the potential user and their purposes and needs, the conceptual (or semantic) level is concerned with a synthesis of all external models, the logical level is a high-level description which is mathematically based and computing oriented and the internal level is concerned with the byte-level data structure of the database (Laurini and Thompson 1992, p.357f.)
Somewhere along this chain of model levels the supposedly chaotic real world is somehow systematized and made discrete for the purpose of digital handling. Apparently this step will have to be taken at a high level. The bridge between a concept/semantic model and a logical model is easier to create if a more formal mechanism is used at the conceptual level rather than narrative statements. However, the conceptual level will still need to hold both the deeper semantic notions of external models as well as synthesized concepts, which easily translate into logical level models. Clearly, the separation of models into a few levels does not solve this problem, but a short description from this more data modeling oriented viewpoint seems appropriate. Also, by explicitly identifying a semantic level in the data model stresses the importance of the actual meaning of data. I will return to this issue from many aspects since it is central for this thesis.
Proposed semantic level models
Seen from a GIS integration viewpoint the focus up until around 1995 was mainly on systems, data and to some extent information (Sheth, 1999).
Environmental management and information sources • 13 Work on semantic or conceptual models for
geographic information focusing on information and knowledge has received a significant amount of attention only in the past five or six years (Livingstone and Raper, 1994; Peuquet, 1994; Ruas and Lagrange, 1995; David et al., 1996; Usery, 1996). David et al. (1996) reported on early work to develop conceptual models for geometry within the European Committee on standards (CEN/TC287) and suggested that the main bottleneck in geographic information handling is the understanding of the semantic level and the way entity meaning affects the modeling of entity interactions over varying spatial and temporal scales.
Ruas and Lagrange (1995) outlined one possible logical model connecting the semantic models with the physical models. From their perspective of generalization, this should be seen as a process allowing us to perform a change in the perception level of geographic data. They also stated that the first generalization stage is the transition from one initial data schema to one corresponding at another level of perception. According to this the actual generalization decisions are made at the semantic level and further operations need ‘only’ be carried out on a rule base at the logical and physical levels. The issue of generalization is readdressed in the sections about spatial and categorical granularity in chapter 3.
Another relatively early idea proposed by Peuquet (1988; 1994) incorporates concepts from perceptual psychology and advocate a “triad” representation of spatiotemporal data in the later publication. It builds on the idea that the three “views”, time based, location based and object based, all provide different aspects of the data and thus each facilitates a specific kind of query. The integration of these three views would enable for example objects to be explained by the spatial view and conversely spatial patterns to be matched against object based knowledge. The “triad”- view (Peuquet, 1994) is based on a dual framework of object- location integration (Peuquet, 1988) and the incorporation of time into this framework is still under investigation (Peuquet, 1999). This kind of simultaneous representation of multiple views of the same fact seem as a theoretically sound concept, and the following few paragraphs will show that much research verify the difficulty to find one common level of understanding. Instead it seems as if a
description of common and diverging points of reference are the most feasible way to give geographic entities more meaningful representations. In chapter 8 I argue that the integration of fuzzy, rough and crisp representations is a feasible implementation of the dual framework proposed by Peuquet (1988).
Usery (1996a, b) developed a feature based conceptual model along the same line of thought as Peuquet. Using an entity based view of geographic phenomena this model explicitly represents spatial, temporal and thematic attributes which can be directly accessed. A fuzzy set implementation of geographic features is proposed as a solution to capture some of the ambiguity inherent in features based on human perception and cognition (Usery, 1996b). The use of fuzzy set representation is a notable exception from the other proposed frameworks presented in this short review. Although this model seems very promising it remains to be tested. Also, to some extent noted by Usery, the mechanism for comparing multiple views of the same geographic feature has not been identified.
Livingstone and Raper (1994) argued for a semantic model where the entities should define
Exernal model 1 External model 2 External model 3
’real world’
Conceptual model Logical model Internal modelFigure 4 The four information modelling levels; external, conceptual, logical and internal, according to the ANSI-SPARC design methodology (After Laurini and Thompson 1992)
14 • Environmental management and information sources the space they occupy and also guide the appropriate spatiotemporal representation. This view follow that of Nunes (1991) who claimed that the debate on concepts of space, shortly referred to earlier, show that no further specification of geographic space is possible unless the geographic objects can be defined. A semantic model theory developed form this viewpoint needs to be defined at a higher level of abstraction than the spatial and temporal models used to represent the phenomenon (Livingstone and Raper 1994). It has been argued that this would provide the necessary link between a GIS application, external process models and used spatial databases, and that an object-oriented approach using environmental metaclasses provide the means to perform co-ordination between different “world views” of the same “real world” entity (Livingstone and Raper, 1994; Raper and Livingstone, 1995). A metaclass is in object oriented wording an assemblage of data classes or model classes, it works independently from the subordinate data or model classes, at the logical model level, and it is concerned with the behavior and relationships of the class categories and available morphisms between the classes. One main problem with this construct seems to be that since a metaclass determine what objects it will be possible to represent one need to explicitly define at a metaclass level the attributes and methods of all current and future objects.
Recent work by Bishr (1998) and Bishr et al. (1999) have provided a useful formalized, approach for semantic modeling. Bishr in his thesis (1997) proposed a general framework for semantic translators capable of mapping between spatial database schemas while preserving their semantics. The main tool to connect semantically similar objects is in his framework based on common ontologies, essentially a standardized vocabulary for various domains of interest. Gahegan (1999) basically propose the same idea and both authors hold the use of interchange format (the term proxy context in Bishr’s work) as a mediator to transform data from one information context to another. Gahegan also conclude that such a framework including categorization and transformation can achieve communication of meaning. However, Kuhn (1999), although involved in the work by Bishr et al. (1999), points out that existing approaches to semantic modeling such as semantic networks and first order logic are too limited for a rich and deep
description of semantic meaning. That motivated him to suggest a connection between semantic nets and algebra that combines the best of these two worlds, a direction proposed as early as 1984 by Andrew Frank (Kuhn, 1999). One of the main achievements by this approach would be the possibility to provide links between two different semantic networks.
Semantic model integration
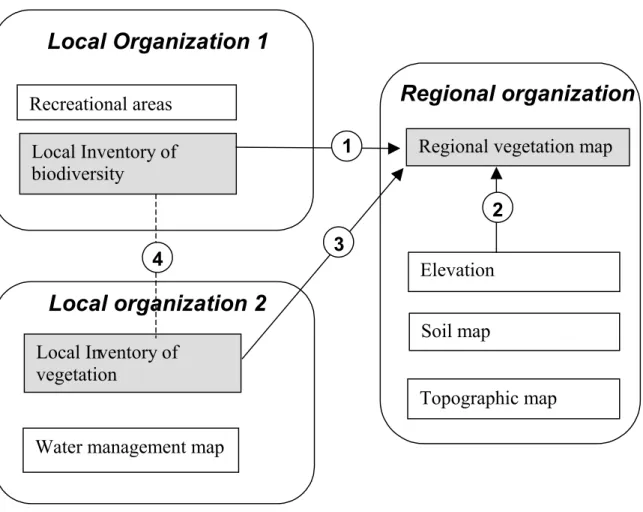
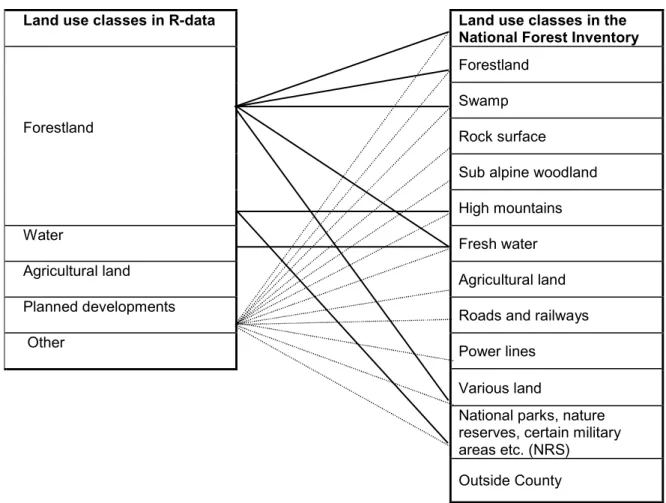
The original issue of modeling the real world has now turned into an even more challenging one of integrating different worldviews. In the above discussion several ideas based upon definition of common ontologies (Bishr et al., 1999; Gahegan, 1999) or metaclasses (Raper and Livingstone, 1995) were put forward. Such work will ultimately become a matter of getting groups of people together to negotiate their disagreements and consequently the issue of real world integration turns into what has been formalized as part of the sociology of science theory as Group or Organizational Decision Support Systems (King and Star, 1990). Bishr et al. (1999) uses the term “geospatial information community” to mean a group of spatial data producers and users who share an ontology of real-world phenomena. However, King and Star (1990) takes a broader stance, uses a social metaphor rather than a psychological one, as in e.g. Smith and Mark (1998), and address the entire decision making process in which “due process” and the construction of "boundary objects" is of particular importance (Star, 1989). Due process can be explained as groups and organizations constant struggle to recognize, gather and weigh evidence from heterogeneous conflicting sources (King and Star, 1990). Boundary objects is a structure for coordinating distributed work that not only involves heterogeneous actors, elements, and goals but also incorporates different research methods, values, and languages. A boundary object both supplies common points of reference as well as differences to enhance participant understanding of what world views other participants hold, and why they hold them. This theory has recently been brought into the geographic information science by Harvey (1997) and further discussed by Harvey and Chrisman (1998), Chrisman (1999) and Harvey (1999). It seems from their examples of wetlands mappings in the United States and the ATKIS standard database model in Germany that a definition of common ontologies and schema integration can at
Environmental management and information sources • 15 best reach some kind of associations and partial
matching. Again this can hardly be represented by approaches based on binary relations but it can be constructively moved further if viewed from the ideas of due process and boundary objects. Vague, inconsistent, ambiguous and illogical information open the domain for concept negotiation, and there is enough proof that these situations are successfully handled within for example organizational decision processes (King and Star, 1990). Several types of boundary objects have been identified and King and Star (1990) list four such types; repositories, ideal types, coincident boundaries, and standardized forms. Repositories are “piles” of objects that are indexed in a standardized form such as a library or a museum. Ideal type or platonic object may be fairly vague but a good enough abstraction from all included domains of participants such as an atlas or a diagram. Coincident boundaries are terrain objects that have the same boundaries but different internal contents such as the delineation of the counties within Sweden. The last type of boundary objects, standardized forms or labels, are methods of common communication such as the standardized form used by the national forest inventory described in chapter 4. It is argued that boundary objects may serve as a mediator in negotiations around which similarities and differences can be articulated (King and Star, 1990; Harvey and Chrisman, 1998). If it turns out possible to formalize the idea of boundary objects into something that explicitly can represent commonalities as well as differences this would hopefully serve as a better means to represent geographical meaning in a geographic information system. A similar line of thought although never formalized in this way was proposed by Nyerges (1991a) for geographic data integration based on concept meaning and the full implication of these ideas will be more clear by the end of the next chapter.
To summarize; a geographic information model need to capture the vital components of geographic information. A host of authors conform in the outline of which the basic characteristics are that makes up geographic information. (Sinton, 1975; Peuquet 1994, Albrecht 1996, Gahegan, 1999) For example Albrecht (1996) state that in order to fully characterize geographic information it is necessary to simultaneously capture the basic spatiotemporal, thematic and topological aspects
of the geographic entities and phenomena. Time, space (3D), theme, and their inter-/intraconnections thus can be viewed as a basic set of rather abstract properties that need to be described. How these characteristics should be modeled have been the focus for much research and development and it is only lately with increased demand for interoperability and data integration that the issue of meaning of the entity itself has gained focus.
Thus, in the next chapter I will start by examining the space, theme and time components separately. First of all though, I address in general the quality question, which in any use of data is an important concern. Quality issues include aspects of detail and accuracy and these have also become central in my thesis.
Detail in geographic information models • 17
D
ETAIL IN GEOGRAPHIC INFORMATION
MODELS
Human knowledge is a process of approximation. In the focus of experience, there is comparative clarity. But the discrimination of this clarity leads into the penumbral background. There are always questions left over. The problem is to discriminate exactly what we know vaguely.
ALFRED NORTH WHITEHEAD, Essays in Science and Philosophy
In the previous chapter I concluded that aspects of time, space (3D), theme, and their inter-/intraconnections can be viewed as a basic set of rather abstract properties that need to be described to fully characterize geographic information. As a first step in the experimental design I decided to investigate these aspects separately in order to isolate and identify important deficiencies or gaps in theory and/or methods for geographic data integration. This chapter will treat the issue of detail and changing detail in space and theme.
As a preliminary I will go through some definitions pertaining to quality assessment and discuss their relevance to this dissertation. This is followed by an examination of spatial, temporal and thematic properties of geographic objects, reviewing other research efforts in the context of the work presented in this dissertation. By the end of this chapter I pull together most of the discussion and the findings reported further on in this dissertation in a discussion on a proposed solution to provide context information with geographic data. The proposed semantic model framework is labeled Geographic Context Topology, GeCoTope, and the work in chapter 8 demonstrates a partial implementation of this framework.
Quality – Detail, Granularity, Accuracy,
Fitness-for-use and Uncertainty
During the last 20-30 years some well needed research efforts have been made to understand
aspects of error and quality control in geographic data. Also, work to systematically define and standardize aspects of geographic data quality has been published (Guptill and Morrison, 1995).
Some attempts have been directed towards creating a common typology of quality. The two examples below both suggest a general typology for data quality or ‘goodness’ measures. Although they represent quite different fields of research they agree in much, and both works outline a separation between measurable and non-measurable aspects of quality.
Veregin (1999) in a recent treatment of the quality issue implicitly outlines a two dimensional matrix of geographic data quality components. Like any geographical phenomenon description, quality aspects may be divided into spatial, temporal and thematic components (Sinton, 1978; Veregin, 1999). Each one of these dimensions includes aspects of accuracy, resolution, consistency and completeness. So, we have for example an aspect of spatial resolution in a dataset, an aspect of thematic consistency etc Table 1. Interestingly, another and somewhat similar typology from the field of Modeling and Simulation (M&S) can be found in Meyer’s (1998) definition of ‘goodness’ measures. In his definitions (level of) Detail is a measure of the completeness/complexity of a model with respect to the observable characteristics and behaviors of phenomena that the model represents. (level of) Accuracy is a measure of the exactness of a
Table 1 Data quality components
Accuracy Granularity Consistency Completness
Space Spatial accuracy Spatial granularity Spatial consistency Spatial completeness Time Temporal
accuracy Temporalgraunlarity Temporalconsistency Temporalcompleteness Theme Categorical accuracy Categorical granularity Categorical consistency Categorical completeness Chapter
3
18 • detail in geographic information sources model's details with respect to the observable characteristics and behaviors of phenomena that the model represents. (level of) Fidelity is a measure of the agreement of a simulation with respect to perceived (i.e. within a specific context) reality. (level of) Resolution is a measure of the minimum degree to which accuracy and/or detail must coincide with the fidelity of the simulation. Accuracy and detail are relevant primarily in relation to models. Fidelity and resolution are appropriate to use in a simulation context. Meyer’s terms fidelity and resolution are not directly related to any of the four aspects listed by Veregin, instead they are embraced by a broader quality term ‘fitness for use’. These quality aspects have received very little attention from a geographic information science perspective. This may be due to the fact that they are hard for anyone but the data consumer to evaluate. Notably, both authors agree that fidelity, resolution or fitness-for-use are extremely hard to quantify, as they have almost no context-free meaning. This is probably already about to change with continued development of for example applied environmental models (Goodchild et al., 1993; 1996a; 1996b) but also as a result of designing an infrastructure that enables semantic interoperability (Harvey, 1999). In any case, following the argumentation of Meyer (1998), a necessary foundation for any such evaluation is that the aspects of detail and accuracy first can be properly measured.
So, if we turn to the quality measures that seem possible to quantify; detail/resolution and accuracy, we may note that Veregin’s definition of resolution correspond with Meyer’s definition of detail, whereas both authors use the term accuracy to mean the same thing. As for the use of the terms detail, resolution or granularity it is still a matter of discussion (Duckham et. al, 2000) and I noted earlier that I prefer to use granularity in this text to avoid confusion with detail and resolution. Occasionally I will also use the term resolution/granularity, mainly when reference is made to some specific work using the term resolution in the meaning of granularity.
Veregin (1999) and Meyer (1998) as well as several others (Salgé, 1995; Goodchild, 1995) treat accuracy as a relative measure since it is dependent on the intended form and content of the database. In addition to accuracy and granularity Veregin (1999) also include quality measures of consistency and completeness, Table 1. If we
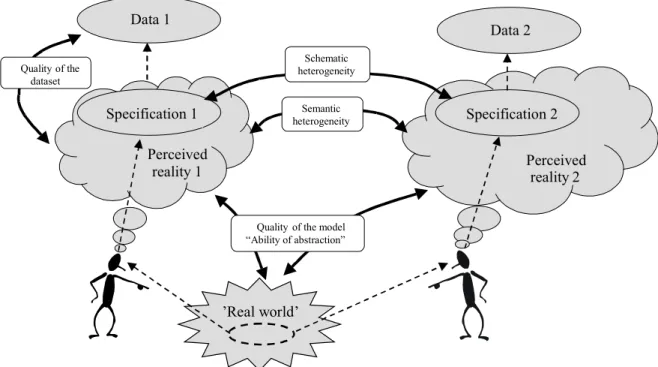
consider the measurements in Table 1 as a minimum requirement to document we now need to suggest some viable ways to measure each property. It turns out that the matrix works fairly well for well-defined features (Goodchild, 1995; Veregin, 1999). We need to keep in mind though that measurement is always made against a logical specification of the conceptual model that was used to collect the data (Veregin, 1999). Goodchild (1995) noted that for poorly defined features it is not always possible to separate for example attribute accuracy from spatial accuracy. For example in the case of vegetation maps it is subjected to discussion whether the location of a boundary between two vegetation types is uncertain due to the problem of measuring the exact location of the vegetation types or if it is due to the problem of discerning between the two vegetation types at the correct location (Goodchild, 1995; Painho, 1995). Salgé (1995) provided the first treatment of quality measurements from this perspective in his seminal text on semantic accuracy. Semantic accuracy refers to the quality with which geographical objects are described in accordance with the selected model (Salgé, 1995). Figure 5 show a modified version of Figure 1. It illustrates the concepts of model quality or ‘ability of abstraction’ as a measure of how well a real world feature can be defined in the perceived reality. It also shows the meaning of an evaluation of dataset quality as how well geographical objects in a database correspond with the perceived reality. Veregin (1999) actually uses these notions but deviates slightly from the proper definition of
’Real world’ Perceived reality 1 Specification Data Quality of the dataset
Quality of the model
“Ability of abstraction”