A Lane-Change Scenario Developed for
Assess-ment of Active Safety and ADAS
in Heavy Vehicles
Evaluated in a Driving Simulator Study
ViP publication 2017-1
Authors
Jesper Sandin, VTI
Bruno Augusto, VTI
Peter Nilsson, AB Volvo (GTT)
ViP publication 2017-1
A Lane-Change Scenario Developed for
Assessment of Active Safety and ADAS in
Heavy Vehicles
Evaluated in a Driving Simulator Study
Authors
Jesper Sandin, VTI
Bruno Augusto, VTI
Peter Nilsson, AB Volvo (GTT)
Leo Laine, AB Volvo (GTT)
Cover picture: VTI
Reg. No., VTI: 2014/0095-8.2
Preface
The project Development of a lane-change scenario for safety assessment of Long Combination Vehicles
(LCV) was a collaboration between Swedish National Road and Transport Research Institute (VTI)
and Volvo Group Truck Technology within the ViP Driving Simulation Centre (www.vipsimulation.se).
The aim of the project was to develop a lane-change scenario for driving simulators to analyse the characteristics of change manoeuvres performed with heavy vehicles. The definition of the lane-change scenario was based on a literature review and an analysis of lane-lane-change accidents carried out in the present work.
In the Swedish Traffic Accident Data Acquisition (STRADA), lane-change accidents are not
categorized separately. So, to identify these accidents, the accident narratives where the accidents are described with a few sentences were read through for more than 5 000 accidents. While this was a time-consuming task, the results indicated that lane-change accidents are the third most common accident type involving heavy vehicles. This picture does not appear in official accident statistics. The subsequent simulator experiment showed that the lane-change scenario worked satisfactorily and much in accordance with real-world observations.
The parts of this report that describe the lane-change scenario, the simulator experiment and the results have been reported in a conference paper (Sandin et al., 2015).
The LCV project can be viewed as a next step after the previous ViP project High Speed Control of Long Combination Heavy Commercial Vehicles within Safe Corridors (Nilsson et al., 2016), which initiated a technical framework for studying manual and automated high-speed driving of long vehicle combinations (LVCs) in a driving simulator environment.
The project has been financially supported by the competence centre ViP, i.e. by ViP partners and the Swedish Governmental Agency for Innovation Systems (Vinnova).
Participants from VTI were Jesper Sandin (project manager) and Bruno Augusto. Participants from Volvo Group Truck Technology were Peter Nilsson and Leo Laine.
Gothenburg, December 2016
ViP publication 2017-1
Quality review
Peer review was performed on 17 January 2017 by Bo Svanberg, VCC and on 18 January 2017 by Selina Mårdh, VTI. Jesper Sandin has made alterations to the final manuscript of the report. The ViP Director Lena Nilsson examined and approved the report for publication on 29 May 2017.
Table of contents
Executive summary ...9
1. Introduction ...11
1.1. Lane-change accidents involving conventional transport vehicles ...11
1.2. Lane-change manoeuvres with long combination vehicles ...12
2. Objective and approach ...13
2.1. Objective ...13
2.2. Overall structure of the project ...13
3. Literature review ...14
3.1. Method ...14
3.2. Results ...14
3.2.1. Lane-change manoeuvres ...14
3.2.2. Lane-change accidents ...16
3.3. Summary and discussion ...17
4. Analysis of lane-change accidents involving heavy vehicles reported in STRADA ...18
4.1. Method ...18
4.2. Results ...19
4.3. Summary and discussion ...21
5. Definition of the lane-change scenario...22
6. Simulator experiment ...24
6.1. Purpose of simulator experiment ...24
6.2. Method ...24 6.2.1. Driving simulator ...24 6.2.2. Vehicle models ...24 6.2.3. Driving route ...24 6.2.4. Participants ...25 6.2.5. Experiment set-up ...26 6.2.6. Data collection ...26 6.2.7. Analysis ...26
6.3. Results from the simulator experiment ...27
6.3.1. Lead and lag gaps...27
6.3.2. Velocities at lane-change initiation and completion ...28
6.3.3. Lane-change duration...28
6.3.4. Questionnaires and driver comments ...29
7. Discussion of lane-change scenario and experiment ...30
8. Conclusions ...32
9. Contribution to ViP ...33
References ...35
ViP publication 2017-1
Abbreviations
ADAS Advanced Driving Assistance Systems
Fd The following vehicle in the destination lane during a lane change Fo The following vehicle in the originating lane during a lane change HV Heavy Vehicle
KSI Killed or Severely Injured
Ld The lead vehicle in the destination lane during a lane change Lo The lead vehicle in the originating lane during a lane change LVC Long Vehicle Combination
M Average
SAM Self-Assessment Manikin SD Standard Deviation SHW Space Headway
STRADA Swedish Traffic Accident Data Acquisition THW Time Headway
List of figures
Figure 1. An example of a long vehicle combination (LVC), referred to as an A-double (from Nilsson et al., 2017a). ... 11 Figure 2. Tractor semi-trailer combination crashing into a vehicle while changing lane. ... 12 Figure 3. Possible accident where an A-double combination hits a vehicle while changing lanes. ... 12 Figure 4. (Above) Gap acceptance in a lane change towards the left. Both the lead gap and the lag gap must be acceptable. (Below) Initiation and completion of a lane-change manoeuvre, time instances that are represented, respectively, by the start and the end of the lateral movement (from Bie et al., 2013). ... 15 Figure 5. Accident type distribution by length group for KSI accidents (not adjusted for exposure) (from Bálint et al., 2014). ... 16 Figure 6. The top three accident categories with heavy vehicles involved over all severity levels during the years 2003 to 2013. The shares are distributed after re-categorization of rear-end and lane-change accidents and should currently be interpreted with caution (n = 10 500). ... 20 Figure 7. Lane-change accidents (blue dots) on E6 passing through the city of Gothenburg, Sweden, and involving heavy vehicles, during the years 2003 to 2013 (picture from GoogleTM Earth). The
satellite image is rotated 90 degrees counter clockwise, indicated by the compass needle in the figure. ... 20 Figure 8. Illustration of the first lane change (to the right) out of two in the gap-acceptance scenario. When the driver turns on the indicator, the lead and lag vehicles in the lane to the right will start displacing to create a gap that the truck can fit into. ... 22 Figure 9. The two vehicle types used in the simulator experiment. To the left an 18.75-meter long tractor semi-trailer combination (Picture: Mostphotos), and to the right a 32-meter long A-double combination (Picture: www.duo2.nu). ... 24 Figure 10. Illustration of the driving route used in the experiment, based on a real road. The number of lanes (in the driving direction) of each road is represented by blue lines. Connecting lanes are
represented by blue dashed lines. Each driving session started on road E20 at position 1. At position 2 the drivers reached the entrance ramp to road E6. At position 3 the drivers entered road E6 in the leftmost lane (because of the road design) and surrounding traffic appeared. At position 4 the drivers reached the exit ramp in the rightmost lane and at position 5 the experiment was ended. The lane-change events were carried out on road E6 between positions 3 and 4. The distance between positions 3 and 4 was 2.5 km (from Nilsson et al., 2017a). ... 25 Figure 11. a) Gap acceptance in a lane change. Both the lead gap and the lag gap have to be accepted. b) Initiation and completion of a lane change represented by the start time and end time of the lateral movement, respectively. The lane-change duration is the time lapse between its initiation and
ViP publication 2017-1
List of tables
Table 1. Results from the investigation and re-categorization of the accident types “overtaking and lane change”, and “rear end” in STRADA. ... 19 Table 2. The setting of the initial and target time headways (THW) for lead and lag vehicles during the first and second lane change. ... 22 Table 3. Lead gap at lane-change initiation measured as time headway (THW) between the front of the truck and the rear of the lead vehicle. ... 28 Table 4. Lag gap at lane-change initiation measured as time headway (THW) between the rear of the truck and the front of the lag vehicle. ... 28 Table 5. Velocity at lane-change initiation and completion. ... 28 Table 6. Duration of lane change between its initiation and completion. ... 29
A Lane-Change Scenario Developed for Assessment of Active Safety and ADAS in Heavy Vehicles - Evaluated in a Driving Simulator Study
by Jesper Sandin1, Bruno Augusto1, Peter Nilsson2 and Leo Laine2 1Swedish National Road and Transport Research Institute (VTI) 2Volvo Group Trucks Technology
Executive summary
The aim of this project was to develop a lane-change scenario for driving simulators to analyse the characteristics of lane-change manoeuvres performed with heavy vehicles.
The definition of the lane-change scenario was based on a literature review, and an investigation of lane-change accidents in Sweden.
A lane-change manoeuvre is in the literature typically described by accepted gap at the initiation of the manoeuvre as well as duration of the manoeuvre and speed during the manoeuvre. The literature review showed that there is a lack of real-world data regarding lane-change manoeuvres with heavy vehicles. The data that exist are collected mainly in the US and for discretionary lane changes, and a distinction between sizes of heavy vehicles is rarely made. Regarding accidents involving heavy vehicles on European level, there is a general lack of useful and reliable accident data. The most comprehensive data are available from the US and show that lane-change accidents account for a large share of accidents involving heavy vehicles.
The investigation of lane-change accidents was made in the Swedish Traffic Accident Data
Acquisition (STRADA), on 10 500 police-reported accidents with heavy vehicles involved during the years 2003 to 2013. In STRADA, lane-change accidents are categorized together with overtaking accidents. Therefore, it is not possible to identify lane-change accidents and their share of heavy-vehicle accidents directly from STRADA. Instead, lane-change accidents were identified by reading the accident narratives for overtaking accident and rear-end accidents (in total 5 612 accidents). Rear-end accidents were included because the manner of collision may resemble lane-change collisions. The results indicated that among the 10 500 accidents the top three accident categories were rear-end (25%), single-vehicle (18.6%), followed by lane-change (16.3%) accidents. The results indicated further that more than half of the lane-change accidents (9%) had occurred when a truck had changed lane towards the right and collided with a passenger car. The investigation showed that the large share of lane-change accidents is obscured in the current STRADA system, and thus severely
underestimated. The number of rear-end accidents involving heavy vehicles may on the other hand be overestimated.
The lane-change scenario developed in the project was defined as a “gap-acceptance” scenario. It consisted of two consecutive lane changes. The intention was to study truck drivers’ accepted lead and lag gaps to the two vehicles in the adjacent right (destination) lane at the initiation of each lane change, as well as the speed and duration of the lane-change manoeuvre.
A simulator experiment was conducted with two main purposes. Firstly, to evaluate the scenario properties in terms of accepted gap, lane-change duration and speed behaviour during mandatory lane changes. Secondly, to study whether these parameters are affected by the length of heavy vehicles. The experiment was conducted with 18 truck drivers in a full-motion driving simulator with implemented high-fidelity models of an 18.75-meter tractor semi-trailer and a 32-meter vehicle combination (an A-double). A multi-lane road model based on real-world measurements was used.
10 ViP publication 2017-1 The results of the simulator experiment showed no statistically significant difference in accepted gaps to the lead and lag vehicles in the destination lane. For both heavy vehicles studied, the overall average of lead and lag gaps were estimated to 0.85 s and 0.83 s respectively, at the average velocity of
17.3 m/s. The difference in lane-change duration between the two vehicles was statistically significant, and the durations were estimated to an average of 8.7 s for the tractor semi-trailer and 10.5 s for the A-double. With the exemption of the somewhat long lane-change duration for the tractor semi-trailer, these values are in accordance with real-world observations. That is, the lead and lag gaps in the destination lane were in the same range as real values. The speed was rather constant during the lane changing, and the lane-change duration increased with vehicle length. Thus, the conclusion is that the scenario overall worked as intended, and that the drivers performed the lane changes equally well with the tractor semi-trailer and the long vehicle combination (the A-double).
Future studies can use the developed scenario as a non-critical reference to more critical events in the development and assessment of active safety functionality and automated driving systems.
1.
Introduction
Longer, or longer and heavier vehicles have received increased interest in recent years. Long Vehicle Combinations (LVCs) have 25 to 100% larger cargo space than typical truck-trailer combination vehicles. Therefore, they are expected to increase transport efficiency and thereby decrease costs as well as carbon dioxide emissions. However, before they are introduced in the traffic system on a larger scale, their impact on traffic safety and other road users’ behaviour has to be investigated.
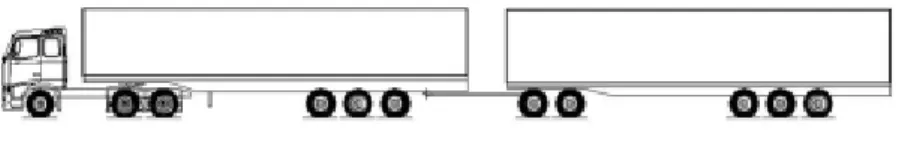
One example of an LVC is the A-double combination that AB Volvo and Schenker currently are transporting goods with between Gothenburg and Malmö. The A-double combination consists of tractor, semi-trailer, dolly and semi-trailer, is 32 m long and allowed to have a total weight of 80 tonnes (Figure 1). These vehicles are however only permitted to drive during late evening and night when the traffic density is low.
Figure 1. An example of a long vehicle combination (LVC), referred to as an A-double (from Nilsson et al., 2017a).
So far, active safety functions have mainly been developed for passenger cars, rigid trucks and tractor semi-trailers. When it comes to LVCs ranging from 25 to 35 meters, their length, number of links and units put new demands on safety functions in order to maintain or increase their safety in comparison with conventional heavy vehicles. In particular, LVCs’ swept path will be significantly larger in time and space than that of a single-unit vehicle such as a passenger car or a single truck. Their dynamical response will also differ significantly. For example, the rearward amplification, i.e. the increase ratio of yaw rate and lateral acceleration, can be significantly higher for LVCs. This means that even if the towing unit (tractor/truck) is within its stability margin, the towed units (dolly/trailers) may be beyond their stability margin. This sets new constraints not only on how the vehicle combinations should be actuated to have reduced rearward amplification but also for how the traffic safety functionality should be realised for speeds varying between 0 and 90 km/h.
The larger swept path and dynamical response of LVCs impose great challenges in traffic situations where the LVC is surrounded by other vehicles and the driver therefore has limited time and space to carry out a manoeuvre. One example of such a traffic situation is a lane-change manoeuvre on a multi-lane motorway with dense traffic. Lane-change manoeuvres in those circumstances are a challenge already with today’s conventional vehicles where driver mistakes can lead to accidents.
1.1.
Lane-change accidents involving conventional transport vehicles
Changing lanes with a heavy vehicle in dense traffic is a manoeuvre that requires considerable attention from the driver. Thirteen lane-change accidents, which were investigated in-depth in
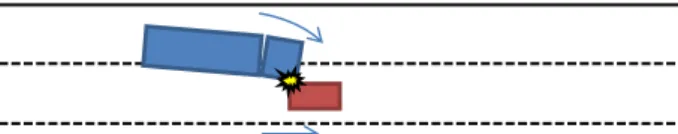
Gothenburg between 2003 and 2004 within the project Factors Influencing the Causation of Accidents and incidents (FICA), were examined by Sandin (2005). The conclusion of the examination was that the accident circumstances were practically identical. The accidents typically took place on motorways with three lanes in the same direction where a truck driver changed lane to the right (see Figure 2). Although the involved truck drivers were trying to keep track of all the vehicles in the right lane, they were unable to see a passenger car that was completely hidden by the truck cabin (despite up to five mirrors on the right side). Consequently, the truck drivers changed lane and hit the passenger car on the rearmost left side with the right front corner of the truck. As a result of the impact, the passenger car was spun around and thrown forward in front of the truck. Nevertheless, the car occupants
12 ViP publication 2017-1 sustained only minor injuries in the reviewed accidents. One possible explanation for this is that the truck and car, as well as other surrounding vehicles, were travelling in the same direction at the same speed. Therefore, the Delta-V (the total change in vehicle velocity) for the car became low in the primary impact and any subsequent impacts with other vehicles. While the injury severity was rather low in the accidents, they led to disturbances in the traffic flow causing traffic jams for 1-2 hours. In the FICA project, it was estimated that these kinds of lane-change accidents occurred about once a week on the motorways passing through Gothenburg. The actual occurrence of lane-change accidents can however not be read from official statistics because there is no separate category for these
accidents (Larsson, 2007).
Figure 2. Tractor semi-trailer combination crashing into a vehicle while changing lane.
1.2.
Lane-change manoeuvres with long combination vehicles
While changing lanes with conventional transport vehicles requires much attention from the driver, lane changes with longer vehicle combinations are likely even more demanding. With a vehicle length of 32 meters, one can imagine that it is difficult to keep track of the vehicles in the right lane by using only the right-hand side mirrors as in the accidents examined by Sandin (2005). Similarly, it may be difficult to estimate the rear-end position of the A-double in relation to other vehicles, which could result in accidents like the one illustrated in Figure 3. Furthermore, A-double combinations are sensitive to rearward amplification meaning that if a lane-change manoeuvre is performed too fast, then the rear end of the last trailer will start to oscillate considerably sideways.
2.
Objective and approach
2.1.
Objective
The aim of this project was to develop a lane-change scenario for driving simulators to analyse the characteristics of lane-change manoeuvres performed with heavy vehicles.
2.2.
Overall structure of the project
The project included the following parts:
1. Review of the literature concerning lane-change manoeuvres and accidents involving heavy vehicles.
2. Analysis of lane-change accidents in STRADA involving heavy vehicles.
3. Definition of a lane-change scenario for driving simulators, based on the literature review and the accident analysis.
4. A simulator experiment with the lane-change scenario implemented in the VTI simulator environment.
14 ViP publication 2017-1
3.
Literature review
This section describes the method and results of the literature review about lane-change manoeuvres and lane-change accidents involving heavy vehicles.
3.1.
Method
The purpose of the review was to find literature and gain knowledge about lane-change manoeuvres and lane-change accidents involving heavy vehicles. The literature review was made in May 2014 using Google Scholar as the search engine. The search was made by using combinations of the following keywords:
• Lane change/merge, lane changing/merging, sideswipe, lane change.
• Heavy vehicles, articulated vehicles, long vehicle combination, commercial vehicles. • Crash, accident, collision.
The studies that seemed relevant and which had most citations were read. Then studies that had cited the former studies (using the “Cited by” link) were handled in the same way. The collected studies were then read more carefully, together with already known studies. A brief compilation of the review results is reported below, based on the key references.
3.2.
Results
3.2.1. Lane-change manoeuvres
Bie et al. (2013) define a lane change as a vehicle manoeuvre from an originating lane to a destination lane. The traffic direction in the originating lane is with few exceptions the same as that in the
destination lane.
For the subject vehicle (M) in Figure 4 to make a safe lane change, it is necessary to keep a distance to, and avoid collisions with, four neighbouring vehicles:
Ld: the lead vehicle (the predecessor) in the destination lane; Fd: the following vehicle (the follower) in the destination lane; Lo: the lead vehicle in the originating lane;
Fo: the following vehicle in the originating lane.
Past studies on lane-change behaviour have mainly focused on the clearance with vehicles in the destination lane, as the collision avoidance with vehicles in the originating lane falls under the drivers’ normal longitudinal driving task. The lane change is considered feasible (safe) when there is an inter-vehicular gap of sufficient length in the destination lane. A gap is considered as acceptable if both the
lead gap and the lag gap are acceptable (Figure 4). The lead gap ensures that there is enough space
such that the subject vehicle will not collide with Ld; the lag gap ensures that Fd will not crash into the subject vehicle.
Figure 4. (Above) Gap acceptance in a lane change towards the left. Both the lead gap and the lag gap must be acceptable. (Below) Initiation and completion of a lane-change manoeuvre, time
instances that are represented, respectively, by the start and the end of the lateral movement (from Bie et al., 2013).
Lane-change manoeuvres are typically classified as either mandatory lane changes or discretionary lane changes (Moridpour et al., 2010). Mandatory lane changes occur when drivers must leave the current lane, for instance when merging into the freeway from an entrance ramp or when leaving on an exit ramp. Discretionary lane changes are executed when the drivers are not satisfied with the driving situation in the current lane and for instance wish to gain a speed advantage.
There is a general lack of real-road lane-change data for passenger cars, and particularly for heavy vehicles. This represents an important limitation to studies that use such data to develop and evaluate for example driver assistance systems (Toledo & Zohar, 2007). Based on real-road observations on a multi-lane Interstate Highway in the US, Toledo and Zohar (2007) modelled lane-change actions of heavy vehicles. They found that the duration of lane changes performed by heavy vehicles ranged from 1.1 s to 11.8 s (with a mean of 3.8 s, median of 2.9 s and SD of 2.4 s). No distinction between sizes of heavy vehicles were made. Toledo and Zohar (2007) also found that it took on average about one second longer to change lane to the right compared with to the left. They suggested that this finding might be related to the dimensions of heavy vehicles, as the drivers have a relatively limited field of view to the right as compared with to the left.
Moridpour et al. (2010; 2012) analysed a trajectory data set comprising 28 discretionary lane-change manoeuvres by heavy vehicles on two sections of two highways in California. The studied 28 heavy vehicles were over 10 m in length. The results suggest mainly that, regarding discretionary lane changes:
• Heavy-vehicle drivers move into the slower lanes to prevent obstructing the fast-moving vehicles (for example Fo) which approach from the rear.
• Heavy-vehicle drivers’ decision to change lane is highly influenced by a higher speed of the lead vehicle (Ld) in the destination lane in comparison with their own speed.
• Heavy vehicles’ speed is close to constant during a lane-change manoeuvre.
A more recent study by Zhao et al. (2014) analysed a large data set of 2 035 discretionary lane changes as well as 640 mandatory lane changes conducted by heavy vehicles. Manoeuvres to yield to vehicles entering the freeway on ramps from the right were selected to study mandatory lane changes, and lane changes to pass a slow lead vehicle were selected as a typical scenario for discretionary lane changes. Both the mandatory and the discretionary lane-change scenarios were lane-change events to the left. The analysis showed that mandatory lane changes were more aggressive in gap acceptance and lane-change execution than discretionary lane lane-changes.
16 ViP publication 2017-1 3.2.2. Lane-change accidents
Looking at the accident involvement of today's heavy vehicles, accident statistics from the US show that lane-change/merging crashes are most frequent, closely followed by rear-end crashes (Blower & Kostyniuk, 2007). Combinations-unit trucks (i.e. tractor-trailers) are more involved in lane-change crashes than passenger cars and single-unit trucks (Bie et al., 2013).
Sen et al. (2003) found that a large share (10%) of typical lane-change crashes involve trucks changing lanes and light vehicles going straight. In contrast, 4.7% of the crashes in this scenario involve the reverse combination, trucks going straight and light vehicles changing lanes. This is attributed to the fact that trucks are large vehicles, more likely to collide with a vehicle in an adjacent lane while moving over to the next lane.
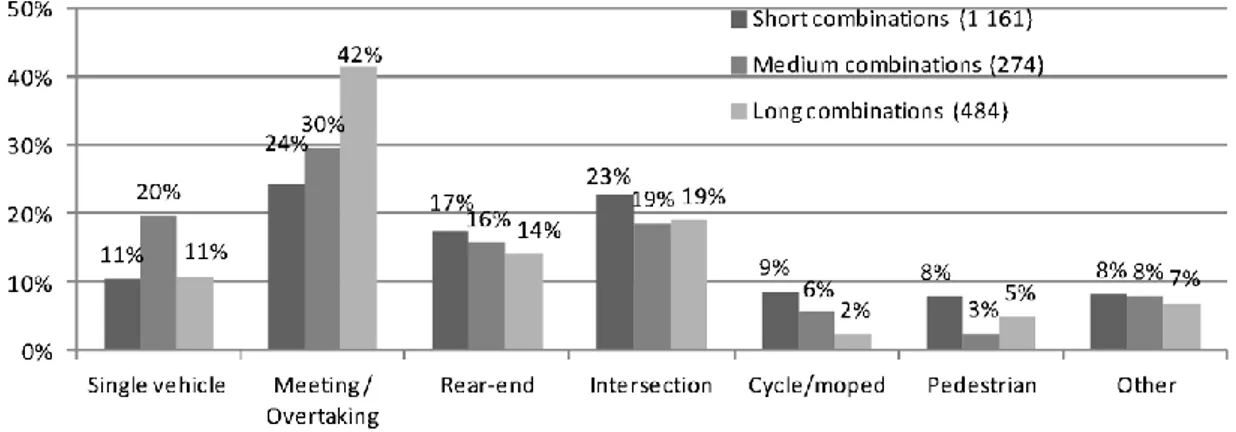
In Sweden, Bálint et al. (2014) analysed 2 290 accidents occurring between 2003 and 2012, and with at least one heavy vehicle involved and at least one person killed or severely injured (KSI)
(corresponding to 22.5% of all heavy-vehicle accidents). The results showed that “long” combinations (18.76 m to 25.25 m) had a lower rate of KSI accidents per 100 million vehicle kilometres travelled compared to “medium” (12.01 m to 18.75 m) and “short” (< 12 m) vehicles.
Bálint et al. (2014) made their analysis on police-reported accidents in the Swedish Traffic Accident Data Acquisition (STRADA). In STRADA, lane-change accidents are not categorized separately, but should be classified in the category overtaking accident (Larsson, 2007). Therefore, it is not possible to identify lane-change accidents and their share of heavy-vehicle accidents directly from STRADA. In addition, when Bálint et al. (2014) investigated the narratives from some accidents, they noted that in several cases there was an overlap between overtaking accident and oncoming accident. Together, these two types of accidents are the most frequent ones for heavy vehicles, especially within the “long” combination group (see Figure 5). In Figure 5 the accident types meeting (oncoming) accident and overtaking accident are combined because of the identified overlap between these two types of accidents.
Figure 5. Accident type distribution by length group for KSI accidents (not adjusted for exposure) (from Bálint et al., 2014).
3.3.
Summary and discussion
A lane-change manoeuvre is typically described by accepted gap at the initiation of the manoeuvre as well as duration of the manoeuvre and speed during the manoeuvre. Based on the literature review, there is a lack of real-world data regarding lane-change manoeuvres with heavy vehicles. The data that exist are collected mainly in the US and for discretionary lane changes with few exceptions, and no distinction between heavy vehicles of different sizes is made.
Regarding accidents involving heavy vehicles, the most comprehensive data are available in the US (Bálint et al., 2014). Studies on US accident data show that lane-change accident is one of the most frequent accident types when a heavy vehicle is involved. One study indicates that longer
combinations-unit trucks are more involved in lane-change accidents than passenger cars and single-unit trucks.
At European level, there is a general lack of useful and reliable accident data. For the purpose of this project more knowledge is required about lane-change accidents. Although STRADA is probably one of the best databases in Europe, it cannot be used to describe the nature of lane-change accidents and their share of heavy-vehicle accidents in Sweden.
18 ViP publication 2017-1
4.
Analysis of lane-change accidents involving heavy vehicles
reported in STRADA
This section describes Swedish Traffic Accident Data Acquisition (STRADA) and the authors’ attempt to identify, analyse and quantify lane-change accidents involving heavy vehicles in STRADA. When STRADA was introduced in 2003, accident types were given a consequence orientation. The reason for this was to couple the impact between the involved vehicles to the resulting damage and/or injuries. This means that accidents were primarily classified based on the vehicle trajectories before the impact. For example, overtaking, lane-change and rear-end accidents occur with vehicles travelling in the same direction, while oncoming accidents occur with vehicles travelling in opposite directions (see below). Moreover, an automatic classification of accidents based on these principles was applied at the launch of STRADA (Larsson, 2007). In addition to the parameterized accident data, accident sketches can be accessed through a web-client which requires special permit.
Overtaking and lane change
Accidents where the motor vehicles have been travelling on the same road, in the same direction and where one of the drivers either overtook or changed lane.
Rear end
Accidents where the motor vehicles have been travelling on the same road, in the same direction and where the rear vehicle catches up with the vehicle in front.
Oncoming
Accidents where the motor vehicles have been travelling on the same road, and in opposite travel directions.
4.1.
Method
The present investigation was made with the objective to identify lane-change accidents in which the colliding vehicles travelled in the same direction on the same road. Therefore, the category “oncoming accident” was excluded from the analysis. The category “rear-end accident” was included because it was assumed that the manner of collision may much resemble a lane-change accident (see Figure 2). The basis for the investigation was an “Excel-dump” from the STRADA database with in total around 10 500 police-reported accidents involving heavy vehicles from the years 2003–2013. Accidents of all severity levels were considered, i.e. fatal, severe, slight and property damage. Of these accidents, 995 had originally been categorized as overtaking and lane-change accidents and 4 617 accidents had been classified as rear-end accidents (Table 1).
The investigation method was based on the accident narratives where the accidents are described in a few sentences. As a first attempt, the narratives were searched for keywords that the reporting police might have used to describe a lane-change accident, for example “lane change”, “changing lanes” and similar words. It was soon realized, however, that words and expressions were not used in a uniform way across the narratives, and several accidents would be missed if a limited set of keywords were used. Therefore, it was decided that all narratives had to be read through (in total 5 612).
Before the investigation of the narratives, a preliminary list with alternative accident categories was defined. This list of categories and their definitions were refined and updated during the investigation of the first five hundred narratives. The final list of accident categories is shown in the leftmost column in Table 1. The first three categories describe manoeuvres associated with heavy vehicles and lane changes. The first two describe the same kind of manoeuvres, where a heavy vehicle changes lane towards the right and collides with a passenger car travelling in the destination lane. The difference between the two categories is whether it is a “certain” or a “possible” assessment based on the content of the narrative. A “certain” assessment means that this typical manoeuvre and resulting lane-change accident are clearly described. If it is a “possible” assessment, parts of the narrative describe the typical accident, but some details are missing to make an unambiguous interpretation. The third lane-change category includes those accidents in which a lane-lane-change manoeuvre is clearly described, but it is unclear which of the involved vehicles that made the lane change and/or in which direction. The next two categories are overtaking and rear-end accidents as they are defined in STRADA. The category “entering highway on entrance ramp” was defined after having encountered several accidents occurring during such situations, when either a heavy vehicle or a passenger car had entered a highway on an entrance ramp. The next category “merging on 2+1 road” was defined for the same reasons. In many cases, it was not possible from the narrative to understand the accident circumstances. These accidents were categorized as “unclear circumstances”.
In STRADA, the coordinates of the accident site are reported for each accident. The coordinates were translated into coordinates that could be shown in GoogleTM Earth (see Figure 7).
4.2.
Results
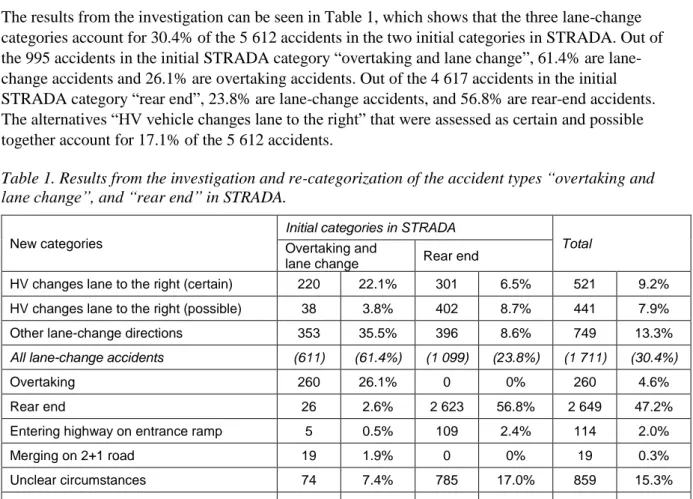
The results from the investigation can be seen in Table 1, which shows that the three lane-change categories account for 30.4% of the 5 612 accidents in the two initial categories in STRADA. Out of the 995 accidents in the initial STRADA category “overtaking and lane change”, 61.4% are lane-change accidents and 26.1% are overtaking accidents. Out of the 4 617 accidents in the initial STRADA category “rear end”, 23.8% are lane-change accidents, and 56.8% are rear-end accidents. The alternatives “HV vehicle changes lane to the right” that were assessed as certain and possible together account for 17.1% of the 5 612 accidents.
Table 1. Results from the investigation and re-categorization of the accident types “overtaking and lane change”, and “rear end” in STRADA.
New categories
Initial categories in STRADA
Total
Overtaking and
lane change Rear end
HV changes lane to the right (certain) 220 22.1% 301 6.5% 521 9.2% HV changes lane to the right (possible) 38 3.8% 402 8.7% 441 7.9% Other lane-change directions 353 35.5% 396 8.6% 749 13.3%
All lane-change accidents (611) (61.4%) (1 099) (23.8%) (1 711) (30.4%)
Overtaking 260 26.1% 0 0% 260 4.6% Rear end 26 2.6% 2 623 56.8% 2 649 47.2% Entering highway on entrance ramp 5 0.5% 109 2.4% 114 2.0% Merging on 2+1 road 19 1.9% 0 0% 19 0.3% Unclear circumstances 74 7.4% 785 17.0% 859 15.3%
20 ViP publication 2017-1 When the re-categorized accidents in Table 1 were used to re-distribute the shares of the accident categories among all 10 500 accidents with heavy vehicles involved, the top three accident categories became rear end (25%, corresponding to 2 649 accidents), single vehicle (18.6%, corresponding to 1 960 accidents as coded in STRADA), followed by lane change (16.3%, corresponding to 1 711 accidents). Among the investigated lane-change accidents, the truck had changed lane towards the right and collided with a passenger car, certainly in 521 accidents and possibly in 441 accidents. This corresponds to a share of 9% of all accidents with heavy vehicles involved (Figure 6).
Figure 6. The top three accident categories with heavy vehicles involved over all severity levels during the years 2003 to 2013. The shares are distributed after re-categorization of rear-end and lane-change accidents and should currently be interpreted with caution (n = 10 500).
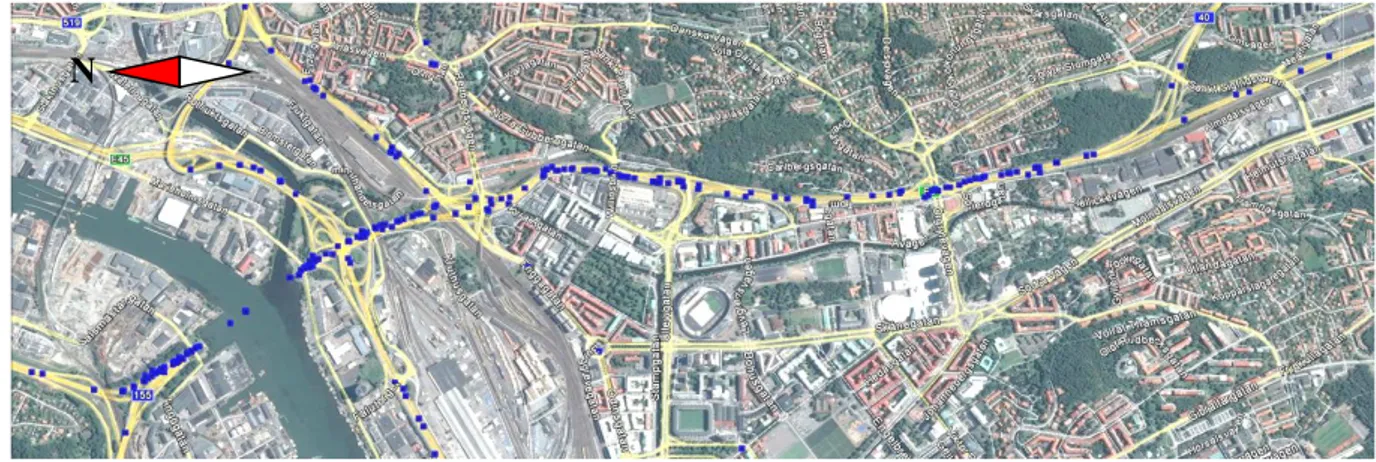
The coordinates for the accidents in the three lane-change categories in Table 1 and Figure 6 were translated into coordinates that could be shown in GoogleTM Earth, and plotted over Sweden. The
results showed that a clear majority of the lane-change accidents had occurred on multi-lane highways passing through the three largest cities in Sweden; Stockholm, Gothenburg and Malmö. Figure 7 shows an example from E6 passing through Gothenburg. Note that the satellite image is rotated 90 degrees counter clockwise, indicated by the compass needle in the Figure 7.
Figure 7. Lane-change accidents (blue dots) on E6 passing through the city of Gothenburg, Sweden, and involving heavy vehicles, during the years 2003 to 2013 (picture from GoogleTM Earth). The satellite image is rotated 90 degrees counter clockwise, indicated by the compass needle in the figure.
4.3.
Summary and discussion
The results indicated that in the STRADA category “overtaking and lane change”, 26.1% were overtaking accidents while 61.4% were lane-change accidents. In the category “rear end”, 56.8% were rear-end accidents and 23.8% were lane-change accidents. On the one hand, these results follow the consequence orientation in STRADA which gives priority to the vehicle trajectories before impact. On the other hand, lane-change accidents become hidden with the current STRADA system, and thus severely underestimated. In contrast, the number of rear-end accidents involving heavy vehicles may be overestimated. How much of this misclassification that depends on the automatic accident classification is difficult to say, but it is something that should be investigated further. In addition, there is also a risk that lane-change and rear-end accidents are underreported by the police. It is well known that the reporting rate of accidents falls with the level of injury severity (Hauer & Hakkert, 1988; Elvik & Mysen, 1999), and these two accident types are generally associated with light injuries (Sen et al., 2003). The low injury risk is probably related to the low relative impact velocity because the vehicles are travelling in the same direction. Despite a low injury risk, these accidents should be regarded as a traffic safety issue due to their numbers.
Because the investigation method involved reading the accident narratives, the results should be read with some caution. As there are apparently no guidelines for what information that should be included in a narrative in STRADA, valuable details are often missing. Nevertheless, the investigation showed that there are clear mismatches between what many narratives describe and how the accidents are categorized in STRADA.
To raise the certainty of the investigation, the accident sketches in the STRADA system would need to be examined. The accident sketches may have a greater chance of showing how one vehicle collided with another. Accessing and examining the accident sketches is however rather cumbersome. The sketches need to be searched manually for each accident in the web-client, where access requires special permit. It is estimated that the examination of one sketch would take around 2 minutes. It was not regarded reasonable to examine thousands of sketches within the present project.
22 ViP publication 2017-1
5.
Definition of the lane-change scenario
The definition of the lane-change scenario was based on the information from the previously reviewed literature regarding lane-change manoeuvres and accidents as well as the analysis of accidents in STRADA.
The overall purpose of the lane-change scenario was to study the commonly used parameters of: • The accepted gap between two vehicles in the adjacent lane at the initiation of the
lane-change manoeuvre.
• The duration of the lane change (from initiation to completion). • The speed behaviour during the lane-change manoeuvre.
As the scenario was not intended to be critical, Toledo and Zohar (2007) suggested based on on-road observation that it may be more challenging to change lane towards the right because of the limited field of view. The analysis of lane-change accidents in STRADA also indicated that such accidents are more frequent when heavy vehicles are changing lane towards the right. Therefore, the scenario was set up to study lane changes to the right destination lane(s).
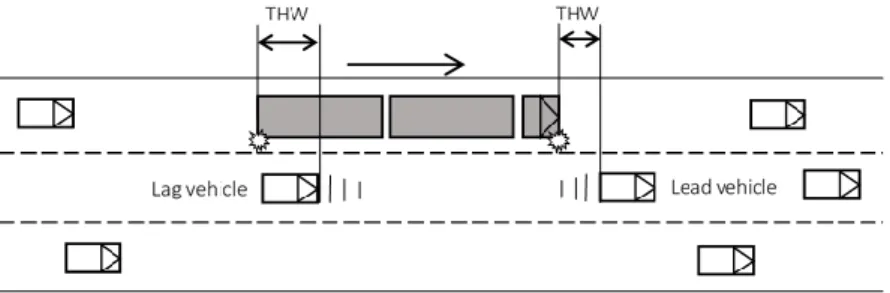
The resulting “gap-acceptance” scenario consists of two consecutive lane changes. Each lane change starts by the time the driver turns on the indicator. At this moment, the lead and lag vehicles in the lane to the right of the truck will start displacing to create a gap that the truck can fit into (Figure 8). With this set-up, the gap between the cars is considered accepted when the driver initiates the lane-change manoeuvre.
Figure 8. Illustration of the first lane change (to the right) out of two in the gap-acceptance scenario. When the driver turns on the indicator, the lead and lag vehicles in the lane to the right will start displacing to create a gap that the truck can fit into.
Because of the lack of on-road observations of how surrounding vehicles behave when a heavy vehicle changes lane (Toledo & Zohar, 2007), values for the time headways (THW) relative to surrounding vehicles had to be estimated for the scenario. To study lane-change manoeuvres in slightly different conditions, different THWs were implemented in the two consecutive lane changes (Table 2).
Table 2. The setting of the initial and target time headways (THW) for lead and lag vehicles during the first and second lane change.
Lane change
Initial THW (s) Target THW (s)
Lead vehicle Lag vehicle Lead vehicle Lag vehicle First 0.4 0.3 2.3 -3.0 Second 0.35 0.7 0.9 -3.0
At the indicator onset in the first lane change, the lead vehicle travelling in front of the tractor in the destination lane will accelerate from a THW of 0.4 s to create a target THW of 2.3 s between its rear and the front of the tractor. In the second lane change, the lead vehicle will accelerate from a THW of 0.35 s to a THW of 0.9 s. This shorter THW of 0.9 s to the lead vehicle in the second lane change was intended to create a tighter, but not critical, gap. The lag vehicle behind the truck will decelerate from a THW of 0.35 s in the first lane change, and a THW of 0.7 s in the second lane change, to generate a target THW of -3.0 s between the rear of the truck and the front of the lag vehicle in both the first and second lane change (Table 2).
Once the truck enters the destination lane, the lead vehicle will no longer track a THW as a means of controlling its displacement. The lead vehicle will instead set its speed either to the current speed of the truck plus 3.6 km/h or to 62 km/h, whichever yields the lowest value. These speed settings for the lead vehicle was implemented to ensure that the truck driver would always drive as close as possible to the speed limit (70 km/h) since the lead vehicle slowly creates some slack for the truck if the latter is driving slower than the intended speed. Thus, the maximum speed for the lead vehicle was after some elaboration set to 62 km/h so that the scenario would work for situations where drivers were driving at a comfortable speed below the speed limit of 70 km/h.
To add some realism to the experiment, several additional surrounding vehicles were implemented and adjusted their relative positions and speeds to the simulated heavy vehicle.
24 ViP publication 2017-1
6.
Simulator experiment
6.1.
Purpose of simulator experiment
There were two main purposes of the simulator experiment. Firstly, to evaluate the scenario in terms of accepted gap, lane-change duration and speed behaviour during lane change. Secondly, to study whether these parameters were affected by the length of heavy vehicles.
Furthermore, it was decided to study mandatory lane changes as they may be more aggressive in gap acceptance and lane-change execution than discretionary lane changes (Zhao et al., 2014).
6.2.
Method
6.2.1. Driving simulator
The experiment was conducted in the advanced moving-base driving simulator Sim IV (Jansson et al., 2014), located at VTI in Gothenburg, Sweden. In Sim IV, the heavy-vehicle mock-up is a Volvo FH12 where the left-hand side and right-hand side mirrors are replaced with LCD screens. The motion system, delivered by Bosch-Rexroth, combines the possibilities of a hexapod motion base and an extended motion envelope in x- and y-direction through a 5x5 m sled system. The visual system gives the driver a 210 degrees forward field of view. Sound, simulating the own vehicle and the directional sound of surrounding traffic, is presented via a 6.1 speaker system integrated in the truck cabin. An electric motor is installed on the steering-wheel column to present feedback torque to the driver. 6.2.2. Vehicle models
High-fidelity models of a tractor semi-trailer and an A-double combination were used to emulate the vehicle dynamics (Figure 9). The tractor (two axles) plus semi-trailer had a combined length of roughly 18.75 m and a weight of 40 tonnes. The A-double consisted of a tractor (three axles) and three towed units (semi-trailer, dolly and semi-trailer in that order), with a total length of 32 m and a weight of 80 tonnes. For more details of the A-double model see Nilsson et al. (2014b). In the present project and prior to the experiment, the performance of both vehicle models was validated against real-world measurements. To improve the realism further, the motion cues generated by the driving simulator were tuned with the help of professional test drivers.
Figure 9. The two vehicle types used in the simulator experiment. To the left an 18.75-meter long tractor semi-trailer combination (Picture: Mostphotos), and to the right a 32-meter long A-double combination (Picture: www.duo2.nu).
6.2.3. Driving route
The experiment was performed on a one-way multi-lane route consisting of sections of the roads E20, E6 and RV40, from Olskroksmotet to Kallebäcksbacken in Gothenburg, see Figure 10. This driving route was chosen for three reasons. Firstly, driving the route from the starting point to the end point (Figure 10) requires two consecutive lane changes on a road section that is rather limited in length. This leads to a realistic incentive for the two consecutive lane changes. Secondly, lane-change
accidents involving heavy vehicles frequently occur on the E6 road section (see Chapter 4.2 and Figure 7). Thirdly, the used roads had recently been modelled in the former ViP project Known Roads (Nåbo et al., 2015). The modelled roads were based on real-world measurements from GPS and map data as well as local road characteristics in terms of cross slope, incline and shorter vertical wave length data (not vibrations). Accurate height information on the surroundings and generic man-made structures were added to the graphic model.
Figure 10. Illustration of the driving route used in the experiment, based on a real road. The number of lanes (in the driving direction) of each road is represented by blue lines. Connecting lanes are represented by blue dashed lines. Each driving session started on road E20 at position 1. At position 2 the drivers reached the entrance ramp to road E6. At position 3 the drivers entered road E6 in the leftmost lane (because of the road design) and surrounding traffic appeared. At position 4 the drivers reached the exit ramp in the rightmost lane and at position 5 the experiment was ended. The lane-change events were carried out on road E6 between positions 3 and 4. The distance between positions 3 and 4 was 2.5 km (from Nilsson et al., 2017a).
The total length of the driving route was 3.7 km, and all included road sections had a lane width of 3.5 m. All lane-change events were carried out on the E6 road section. The driving started on the two-lane road E20 close to Olskroksmotet in a southerly direction (Figure 10 position 1). The sign-posted speed limit was 70 km/h. After about 0.6 km the subject vehicle reached a single-lane entrance ramp and the speed limit was reduced to 50 km/h (Figure 10 position 2). Just before the drivers entered the three-lane road E6 in the leftmost three-lane, surrounding traffic started to appear from behind in the two adjacent right lanes. When the first of the surrounding vehicles in the closest adjacent right lane passed the subject vehicle, it changed lane to the left (into the subject vehicle’s lane) and shifted to speed-control mode (set speed 50 km/h). This occasion coincided with the subject vehicle entering road E6 (Figure 10 position 3), and when the distance to the target exit ramp (at position 4 in Figure 10) was 2.5 km. About 200 m after entering road E6, the speed limit increased to 70 km/h. When driving on road E6, the subject vehicle had to perform two lane-change manoeuvres to the right to reach the target exit ramp in the rightmost lane (Figure 10 position 4). Each change manoeuvre represents one lane-change event in the experiment set-up. When the subject vehicle reached the exit ramp, the driving continued for another 0.8 km before the drivers of the subject vehicle were instructed to stop (Figure 10 position 5).
6.2.4. Participants
Participants were recruited from VTI’s database of professional truck drivers, through advertisement, and via personal contacts.
In total 18 drivers with truck driving license participated in the experiment, whereof 15 were, or had been, working as professional truck drivers. Two participants were Volvo GTT employees and two participants were truck-driving instructors. The participants included 17 men and one woman with an
26 ViP publication 2017-1 average age of 46.3 years (SD = 10.5 years). Their annual average mileage was 56 000 km, ranging from 10 000 to 200 000 km.
Four of the participants regularly drove tractor semi-trailer, nine participants drove rigid trucks and eight participants drove truck and trailers. None of the participants had driven an A-double or any other long vehicle combination.
6.2.5. Experiment set-up
The simulator experiment had a within-subject design, i.e. all participants drove both vehicle types through the experiment set-up. Also, all participants started with the tractor semi-trailer for two reasons. Firstly, the current experiment was part of a larger simulator study (see Nilsson et al., 2017b for more details). Secondly, changing between the high-fidelity truck models required a full stop of the simulator (the drivers waited in the stationary simulator while the truck models were changed in the software). So, to save time in the whole experiment, it was decided to minimize the number of truck model changes.
The experiment was divided in two parts: one training part and one part with the gap-acceptance scenario. The training part consisted of two braking exercises and three single lane-change
manoeuvres. The first two lane-change manoeuvres were towards the right and the last was towards the left. The lane changes were guided with cones, which flew up if they were hit. The purpose of the training was that the participants should get a sense of the vehicle dynamics of the tractor semi-trailer and the A-double in the simulator. Exactly the same training manoeuvres were conducted with both vehicles. When the training was completed, there was a short break.
After the training, the simulator vehicle was placed in position 1 in Figure 10, and the driver’s task was to reach the exit ramp at position 4. Upon completion of the driving task, the participants were asked to fill in a questionnaire about their experience of the lane-change scenarios, assessment of scenario hazardousness and their own performance (see Appendix).
6.2.6. Data collection
Simulator data were logged to accurately represent driver manoeuvres, position and speed of the heavy vehicle as well as information about surrounding traffic relative to the simulated heavy vehicle. The participants were asked to fill in a questionnaire about their experience of the lane-change scenarios (for example by using the Self-Assessment Manikin (SAM); Bradley & Lang, 1994), assessment of scenario hazardousness and their own performance, as well as simulator realism (see Appendix). 6.2.7. Analysis
The simulator log data were analysed around the time of the lane changes. The following variables were retrieved for each lane change:
• The lead and lag gaps measured as time headways (THW) at lane-change initiation. • The heavy vehicle’s velocities at lane-change initiation and completion.
• The duration between lane-change initiation and completion.
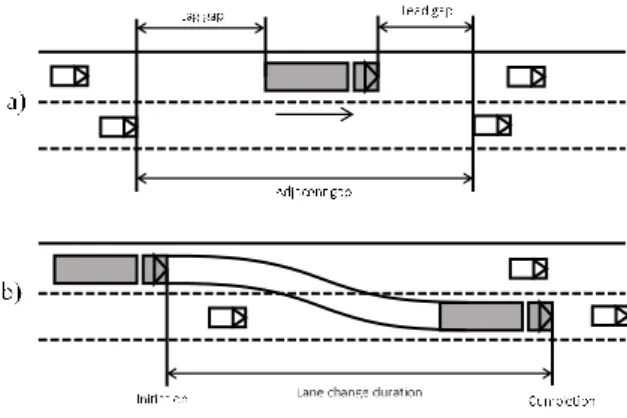
According to Toledo and Zohar (2007) and Bie et al. (2013), the initiation and completion points of a lane change should be defined as the time instances when the lateral movement of the subject vehicle begins and ends, respectively. The lane-change duration is the time lapse between its initiation and completion (Figure 11). Accordingly, in the present experiment, lane-change initiation was defined as when the heading angle of the tractor towards the destination lane exceeded a margin value of 0.002 rad. Similarly, lane-change completion was defined as the occasion when the heading angle of the last
vehicle unit towards the destination lane was higher than a margin value of 0.002 rad for a time duration longer than 1 s.
Figure 11. a) Gap acceptance in a lane change. Both the lead gap and the lag gap have to be accepted. b) Initiation and completion of a lane change represented by the start time and end time of the lateral movement, respectively. The lane-change duration is the time lapse between its initiation and completion (based on Bie et al., 2013).
Paired t-test were used to analyze data. A two-tailed p-value lower than 0.05 was considered statistically significant.
Answers from the questionnaire (see Appendix) were compiled and analysed.
6.3.
Results from the simulator experiment
6.3.1. Lead and lag gaps
The following results are based on data from 17 participants, as the data from one experiment session were corrupt.
Table 3 and Table 4 show the lead and lag gap, respectively, at the initiation of the first and second lane change, for the tractor semi-trailer (Semi) and the A-double (LVC). The lead and lag gaps were measured as time headways (THW) in seconds, as defined in Figure 8. No statistically significant (p<0.05) differences were found, neither between the first and second lane change carried out with the same vehicle nor within the first and second lane changes carried out with different vehicles.
Regarding the first lane change, Table 3 shows that the mean lead THWs for both vehicles (Semi = 0.80 s and LVC = 0.93 s) were within the lead vehicle’s target THW of 2.3 s as set for the first lane change in the scenario definition. In the second lane change, the mean lead THWs for both vehicles (Semi = 0.91 s and LVC = 0.77 s) were close to the lead vehicle’s target THW of 0.9 s as set for the second lane change. A measured THW above 0.9 s indicates that, during the lane change, the participants first braked and then steered, or braked and steered at the same time, within a very short period. The maximum lead THWs (Semi = 1.50 s and LVC = 1.37 s) were higher than 0.9 s for both vehicles. A closer examination of the measured THWs revealed that the lead THW was higher than 0.9 s in five instances for each vehicle, i.e. in 10 instances in total. This indicates that the participants in these 10 instances braked and then steered, or braked and steered at the same time.
Regarding the first and second lane change, Table 4 shows that the mean lag THWs were all within the lag vehicle’s target THW of -3.0 s. It can be noted that three out of four maximum THWs have small positive values, indicating that in these instances the participant initiated the lane change just before the lag vehicle was completely behind the last trailer.
28 ViP publication 2017-1
Table 3. Lead gap at lane-change initiation measured as time headway (THW) between the front of the truck and the rear of the lead vehicle.
Lane
change Vehicle
Lead gap THW at initiation (s) Mean Median SD Min Max First Semi 0.80 0.54 0.69 -0.09 2.14 LVC 0.93 0.92 0.45 0.18 1.67 Second Semi 0.91 0.89 0.29 0.55 1.50 LVC 0.77 0.73 0.38 0.20 1.37
Table 4. Lag gap at lane-change initiation measured as time headway (THW) between the rear of the truck and the front of the lag vehicle.
Lane
change Vehicle
Lag gap THW at initiation (s) Mean Median SD Min Max First Semi -1.07 -1.07 0.68 -2.84 0.04 LVC -0.77 -0.76 0.46 -1.35 -0.06 Second Semi -0.81 -0.66 0.58 -2.10 0.38 LVC -0.67 -0.65 0.52 -1.61 0.16
6.3.2. Velocities at lane-change initiation and completion
Table 5 shows the velocities at the initiation and completion associated with the first and second lane change, respectively, divided for the tractor semi-trailer (Semi) and the A-double (LVC). At the initiation of the first lane change, the velocity of the LVC (M = 15.3 m/s) was statistically different (p<0.05) from the other velocities. No other statistically significant differences were found.
Table 5. Velocity at lane-change initiation and completion.
Lane
change Vehicle
Velocity at initiation (m/s) Velocity at completion (m/s) Mean Median SD Mean Median SD First Semi 18.2 18.1 1.77 19.0 19.0 1.34 LVC 15.3 14.7 2.30 17.7 17.8 2.25 Second Semi 17.3 18.8 2.31 17.6 18.5 2.25 LVC 17.4 17.3 1.78 17.5 17.9 2.23 6.3.3. Lane-change duration
Table 6 shows the lane-change duration, i.e. the time between the initiation and completion of the lane change measured as deviation of heading relative to the road, modified for the last axle.
There was a statistically significant (p<0.05) difference in lane-change duration between the tractor semi-trailer (Semi) and the A-double (LVC) in the first lane change (paired t(16) = 3.10, p = 0.01). There was also a notable difference in lane-change duration between the vehicles in the second lane change, but this difference was not statistically significant (paired t(16) = 2.08, p = 0.054). No other statistically significant differences were found.
Table 6. Duration of lane change between its initiation and completion.
Lane
change Vehicle
Lane-change duration (s)
Mean Median SD Min Max First Semi
8.42 7.43 2.38 5.27 12.70 LVC 10.40 10.10 2.42 5.41 14.90 Second Semi 8.99 9.50 3.23 3.47 16.50 LVC 10.60 10.50 1.96 7.85 16.30
6.3.4. Questionnaires and driver comments
This section describes the results from the questionnaires, beginning with the participants’ experience of carrying out lane changes in the gap-acceptance scenario with two different vehicles.
The ratings on the SAM scale of positive vs negative emotions during the lane changes were below average for both the tractor semi-trailer (M = 3.3; median = 3.0; SD = 1.9 on the scale from 1 = positive to 9 = negative) and the A-double (M = 2.89; median = 2.0; SD = 2.0). The ratings of the active vs passive/calm emotions were above average for the tractor semi-trailer (M = 5.8; median = 6.0; SD = 2.1 on the scale from 1 = positive to 9 = negative) as well as the A-double (M = 7.3; median = 7.5; SD = 1.6).
The experienced hazardousness of the lane changes was rated as below average (M = 3.2; median = 3.0; SD = 1.8 on the scale from 1 = not risky at all to 7 = very risky) associated with the tractor semi-trailer and the A-double (M = 2.89; median = 2.0; SD = 1.45).
The self-rated handling of the lane changes was just above average (M = 4.9; median = 5.0; SD = 1.3 on the scale from 1 = very bad to 7 = very good) associated with the tractor semi-trailer and the A-double (M = 5.7; median = 6.0; SD = 0.75).
The realism of the lane changes was also rated just above average (M = 4.6; median = 5.0; SD = 1.2 on the scale from 1 = not realistic at all to 7 = very realistic). The general realism of driving in the
simulator was rated above average (M = 5.4; median = 6.0; SD = 1.3 on the scale from 1 = not realistic at all to 7 = very realistic). Some participants mentioned a poor sense of speed and that the steering was too sensitive and not matching the movements of the simulated vehicle as in a real vehicle. Finally, common participant comments revealed that the tractor semi-trailer was perceived as very sensitive to brake and steering input as well as wobbly in comparison with the A-double, which felt more like a real heavy vehicle. Some participants mentioned the lack of a red lamp placed on the rear corner of the last trailer. Such a red lamp is used for keeping track of the rear of the trailer when performing lane changes and driving in curves, but did not exist on the simulated heavy vehicles. During the lane changes, the vehicles in the destination lane were by some participants perceived as being annoying and driving very slow.
30 ViP publication 2017-1
7.
Discussion of lane-change scenario and experiment
There were two main purposes of the simulator experiment. Firstly, to evaluate the properties of the developed scenario in terms of accepted gap, lane-change duration and speed behaviour during mandatory lane changes. Secondly, to study whether these parameters were affected by the length of heavy vehicles. Below, the properties of the scenario are discussed based on the results from the experiment.
The scenario was designed in the form of a “gap-acceptance” scenario, implying an acceptance of both the lead gap and the lag gap. Furthermore, it was decided to study mandatory lane changes as they may be more aggressive in gap acceptance and lane-change execution than discretionary lane changes. Regarding the lead gap, the results showed no significant lead gap differences between any of the vehicles or lane changes. Therefore, the overall average lead gap for both vehicles can be estimated to 0.85 s. Likewise, there were no significant differences in the lag gap between any of the vehicles or lane changes. Thus, the overall average lag gap for both vehicles can be estimated to 0.83 s. There is a lack of real-world data with which to directly compare the gaps measured in the present experiment, especially for mandatory lane changes in high driving speed. One exception is Zhao et al. (2014) who analysed both discretionary and mandatory lane changes in speeds ranging from 88 to 100 km/h. Their mandatory lane changes were however selected from manoeuvres where the heavy vehicles had to yield (to the left) for vehicles entering a freeway from the right side, and only the lag gaps were analysed. Moreover, Zhao et al. (2014) reported the gaps in terms of “range” or space headway (SHW), while the present study reports them in time headway (THW). Their results indicated that the probability of mandatory lane changes increases as the lag SHW increases, up to a lag gap of around 15 m. After that, the probability of a lane change saturates and depends mainly on traffic density. Moridpour et al. (2012) reported both lead and lag gaps in terms of SHW for heavy vehicles exceeding 10 m, however for discretionary lane changes in slower driving speeds (on average 27 km/h). The average lead gap was 15.28 m and the average lag gap was 31.58 m. The lag gap was measured from the front of the truck, so a vehicle length of at least 10 m needs to be subtracted from the lag gap for a comparison with the values presented by Zhao et al. (2014) and the present study. If we assume that the lane change in the present study was initiated at the speed of 17.3 m/s (see discussion below), then the lead SHW would be around 17.3*0.85 = 14.7 m and the lag SHW would be around 17.3*0.83 = 14.4 m. These values seem to be in the same range as the lead and lag SHWs reported by Zhao et al. (2014) and Moridpour et al. (2012), although considering that they are collected in slightly different settings.
Looking at the lead and lag gaps from the present study in more detail. In the scenario’s second lane change, the lead vehicle’s target THW was set to 0.9 s. A closer examination of the measured lead gap revealed that it was longer than 0.9 s in 10 instances in total. This indicates that in these 10 instances the driver must have reduced the speed rather significantly just before or during the lane change. The question is whether the drivers braked and then steered, or braked and steered at the same time. Nilsson et al. (2017b) analysed similar but more critical scenarios in more detail and found that the driver’s eye-movement behaviour, combined with the scenario set-up, meant that the steering and braking in general were separated. Further analysis is required to determine whether the same behaviour is involved in the less critical scenario.
A closer examination of the measured lag gap revealed that in three instances the drivers initiated a lane change just before the lag vehicle was completely behind the last trailer. This can possibly be explained in one out of two ways. The first explanation is that the drivers could not perceive the relative distance to the lag vehicle in the simulator’s right-hand side mirror. This may have been hampered by the lack of a red lamp placed on the rear corner of the last trailer, as mentioned by some
drivers. The second explanation is that the drivers perceived that the lag vehicle was decelerating, allowing for an early initiation of the lane change.
The velocities were overall relatively constant between the initiation and completion of the lane change, which is in accordance with real-world observations (Moridpour et al., 2012). At the initiation of the first lane change, however, the A-double’s average velocity (M = 15.3 m/s) was significantly lower than the velocities in the other three conditions. At the corresponding moment, the tractor semi-trailer’s average velocity was somewhat higher (M = 18.2 m/s). One possible reason for this is that the drivers were less accustomed at the initiation of the first lane change with each respective vehicle. Because all drivers started with the tractor semi-trailer, there is a probable order effect at play here. This reasoning is strengthened by the fact that the average velocities for both vehicles were between 17.3 and 17.6 m/s in the second lane change.
When it comes to the lane-change duration, there was a statistically significant difference between the tractor semi-trailer and the A-double in the first lane change. There was also a tendency of statistically significant difference between the vehicles in the second lane change. Assuming that the difference between the vehicles exists in both lane changes, the overall average lane-change duration can be estimated to 8.7 s for the tractor semi-trailer and 10.5 s for the A-double. This difference is in line with Aghabayk et al. (2011) who observed that the time needed to complete a lane-change manoeuvre increased with the size of the heavy vehicle on arterial roads and freeways. Their observations were however limited to heavy vehicles up to 12 m in length. The lane-change durations obtained in the present study are in the upper part of the duration range 1.1 to 11.8 seconds (M = 3.8 s) that Toledo and Zohar (2007) estimated. However, these authors made no distinction between heavy vehicles of different sizes. Zhao et al. (2014) found that the duration for discretionary lane changes was 6.24 s, and for mandatory lane changes 5.84 s. In addition, Toledo and Zohar (2007) found that lane changes to the right took one second longer, and therefore suggested that such a manoeuvre requires more effort.
Consequently, it is probable that the average lane-change duration 8.7 s of the tractor semi-trailer in the present study is somewhat longer than would be the case in real traffic. One reason for this may be that the drivers drove the tractor semi-trailer more cautiously in the simulator because they, according to their comments, perceived the tractor semi-trailer as rather sensitive in lateral direction. Thus, more effort in tuning the vehicle model and motion cueing would have been necessary prior to the
experiment.
The A-double’s estimated lane-change duration of 10.5 s seems to be in accordance with the real-world measurements by Nilsson et al. (2014a), which were 10 s or longer. In that study, a professional driver carried out the lane changes and the authors pointed out that the long lane-change durations were necessary to maintain lateral stability. The equivalence of the durations indicates that the drivers in the simulator took the vehicle dynamics, and particularly the lateral stability, into consideration when performing the lane changes with the A-double. Such subtle vehicle dynamics are made possible in an advanced full-motion simulator with high-fidelity vehicle models.
According to the questionnaires, the drivers found it easier to carry out the lane changes with the A-double in comparison with the tractor semi-trailer. Moreover, the drivers felt that the lane changes involved a low risk, and their ratings on the SAM scales showed that their emotions during the lane changes were in the positive and calm directions. While the lane changes were performed easily by the drivers with both vehicles, the realism of the lane changes was rated just above average. The realism was to some extent restrained by the rather complicated scenario set-up involving two consecutive mandatory lane changes. The general realism of driving in the simulator was rated higher.