ISSN 0347-5049
VTIsärtryck
178
1992
Traffic Accident Analyses and Perceptual
Issues
Rein Schandersson
Reprint from Vision in Vehicles, Fourth International Conference,
University of Leiden, The Netherlands, 27 29 August 7997
Veg-och Traf1/r-
Statens väg- och trafikinstitut (VTI) . 581 01 Linköping
ISSN 0347-6049
VTIsärtryck
1992
178
Traffic Accident Analyses and Perceptual
Issues
Rein Schandersson
Reprint from Vision in Vehicles, Fourth International Conference,
University of Leiden, The Netherlands, 27 29 August 1991
w Väg-och Trafik-
Statens väg- och trafikinstitut (VT!) . 587 01 Linköping
TRAFFIC ACCIDENT ANALYSES AND PERCEPTUAL ISSUES R SCHANDERSSON
Swedish Road and Traf c Research Institute, 5-581 01 Linköping, Sweden
The purpose of quantitative accident analyses is often to show relationships
between accidents or accident risk (rate) and different road or external factors. These are often dif cult to explain at the macro level, but might serve as a basis for hypotheses about different aspects of driver behaviour.
Two examples are investigations of accident rate variation with pavement
surface wear and with amount of rainfall. One shows that traf c safety is higher on roads with worn surfaces. The other indicates that although heavy rainfall increases the accident risk, small amounts of rain might actually decrease the accident rate compared to dry conditions.
These results are not satisfactorily explained by differences in speed. Most
likely there are also other aspects of driver behaviour that are important
-aspects related to driver vision and behaviour. 1. INTRODUCTION
Accident analyses at the macro level sometimes lead to results that are dif cult to
explain satisfactorily - at least within this research approach.
The two investigations discussed below are of that category. They treat accident rate
(i.e. number of accidents divided by vehicle mileage) variation with pavement surface
conditions and rainfall. These variations are dif cult to explain fully with macro level
models. Therefore questions are raised related to perception, stimuli processing, cognition, car driver behaviour, risk compensation etc. From the results hypotheses can be formed related to these issues.
2. THE TWO INVESTIGATIONS
Both investigations (Schandersson 1989, 1991a; l991b) used similar approaches. Road
and traf c data for homogenous road sections were matched with data on casualty accidents reported by the police and with meteorological data. The analyses were based on day-by-day data on traf c ows, accidents, temperature and precipitation for each road section.
Junctions were excluded in both investigations and the road sections were pre dominately (85%) rural. With few exceptions the accidents involved only cars.
2.1 Accident rates on roads with different road surface wear.
A common opinion is that resurfacing increases traffic safety. Such results have been reported (Sabo and Hauer, 1987), but also opposite results (Kallberg and Beilinsson, 1983) and varying ones (Craus, Livneh and Ishai, 1990) are known. Lately it has been more widely accepted that resurfacing actually leads to more accidents (TRB, 1987).
In a joint Nordic research project (Hemdorf et al., 1989) traffic safety was investigated
for roads with different pavement surfaces. One part of the project dealt with the accident rate for different surface wear (Schandersson 1989, 1991a).
The purpose was to show accident rate variation in different weather conditions on rural
roads with different pavement wear (ruts, unevenness). Data from four Nordic countries were used (Denmark, Finland, Norway and Sweden).
Figure 1 shows the main result (based on 10914 road sections, 18567 kilometers, 2886 casualty accidents in 1982-1986, junctions excluded).
ACCIDEN' RATE (wc./100 million vohkm) | 5 14 _ | 3 | 2 | | O 0 0.- . .0 0 o 0 .
lo
$$: . . . .
55:
9 o...0.0. oto: ' '''''''''0.0.0 - ::. -: :-: :-0 0 0 , 0.0. 0.0.0 0:0:0 , a o.., ,0 0 '....o... .c 0 0 00 0 0 ... 7-00, 00.0 000,,. ---.0.0 . . . . 0 0 0 ""0 0 ... 00.0 ... ' 0 0 °°°°°° 6 o...0 0 000 ....0 0 '...', ...000 "-" 0 0 0 0 0 """""" 0 0 0 5 00.0 .0.0. 0 0 0.0. 0.0.0 1°?! 4 0 0 0 0 0 0 0 0 0 0 0 0 0 0 0 0 0 0 0 0 0 0 0 0 3 0 0 0 0 0 . . 0 0 0 0 0 2°20: 2 0.00 0.0.0 0.0.0 0°00 0.0.0 000.0 00.0 0 0 . 0000 , 0 0' 00 0 ' .:.z ::::2 ... 20:92 ... , 0 0 6° | 0 F G F some: common< -
> 0 mm
All clams
ensammen Pea on
Fig. 1. Accident rate (accidents per 100 million vehicle kilometers) for good(G) and
poorer(P) pavement surface conditions. Based on 2886 casualty accidents. The year in which a section was resurfaced could not be included in the data. Thus, both new and very worn pavement surfaces were excluded from analysis. Therefore
"Good" and "poorer" in gure 1 and below - should be interpreted as respectively
slightly worn surfaces and surfaces with considerable wear. The figure shows that
roads with poorer pavement surfaces than for those with good surfaces (9.9:I:O.5 vs. 10.6:t0.6 accidents/100 million vehiclekilometers with 95% con dence intervals).
* This difference is explained by the lower accident rate during days without precipitation (accident rates 8.6106 vs. 9.3i0.7) or with small or medium amounts (accident rates 10.9:t:O.8 vs. 11.9109).
* However, during days with more precipitation than 10 millimeters the accident rate is highest on the poorer pavement surfaces (14.4:t2.9 compared to
10.9:t2.8).
This pattern for the accident rate was consistent. With minor variations it was found for
the different countries, for different types of road, road widths, speed limits, average
daily traf c, pavement types etc. It was concluded that the accident rate variation
shown above was independent of any of the available road and traffic parameters.
By grouping the data into summer and winter, as well as into different temperature classes, it was possible to show that almost all the positive traf c safety effect for the poorer pavement surfaces was due to differences during summer and days during winter
with temperatures above +2° centigrade. The conclusion was drawn that the accident
rate pattern found is only relevant for bare road surfaces - i.e. periods without snow.
Figure 2 shows the results for such periods.
ACCIDENT RATE
(acc./100 million vohltm)
I5 14 O -D N U Å U O N I DO SURFACE CONDITION
< 0.1 mm 0.1 - 10 mm > 10 mm All cleans PRECIPI'I'ATION PER DAY
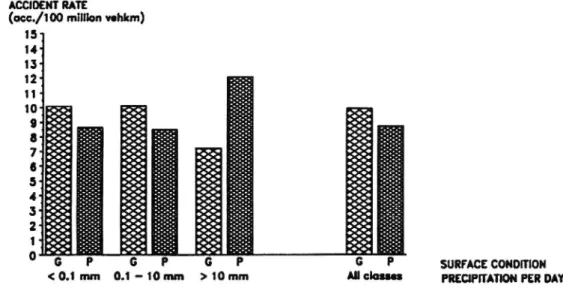
Fig. 2 Accident rate (accidents per 100 million vehicle kilometers) for good(G) and poorer(P) pavement surface conditions. Summer and winter periods with temperatures above +2° centigrade. Based on 1792 casualty accidents.
In gure 2 the highest precipitation class (> 10 mm) is based on few data - only 33 accidents on good surfaces and 66 on poorer ones leading to accident rates with large
95% con dence intervals: 7212.5 and 12.1:t2.9. The 95% con dence intervals for all
other bars in the gure are much smaller - between 0.5 and 0.9. A few additional results from the investigation ought to be mentioned:
* On poorer pavement surfaces a lower proportion of the accidents occurred in darkness or dusk. This could only be found for summer data.
* The injury consequences (number of injured or killed per accident) were less severe for roads with poorer pavement surfaces. This too could only be shown for summer data. Winter data showed the opposite.
Perhaps the most interesting result of the whole investigation is that the accident rate in
"normal" conditions (during days with very little or no precipitation) is 6-8% lower on
the poorer pavement surfaces for the whole year and as much as 12% during summer. To some extent this can be explained by lower speed levels on poorer surfaces, which is indicated by the lesser accident severity. However, many studies (e.g. Sakshaug, 1988;
Linderoth, 1981; Kolsrud and Nilsson, 1981) indicate that this difference in speed level
is less than 1-2 km/h. The accepted formula that the quotient between speed levels
squared equals the quotient between accident ratesl can only explain at the most half
the difference found - at least at speed levels of 90-100 km/h. Even tripling the speed level quotient would not be quite suf cient. There have to be other contributing factors as well.
Three such factors or mechanisms were proposed in the report:
* Pavement ruts "channels" the traf c and leads to less lateral variation both for individual vehicles and between vehicles.
* A worn pavement surface makes the driver more observant on the road surface. Perhaps headways increase to allow this.
* A worn pavement surface might increase driver attention in general leading to fewer accidents.
2.2 Accident rate during days with different rainfall
It is well documented that the accident rate is higher on wet roads than on dry ones
(OECD, 1976). It is also often assumed that the accident rate increases with increasing
rainfall. However, the shape of this relationship is not known.
A current investigation (Schandersson, 199lb) shows how the accident rate varies with
the amount of rainfall. A unique, very large data material has been used. Originally it
was compiled for other purposes. It comprises road data for almost all paved, rural
roads in Sweden during 1977-1980, supplemented with data on accidents during this period and detailed day-by-day data on traf c ows and weather conditions.
Figure 3 shows the main result. It is based on 7983 accidents in which persons were
injured during summer (May 1 to September 30) in 1977-80. Accidents at junctions were excluded. The vehicle mileage for these periods on the studied road sections was
60 billion vehicle kilometers.
ACCIDENT RATE
(acc./100 mllllon vohkms)
251
zo-j
o
5
1'0
1'5
z'o
2's
RAINFALL PER DAY (uu)
Fig. 3 The accident rate for days with different rainfall. 95% con dence limits are
indicated with bars. The two dashed lines indicate the con dence limits for the
accident rate during days without rain. Based on 7983 casualty accidents. As can be seen in the gure data were grouped into classes depending on rainfall per day: no rain at all, < 0.1 mm, 0.1-0.9 mm, 1.0-1.9 mm, 2.0-2.9 mm etc. This aggregation was made for the original investigations.
The gure shows that during days with heavy rainfall the accident rate is high - up to 40-50% higher than during dry days. For comparison the 95% confidence interval for the accident rate during dry days (the two dashed lines) has been drawn across the
gure.
The low accident rate during days with very light or medium rainfall should be noted. This rate is about 10% lower than during dry days.
The same pattern emerged when different subgroups were studied - eg. different road
types, speed limits, pavement types etc, even though the accident rate level of course
varied.
increasing rainfall and that there were proportionally more accidents in darkness during days with rainfall. The data also showed a weak tendency towards lesser accident severity during days with rain. The exceptions were days with heavy rainfall. Such days the average severity was about the same as for dry days.
There are investigations of speed levels on wet roads. Swedish results (Nilsson, 1984) show a reduction of 3-6 km/h on wet compared to dry road surfaces. It is likely that the difference is less between completely dry days and days with small rainfall. Few investigations exist of speeds in different rain intensities (mm per hour). A Swedish one
shows that the speed reduction is of the order of 5-6 km/h per millimeter rain per hour.
Although speed differences might have caused the lower accident rate for days with little rain, it is unlikely that they explain all of the difference. In uence from other
factors can be suspected also for these results.
Speeds cannot of course explain the high accident rate during days with heavy rainfall. The most likely causes are aqua planing and reduced visibility.
3. CONCLUDING REMARKS
One important comment about the two investigations is that the results are not directly
comparable. This is indicated by the different accident rate levels. In the rst investigation (the one which focused on pavement surface conditions) there were more major roads with, presumably, better road geometry. The second investigation also
covered minor paved roads - hence the higher accident rate levels.
Besides the results themselves, a couple of general points can be made. One is that aggregated data can conceal differences that may differ from the overall picture. In the rst investigation the overall result was a lower accident for worn pavement surfaces than for less worn. However, when data were differentiated by amount of rainfall per day it could be shown that the in uence of increasing rain was somewhat different. A point to keep in mind, though, is that the differentiated data still are aggregates -although at a lower level.
A second point is the dif culty to understand, or explain - at the macro level - the
phenomena showed by the two investigations. In the rst case it was shown that a
certain type of relationship exists between surface condition, rainfall and accident rate;
in the second the relationship was between rainfall and accident rate only. In both cases
a common explanation was tried - that differences in speed levels explain the
differences in accident rate.
There is suf cient knowledge about speed levels on roads with different surface conditions to state that speed levels alone do not explain the difference in accident rate
in dry weather. Probably not more than half the difference found can be explained this
way.
There is less knowledge about speeds on days with rain and without rain. On days with rain the road surface is also often dry some period(s). Therefore it is likely that speed differences are smaller than between wet and dry surfaces. If so, it is unlikely, althoug possible, that speed differences alone explain that the accident rate is lower on days with some rain compared to completely dry days.
One conclusion from the investigations is that other explanatory factors must be sought.
Naturally the interest turns both to how drivers see and experience the road and it's
surface in different weather and to driver behaviour.
Drivers adjust their speed slightly when driving on worn surfaces, in rain and on wet surfaces. The question is if (and which) other adjustments are made. Do drivers increase their distance to the vehicle ahead? Do they drive more straight (i.e. with less and/or smaller lateral variation)? The latter might possibly be the case both when visibility is reduced and when it is (possibly) enhanced by the longitudinal ruts on worn pavement surfaces. Of course it is also possible that the ruts act purely mecanically on the vehicle making it travel more straight.
The investigations indicate that driver compensation may result in maintaining the risk level (expressed as accident rate) or even lowering it somewhat during days with a little rain. During days with heavy rainfall, though, reduced driving speed and possible other adjustments do not suf ce to compensate for qualitatively different driving conditions (much reduced visibilty, risk for aqua planing etc).
There is need for better knowledge about driver behaviour in different driving
conditions, if we want to understand results such as those presented here. Measurements of traf c stream characteristics is one possibility, but in such studies it is often necessary to aggregate data to a level where explanatory power is lost. Studies of
individual driving in different weather conditions and on different types of road and
road surfaces are probably more useful contributions.
Hopefully the results of how the accident rate varies with pavement surface condition and rainfall can serve as "food for thought" for researchers specializing in human
factors and the vehicle driving process.
REFERENCES
Craus J., Livneh M. and Ishai I.: Effect of Pavement and Shoulder Condition on
Highway Accidents. Preprint of paper No. 890243 to 69th Annual Meeting of
Transportation Research Board in 1990.
Hemdorf, S. et al.: Trafiksäkerhet och vägytans egenskaper (TOVE). Slutrapport. V'l"I' Research Notes 1075, Esbo, 1989.
Kallberg V-P.
and Beilinson L.:
Kestopäällysten kuluneisuden vaikutus
liikenneonnettomuuksin. V'I'I' Internal Report 391, Esbo, 1983.
Kolsrud B. and Nilsson G. K.: Samband mellan vägyta och reshastighet. Etapp 2. Jämförelse mellan ytbehandling och massabeläggning. VTI Meddelande nr 277,
Linköping, 1981.
Linderoth U.: Samband mellan vägyta och hastighet. Etapp 1. Beläggningsunderhåll på hårt slitna vägar. VTI Meddelande nr 273, Linkö ping, 1981.
Nilsson, G.K.: "Undersökning av personbilars hastighet dels vid halt och dels vid torrt
väglag på vägar med hastighetsgränsema 90 och 110 km/h", VTI Meddelande 389,
Linköping, 1984.
OECD Road Research Report: Adverse Weather, Reduced Visibility and Road Safety,
Paris, 1976.
Sabo P. A. and Hauer E.: The Safety Effect of Resurfacing Rural Highways. Institute of Transportation Engineers. 12th Annual Meeting. Proceedings, 1987.
Sakshaug K.: Tra kksikkerheten og vegdekkets egenskaper (TOVE). Dekketilstandens innvirkning på hastigheten. Notat nr 617/88, SINTEF, Trondheim, 1988.
Schandersson, R.: Trafiksäkerhet och vägytans egenskaper (TOVE). VTI Meddelande
594, Linköping 1989.
Schandersson, R.: Road Surface and Safety in Proceedings. In Third European Workshop on Recent Developments in Road Safety Research, April 26-27, 1990. VTI
Report 366A, Linköping, 1991.
Schandersson, R.: Accident rate during days with different rainfall. (to be published in
the VTI Meddelande series).