INTERPRETING OVERALL INEQUALITY IN CHINA: THE ROLES OF PHYSICAL CAPITAL, HUMAN CAPITAL AND SOCIAL CAPITAL
Yuheng LI
Institute of Geographic Sciences and Natural Resources Research, Chinese Academy of Sciences
11A Datun Road, Chaoyang District, Beijing, 100101, China; liyuheng@igsnrr.ac.cn
Hans WESTLUND
Department of Urban Planning and Environment, Royal Institute of Technology (KTH), Stockholm, Sweden
Abstract:
This paper investigates the relationship between overall inequality in China and the contributions of physical capital, human capital and social capital. The investment in physical capital tends to enlarge overall inequality while human capital helps to reduce the inequality. Human capital appears to be more influential than physical capital in overall inequality reduction in the research period. Social capital (people’s social networks) however, does not seem to exert any impact on overall inequality in the post-reform era. Possible policy implications of these results are that measures should be taken to pursue more even distributed investment of physical capital and to increase people’s education in order to reduce overall inequality in China.
Keywords: Overall inequality, Capital investment, Economic growth, China JEL classification: D24, E22, E24
Acknowledgement:
The written of the paper was supported by the National Natural Science Foundation of China (Grant number: 41301190)
1. Introduction
Unlike the US, Japanese prefectures and European regions where convergence across regions occurs (Barro and Sala-i-Martin, 2003), China, however, provides a different case of which regional inequality has risen and varied in the past two decades (Khan and Riskin, 2001; Fan and Sun, 2008). The Gini coefficient in China is estimated to be 0.33 in 1980 and rose to 0.45 to 0.47 in recent years (Sisci, 2005; World Bank, 2006). Many studies have attributed Chinese regional inequality to many factors like factor endowments (Chen and Fleisher, 1996), urban-biased fiscal and monetary policies (Yang and Cai, 2000), regional policy which boosted capital investment in eastern provinces and open economic zones (Wei and Fan, 2000). Basically, the variation of regional inequality in China is deep rooted in the over three-decade fast Chinese economic growth ever since 1978 (Pei, 2006; Lee, 2007). It is the uneven distribution of economic growth among different regions/provinces that lead to the regional inequality. Thus, the driving factors to the economic growth would fundamentally influence the variation of regional inequality in China.
Generally, physical capital has been found to play a key role for the Chinese economy in the post-reform era (Chow, 1993; Urel and Zebregs, 2009). Human capital in terms of years of education has also been found to play an important role in the economic growth. It is believed that human capital contributes to technological improvement and innovation which can help to advance the economy (Wang and Yao, 2003; Kuo and Yang, 2008). The connection between social capital and economic development has been highlighted in a large number of studies over the last 15 years (Westlund and Adam, 2010). Particularly, with the declining of the relative importance of natural endowments for regional development and the convergence trend in human capital, social capital becomes increasingly important for economic growth (Mohan and Mohan, 2002). Thus, the different roles of the three capitals in economic growth across provinces would lead to regional inequality in China. The paper aims to interpret such
topic and provide implications for policy making to reduce regional inequality in China in the future.
2. Data and econometric framework
The paper focuses on the relationship between regional inequality and physical capital, human capital and social capital. In the benchmark model, we run fixed effect regression of panel data with Gini coefficient as the dependent variable and the three “capitals” as the main independent variable: it t it it it it
it Physical Human Social X
Inequality =
α
0 +α
1 +α
2 +α
3 +α
4 +λ
+ξ
WhereInequalityitis the measure of Gini coefficient of province i at year t.Physicalitis the investment ratio which represents physical capital,Humanitis the measure of human capital of province i at year t, proxied by student enrollment rate,Socialit is measure of social capital of province i at year t. X is a vector of control variables that influence economic growth: economic openness (Trade), measured by the ratio of export and import to GDP; FDI (foreign direct investment), measured by the ratio of utilized FDI to GDP; governmental expenditure (Gov), measured as the ratio of government budget expenditure to GDP; state ownership (Soe), measured by the share of state owned enterprises in total industry output value. These variables generate impact on the capitals’ efficiency and further influence the economic growth across provinces in China.
λ
it is the year effect andξ
it is an unobserved error term that varies across time and provinces. We collect data for 29 provinces in China from 1981 to 20101. Almost all the data are from National Bureau of Statistics (NBS). Table 1 reports the descriptive statistics for the main variables.Table1. Statistics of variables in the study
Variable Obs Mean Std.Dev Min Max
Inequality 870 2.431 0.809 0.261 4.759 Physical 870 0.435 0.124 0.153 0.982 Human 870 0.007 0.008 0.0004 0.064 Social 609 1.37 0.625 0.42 4.210 Gov 866 0.144 0.063 0.048 0.548 Soe 870 0.606 0.198 0.107 0.938 Trade 860 0.239 0.347 0.006 2.203 FDI 870 0.024 0.033 0.000005 0.243 There are no statistics of Gini coefficients at provincial level in China. Then, we need to find a suitable proxy for Gini coefficient. Yang (1999) argues that increases in urban-rural income differentials have been the main driving force behind the rising overall inequality in China. According to World Bank (1997), the urban-rural income gap is responsible for a third of total China’s inequality in 1995 and a half of the increase in inequality since 1985. Thus, we use urban-rural income differential to proxy Gini coefficient in each province. Following Putnam (2000), social capital has two main aspects: structural social capital (networks and associations) and cognitive social capital (attitudes and norms of behavior, shared values, reciprocity and trust). Thus, the measure of social capital consists of testing the public participation, social connections, general trust and social norms (Knack and Keefer, 1997). In this study, the measure of social capital covers the period 1990-2010. We only measure social capital at the principal level in China in terms of the number of associations for every 10,000 people to represent the structural capital of social networks and public participation. The association is a reciprocal organization constituted by people of common characteristics and non-profit and non-governmental are its fundamental features. Since there is no available data on provincial trust in the research period, we have no measure of cognitive social capital and therefore only examine the role of structural social capital in China.
3. Results and interpretation 3.1 The Benchmark Model
1
We do not include Chongqing and Tibet due to data availability. Taiwan, Hong Kong and Macau are not included either.
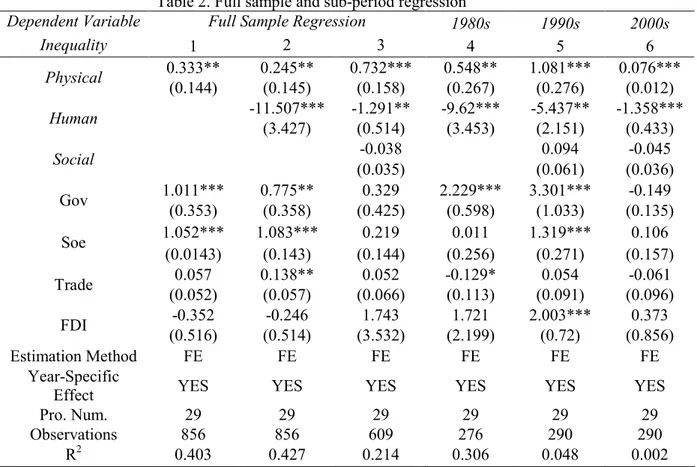
As results in Table 2 shows, the estimated coefficient of Physical is positive and significant at 1 percent level. Keeping other things unchanged, a one percentage point increase in Physical will result in a 0.732 percentage point increase in Gini coefficient. Human contributes to the decrease of Gini coefficient. Keeping other things unchanged, a one percentage point increase in Human will result in a 1.291 percentage point decrease in Gini coefficient. Social is, however, found insignificant in the full sample regression. Further regression shows that both
Physical and Human are significant in the three sub-periods. Besides, the coefficients of Human have been larger than that of Physical, indicating the more influential role of human
capital in the reduction of Gini coefficient in China. Social capital still presents no significance in the three periods.
Table 2. Full sample and sub-period regression
Dependent Variable Full Sample Regression 1980s 1990s 2000s
Inequality 1 2 3 4 5 6 0.333** 0.245** 0.732*** 0.548** 1.081*** 0.076*** Physical (0.144) (0.145) (0.158) (0.267) (0.276) (0.012) -11.507*** -1.291** -9.62*** -5.437** -1.358*** Human (3.427) (0.514) (3.453) (2.151) (0.433) -0.038 0.094 -0.045 Social (0.035) (0.061) (0.036) 1.011*** 0.775** 0.329 2.229*** 3.301*** -0.149 Gov (0.353) (0.358) (0.425) (0.598) (1.033) (0.135) 1.052*** 1.083*** 0.219 0.011 1.319*** 0.106 Soe (0.0143) (0.143) (0.144) (0.256) (0.271) (0.157) 0.057 0.138** 0.052 -0.129* 0.054 -0.061 Trade (0.052) (0.057) (0.066) (0.113) (0.091) (0.096) -0.352 -0.246 1.743 1.721 2.003*** 0.373 FDI (0.516) (0.514) (3.532) (2.199) (0.72) (0.856) Estimation Method FE FE FE FE FE FE Year-Specific
Effect YES YES YES YES YES YES
Pro. Num. 29 29 29 29 29 29
Observations 856 856 609 276 290 290
R2 0.403 0.427 0.214 0.306 0.048 0.002
Note: Standard errors are reported in parentheses. The symbols *, **, and *** indicate statistical significance at 10 percent, 5 percent and 1 percent levels, respectively.
3.2 Robustness check
3.2.1 Medium-term determinants
The paper constructs a panelthat contains non-overlapping five-year averages of the data for each province. By taking such measure, we are able to reduce short-term variations and identify the medium-term determinants of Gini coefficient. As Table 3 shows, the estimated coefficient of Physical is positive and significant at 5 percent level while Human presents negative significance at 10 percent level in the full sample regression. Then, both Physical and Human start to be significant since 1990s. The estimated coefficient of Human has been larger than that of Physical in the sub-periods. Social, however, presents no significance in the whole and sub- study periods. These findings are in high accordance with results in Table 2.
Table 3. Robustness check: Five year average
Dependent Variable Full Sample Regression 1980s 1990s 2000s
Inequality 1 2 3 4 5 6 0.708* 1.241*** 0.701** -1.781 2.519** 0.085** Physical (0.401) (0.347) (0.416) (1.42) (0.885) (0.048) -1.18* -1.282* -3.775 -17.48** -0.69* Human (0.845) (0.854) (84.48) (6.737) (0.37) -0.105 0.129 0.059 Social (0.072) (0.194) (0.088) 1.338* 1.079 1.088 1.957 -5.522* -1.532 Gov (0.802) (0.821) (0.823) (1.526) (4.695) (1.448) 1.189*** 0.605 1.272*** -0.587 -0.852 0.074 Soe (0.346) (0.406) (0.348) (0.789) (0.786) (0.359) 0.15 0.251 0.281 -0.231 0.491 -0.463 Trade (0.142) (0.159) (0.182) (0.45) (0.679) (0.386) -1.62 -1.506 -1.298 -1.408 1.427 2.777 FDI (1.345) (1.343) (1.403) (11.5) (3.247) (3.609) Estimation Method FE FE FE FE FE FE Year-Specific
Effect YES YES YES YES YES YES
Pro. Num. 29 29 29 29 29 29
Observations 174 174 172 56 58 58
R2 0.404 0.429 0.426 0.066 0.1 0.082
Note: Standard errors are reported in parentheses. The symbols *, **, and *** indicate statistical significance at 10 percent, 5 percent and 1 percent levels, respectively.
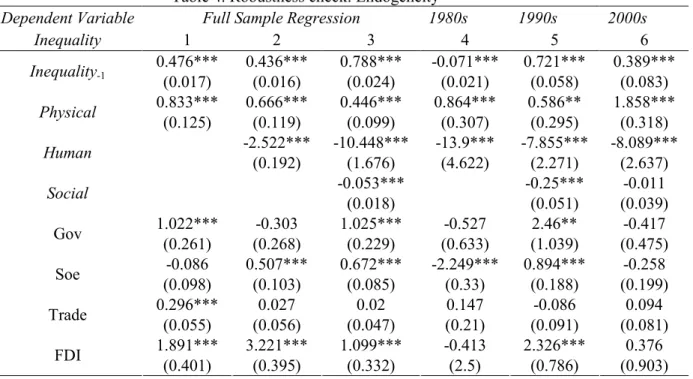
3.2.2 Endogeneity problem
To deal with the potential endogeneity problem, we employ a generalized-methods-of-moments (GMM) panel estimator for dynamic model. We estimate the model by using the lagged values in levels of all explanatory variables. Generally, both Physical and Human are significant at 1 percent level in the whole and sub- research periods. As Table 4 shows, physical capital contributes to the increase of Gini coefficient while human capital leads to the decrease of Gini coefficient. The estimated coefficient of Human is larger than that of
Physical in the whole research period. Social however, only presents negative significance in
the 1990s. The results of endogeneity check are also in line with the results in Table 2. Table 4. Robustness check: Endogeneity
Dependent Variable Full Sample Regression 1980s 1990s 2000s
Inequality 1 2 3 4 5 6 0.476*** 0.436*** 0.788*** -0.071*** 0.721*** 0.389*** Inequality-1 (0.017) (0.016) (0.024) (0.021) (0.058) (0.083) 0.833*** 0.666*** 0.446*** 0.864*** 0.586** 1.858*** Physical (0.125) (0.119) (0.099) (0.307) (0.295) (0.318) -2.522*** -10.448*** -13.9*** -7.855*** -8.089*** Human (0.192) (1.676) (4.622) (2.271) (2.637) -0.053*** -0.25*** -0.011 Social (0.018) (0.051) (0.039) 1.022*** -0.303 1.025*** -0.527 2.46** -0.417 Gov (0.261) (0.268) (0.229) (0.633) (1.039) (0.475) -0.086 0.507*** 0.672*** -2.249*** 0.894*** -0.258 Soe (0.098) (0.103) (0.085) (0.33) (0.188) (0.199) 0.296*** 0.027 0.02 0.147 -0.086 0.094 Trade (0.055) (0.056) (0.047) (0.21) (0.091) (0.081) 1.891*** 3.221*** 1.099*** -0.413 2.326*** 0.376 FDI (0.401) (0.395) (0.332) (2.5) (0.786) (0.903)
Estimation Method GMM GMM GMM GMM GMM GMM Year-Specific
Effect YES YES YES YES YES YES
Pro. Num. 29 29 29 29 29 29
Observations 798 798 551 218 232 224
Note: Standard errors are reported in parentheses. The symbols *, **, and *** indicate statistical significance at 10 percent, 5 percent and 1 percent levels, respectively.
4. Concluding remarks
The paper provides robust evidence of the roles of physical capital, human capital and social capital in the changing overall inequality in the post-reform China. The investment of physical capital which plays an important role in advancing Chinese economy for decades actually contributes to the increase of overall inequality. Human capital which helps to reduce overall inequality, has also appeared to be more influential than physical capital in the research period.
There are no findings showing either positive or negative significance of social capital to overall inequality in China. Although Li and Westlund (2013) finds positive contribution of social capital (people’s social networks) to Chinese economic growth in the 2000s, we think such economic role would finally transform into peoples’s collaboration in collecting investment and other supports in economic activities. Since people’s social connections in terms of their economic activities normally confine within certain area or region, thus its economic contribution across regions would present no big difference.
The implications for policy making lie in more even distributed physical capital investment, especially in the less developed provinces, and the continuous investment in people’s education which may generate lasting effect on economic growth. These measures can help to reduce the overall inequality in China in the long run.
References
Barro, R. and Sala-i-Martin, X. Economic Growth, Second Edition, Cambridge, MIT Press,2003.
Chen, J. and Fleisher, B.M. Regional income inequality and economic growth in China, Journal of Comparative Economics, 1996, 22: 141–164.
Chow, G.C., Capital formation and economic growth in China, Quarterly Journal of Economics, 1993,108:809– 842.
Fan, C.C. and Sun, M.J. Regional inequality in China, 1978-2006, Eurasian Geography and Economics, 2008, 49: 1-20.
Khan, A. R. and Riskin, C. Inequality and poverty in China in the age of globalization, Oxford, Oxford University Press. 2001.
Knack, S. and Keefer, P. Does social capital have an economic payoff? A cross-country investigation, Quarterly Journal of Economics, 1997,112: 1251–1288.
Kuo, C.C. and Yang, C.H. Knowledge capital and spillover on regional economic growth: Evidence from China, China Economic Review, 2008, 19: 594–604.
Lee, C.K., Against the Law: Labor Protests in China's Rustbelt and Sunbelt, Berkeley, Berkeley, CA, University of California Press, 2007.
Li, Y.H. and Westlund, H. Social capital and economic growth in China’s provinces, Chapter of “Social capital and rural development in the knowledge society”, Hans Westlund & Kiyoshi Kobayashi (Eds.) Cheltenham: Edward Elgar Publishing Limited, 2013,182-197. Mohan, G. and Mohan, J. Placing social capital, Progress in Human Geography, 2002, 26:191-210.
National Bureau of Statistics of China, Comprehensive Statistical Data and Materials on 60 Years of New China, Beijing, China Statistical Press, 2010.
National Bureau of Statistics of China, China Statistical Yearbook, Beijing, China Statistical Press, 2011.
Pei, M.X., China’s Trapped Transition: The Limits of Developmental Autocracy, Cambridge, Harvard University Press, MA, 2006.
Putnam, R.D., Bowling Alone: The Collapse and Revival of American Community, New York, Simon & Schuster, 2000.
Sisci, F., “Is China Headed for a Social Red Alert?,” Asia Times Online, October 20, 2005, [http://www.atimes.com/atimes/China_Business/GJ20Cb01.html].
Urel, B. and Zebregs, H. The Dynamics of Provincial Growth in China: A Nonparametric Approach, IMF Staff Papers, 2009, 56: 239-262.
Wang, Y. and Yu, Y.D. Sources of China’s economic growth 1952-1999: Incorporating human Capital accumulation, China Economic Review, 2003,14: 32-52.
Wei, Y.H.D. and Fan, C.C. Regional inequality in China: A case study of Jiangsu Province, Professional Geographer, 2000, 52: 455–469.
Westlund, H. and Adam, F. Social capital and economic performance: A meta-analysis of 65 studies, European Planning Studies, 2010, 6: 893–919.
World Bank, China 2020: Sharing Rising Incomes, Washington, World Bank, 1997.
World Bank, World Development Report, Equity and Development, Oxford, Oxford University Press, 2006.
Yang, D.T. and Cai, F., The Political Economy of China’s Rural-urban Divide, Working Paper, No. 62, Center for Research on Economic Development and Policy Reform, Stanford Univertsity, 2000, pp. 20.
Yang, D.T., Urban-biased policies and rising income inequality in China, American Economic Review Papers and Proceedings, 1999, 89: 306-310.