The Gender Wage Gap in Spain
An analysis of the impact of the financial crisis on
the gender wage gap distribution
By: Evelina Aleksandrova Arnaudova
Supervisor: Mats NilssonSödertörn University | Department of Economics Master’s Dissertation 30 credits
ABSTRACT
Equality is part of the European policy and legislation. However there are still evident signs of women being treated unequally in the labour market. The aim of the thesis is to answer the question if women are more vulnerable to economic shocks in terms of wage distribution. The focus will be on women in Spain in the context of the financial crisis of 2008. The thesis examines the evolution of the salary structure in the period 2002-2014 using the microdata of the Structural Earning Survey. The taste-based and the statistical discrimination theory are going to be described in order to explain the causes of gender wage discrimination. The methods applied in this paper are the Mincer method, which explains the human capital theory and the Oaxaca-Blinder decompositions, which separates the gender wage gap into explained and unexplained parts. The results from the study suggest that there is a decrease in the gender wage gap in Spain following the situation before and after the crisis.
2
TABLE OF CONTENTS
1. INTRODUCTION ... 4
2. FORMULATING THE PROBLEM ... 6
3. BACKGROUND AND EARLIER STUDIES ... 6
4. THEORIES OF DICRIMINATION ... 10
4.1. TASTE-BASED DISCRIMINATION ... 11
4.1.1. TASTE-BASED DISCRIMINATION FROM EMPLOYER´S POINTOF VIEW ... 11
4.1.2. TASTE-BASED DISCRIMINATION FROM CO-WORKERS´ POINT OF VIEW AND CUSTOMER´S POINTOFVIEW ... 15
4.2. STATISTICAL DISCRIMINATION THEORY ... 16
4.3. OVERCROWDING MODEL ... 17
5. THE FINANCIAL CRISIS IN SPAIN ... 18
5.1. THE IMPACT OF THE CRISIS IN SPAIN ... 19
5.2. COMBATING THE CRISIS ... 20
6. METODOLOGY ... 21
6.1. MINCER METHOD ... 21
6.2. OAXACA-BLINDER METHOD ... 23
7. DATA ... ………27
7.1. THE UNADJUSTED DATA ... 27
7.2. THE ADJUSTED DATA... 28
8. UNADJUSTED GENDER WAGE GAP ...31
8.1. RESULTS AND ANALYSIS FOR SPAIN ... 31
8.2. RESULTS AND ANALYSIS FOR ITALY AND SWEDEN...34
8.3. MAIN FINDINGS OF THE UNADJUSTED DATA ... 36
9. ADJUSTED GENDER WAGE GAP IN SPAIN ...37
9.1. RESULTS WHEN APPLYING MINCER METHOD TO THE SPANISH DATA ... 37
9.2. RESULTS WHEN APPLYING THE OAXACA-BLINDER METHOD TO THE SPANISH DATA ... 44
10. ANALYSIS OF THE RESULTS OF THE ADJUSTED DATA... 50
11. CONCLUSION ...54
3
LIST OF FIGURES
FIGURE 1 Taste-based discrimination ... 14
FIGURE 2 Unemployment male rate ... 33
FIGURE 3 Relationship between unemployment male rate and gender pay gap in Spain ... 34
FIGURE 4 Comparison between the simple and the extended model ... 43
LIST OF TABLES
TABLE 1 Earlier studies ... 8TABLE 2 Values of the Structural Earning Survey ... 30
TABLE 3 Gender pay gap in unadjusted form for Spain and EU-28… ... 31
TABLE 4 Participation rate in education and training in Spain ... 32
TABLE 5 Unemployment male rate ... 33
TABLE 6 Gender pay gap in unadjusted form for Italy and Sweden ... 34
TABLE 7 Employment participation rate for females... 35
TABLE 8 Simple model before the crisis ... 38
TABLE 9 Simple model after the crisis... 39
TABLE 10 Extended model before the crisis ... 40
TABLE 11 Extended model after the crisis ... 42
TABLE 12 Results of Oaxaca-Blinder method for 2002 ... 45
TABLE 13 Results of Oaxaca-Blinder method for 2006 ... 47
TABLE 14 Results of Oaxaca-Blinder method for 2010… ... 48
4
1. INTRODUCTION
Still, in the twenty-first century, gender issues are part of social inequality. Every day, women suffer from multiple forms of discrimination: in education, labour force participation, labour remuneration, decision-making process, access to justice (United Nations Human Rights, 2014). So far, no country in the world has fully closed the gender gap (World Economic Forum, 2014). The Charter of Fundamental Rights of the EU states explicitly that any discrimination based on religion or belief, disability, age or gender, shall be prohibited (European Parliament, 2016).
There is evidence of gender wage discrimination in almost all of the European countries, no matter how economically the country is or how much the labour market is regulated (European Commission, 2018). According to the European Commission (2017) gender pay gap is understood as the difference between average gross hourly earnings of male and female paid employees, expressed as a percentage of the former. It also explains that this gap considers three types of disadvantages women face: lower hourly earnings, working fewer hours in paid jobs and lower employment rates.
Despite the increasing percentage of women´s participation at work (being 39,2% according to the Wold Bank) and their relatively high level of education, inequalities between male and female employees in terms of gender wage gap and career choice, still remain (European Commision, 2013). The wage gender difference has been and still is a subject of numerous studies: Polachech (1981); Solberg and Laughlin (1995); Albetrecht (2000); Murillo and Simon (2013); Anghel (2018) . The aim is to answer questions about the size of the gap, the causes of the wage gap and the overall effects of this on society.
Globally, women remain less likely to participate in the labour market than men. The female labour participation rate is 26,5 percentage points below than the male participation (International Labour Organization, 2018). Many societies may still perceive women as economic dependents. In most countries they earn on average only 60 to 75 per cent of men´s wages. It is calculated that women could increase their income globally by up to 76 per cent if the employment participation gap and the wage gap were closed. (United Nation Women, 2014).
In Spain for 2016, the medium hourly wage for men was €15,9, and for women €13,6 (INE, 2018). There is no simple answer to the question why there are these differences in the wages. The unadjusted data provides general information about the gender wage gap. However, if the
5
aim is a deepened analysis of the wage distribution, the adjusted data should be used. The adjustments to the data allow in depth investigation of the wage gap with respect to personal´s and job´s characteristics. This thesis uses both kinds of data sets in an attempt to explain the gender wage distribution in the context of economic downturns.
The data set used allows the application of different econometric methods to investigate the wage distribution between men and women (with the focus on Spain). First, the Mincer method estimates a joint wage equation for men and women, based on the human capital theory. It assumes that the salary that a worker receives is equal to its productivity, and that it depends on personal and human capital characteristics. Second, the Oaxaca-Blinder method estimates two different OLS wage equation for men and for women. It allows for a decomposition of the gender wage gap. Thus, the wage difference could be divided into two components. The first component indicates the wage gap differences which are explained by the productivity characteristics, while the second component approximates the resulted unexplained part of the wage gap, often used as a proxy for discrimination.
The financial crash of 2008 is considered to be the worst financial crisis since the Great Depression of 1930s. The recession and the economic instability led to high unemployment rates in many countries. Most European countries were affected by the crisis. However it had greater impact on Spain, Portugal, Greece and Ireland. First, the crisis hit the construction industry which resulted in drastic increase of the male unemployment. The second phase of the crisis impacted women, as the services and the public sectors were affected (Banco de España, 2016).
The focus of this thesis is on Spain in the context of the economic crisis of 2008. The Spanish government targeted to rescue the financial sector with public money, which resulted in sovereign debt (European Commission, 2013). Of interest to this thesis, is the finding that the crisis and the policy responses impacted men and women differently (Mendoza, 2011).
Some researchers (Lizárraga, 2007; Croson, 2009; O´Neil, 2015) point out that men and women are different by nature and they base their economic decisions on different factors. In addition, wealth accumulation differs for men and women and therefore they save and invest differently. Cartwright (2011) suggests that women tend to be more risk-averse and men more risk-tolerant. As a fact, women would accept lower rates of return. However, Chang (2010) demonstrates that even though men and women had the same risk preferences, the gender pay gap decreases but does not disappear.
6
Spain was one of the countries hardest hit by the recession, and thus it could be used as a case study for a potential change in the gender wage distribution. Analysis for the years before and after the crisis, using the unadjusted data provided from EUROSTAT and also the adjusted data provided form the National Statistic Institution of Spain for the years 2002, 2006, 2010 and 2014, will be performed.
First, this thesis will present the research question, chapter 2, followed by background information on gender wage distribution, chapter 3. Continuing into chapter 4, where different theories of discrimination will be discussed and explained. Chapter 5 focuses on the cause, consequences and the effects of the financial crisis. Further, chapter 6 and 7 present how the problem could be explained by the adopted data and methodology for the analysis. Chapter 8 focuses on the results of the unadjusted data. Results for the adjusted data are introduced in chapter 9, where the Mincer methodology and the Oaxaca-Blinder methodology are presented. The analysis of the results of the study is discussed in chapter 10 and chapter 11 concludes the findings.
2. FORMULATING THE PROBLEM
The problem examined in this essay is to analyse the effect of the recession of 2008, if any, on the gender wage gap in Spain. Therefore the question of analysis is formulated as follows: In the context of the economic downturns of 2008, was there an impact on gender wage distribution in Spain?
3. BACKGROUND AND EARLIER STUDIES
During the years numerous methods have been used to measure the gender wage gap differences in different countries and regions. One of the first study that detected wage gap issues was the study of Blinder (1973). He investigated the USA labour market. The study analysed the male-female wage differential (and also the white-black differential). The main finding of the study is that 68% of the gender differential could be explained by personal´s characteristics. For example, the age (as male earnings increase over the life cycle more than women´s) directly impact on gender wage gap.
7
Polacheck (1981) reached the conclusion that women base their decision on choosing a job according to the duration in the labour force. In addition, the domestic responsibilities influence on the employment choice, as well. Back in the 1981, the number of women professionals would increase by 35% if women present a full engagement in the labour force. Years later, Kim and Polacheck (1994) analysed the individual characteristics between males and females. Their conclusion is that if heterogeneity and endogeneity are controlled for, the unexplained male-female differential declines from 40% to 20%.
Solberg and Laughlin (1995) analyse the effect of personal characteristics on the wage gap. The conclusion is that occupational segregation is the primary determinant of the pay gap. This supports the crowding model which is explained in more detail in chapter 3. Juhn, Murphy and Pierce (1993) were one of the first to examine both, the observed and unobserved dimensions of skills. Their study concluded that the gender-specific characteristics of males and females have an impact on the wage gap.
Oaxaca (1973) and Blinder´s (1973) method divides the gender wage gap into two parts: one part explained by the individual´s and the job´s characteristics; and an unexplained part, which is considered as gender discrimination. A report for the European Commission performed by Beblo, Beninger, Heinze and Laisney (2003) shows that at most half of the difference in earnings between the sexes could be attributed to differences in characteristics. Albrecht, Björklund and Vroman (2000) analysed the wage gap at all quantiles of the wage distribution. Quantile approach allows the localization of gender wage discrimination to particular quantile (or percentiles). It separates the pay gap in higher, medium or low paid job positions. The results showed a significant glass ceiling effect in Sweden in the 1990’s (higher gap in the high paid job positions). The glass ceiling generally refers to gender inequality in terms of invisible barriers which limits career opportunities for women in the work place (Cotter, 2001). Another conclusion is that the glass ceiling effect is purely a gender-specific phenomenon and the basic labour market characteristics could only explain a small fraction of the glass ceiling effect.
Earlier studies related to the specific research question in this thesis are discussed in the following pages. Table 1 summarizes the main results for the gender wage gap in Spain. Different methods are applied for different time periods. However, the data of preference for all the studies is the Structural Earning Survey.
8
Table 1- Earlier studies
Reference Years of Investigation
Method Applied Results for Gender Wage Gap Moral-Arce, Sperlich, Fernández- Sáinz, Roca (2011) 1995-2002 Quantile Regression Extended/Machado and Mata 1995: 34,9%/32,2% 2002: 30,2%/22,6% Guner, Kaya and
Sánchez-Marcos (2012) 1995-2006 Mincer Regression/ Oaxaca-Blinder Decomposition 1995: 19,2%/25,7% 2002: 20,1%/17,1% 2006: 18,9%/12,8% Murillo and Simón
(2013)
2002-2010 Juhn-Murphy-Pierce 2002:18,6% 2006:16,8% 2010:20,3% Casado and Simón
(2015) 2002-2010 Fortin-Lemeieux- Firpo 2002: 1,661/2,862 2006: 1,702/2,874 2010: 1,678/2,912 Anghel, Conde-Ruiz, Marra de Artiñano (2018) 2002-2014 Mincer Regression 2002:18,7% 2006:17,0% 2010:14,9% 2014:12,7% Source: Author´s elaboration
The results of the table in percentage form should be interpreted as it follows. In 1995, for example, females earned on average 34,9% lower wages compared to males.
The semiparametric extension of Machado and Mata used in the study of Moral-Arce, Sperlich, Fernández-Sáinz, Roca (2011), divides the wage gap in Spain into quantiles: the low and the high paid job positions. Table 1 represents the 10th and the 90th quantiles. The main findings are that discrimination is more serious in rather low and rather high paid jobs than for jobs with median wages. The gap has diminished from 1995 to 2002 mainly due to the smaller gap in returns of endowments for wages above the considered medium level.
The study of Guner, Kaya and Sánchez-Marcos (2012) demonstrates that the observed gender gap in Spain has declined for the period 1995-2006. However after controlling for worker and job characteristics using a Mincer regression, the gap only declines marginally. Women that are more qualified than men in observable labour characteristics, end up earning less. Women are also more concentrated in lower paid jobs. The gender gap has decreased over the years, when applying the Oaxaca-Blinder method. However, the unexplained part of the decomposition has increased.
9
Murillo and Simon (2013) examine the evolution of the gender wage gap in Spain for the period 2002-2010. The main method used in the study is the decomposition of Juhn-Murphy- Pierce. This approach stresses that gender inequality in wages is due to three factors:
1) Differences in productivity-related characteristics
2) Differences in reward to workers with equal characteristics 3) Differences in the overall shape of the wage structure.
The study includes the effect of the financial crisis on the labour market and concludes that differences in productivity characteristics are just one of the reasons for the difference in the wage gap. Further, the authors conclude that there was an improvement in the wage distribution before the crisis. However, as a response to the created situation after 2008, the gender wage gap increased mainly due to new reforms in the labour market that completely changed the overall shape of the wage structure. Reforms such as decreasing the minimum wage level and increasing the working hours spent.
Casado and Simón (2015) examine the evolution of the wage structure in Spain applying the Fortin-Lemeieux-Firpo method. They conclude that the real wages grew moderately over the years. However the wage gap was affected mainly by the changes in employment composition due to the economic crisis. The quantile regression applied in the study analyses the wage gap at all quantiles of the distribution. The results from the Table 1 describe the 10th quantile and the 90th quantile of the study, where quantiles state for low and high paid jobs. The gender
wage gap rate in 2002, for example, at the 10th quantile was 1,661 and at the 90th quantile was 2,862. It implies higher wage gap in high paid job positions.
Anghel, Conde-Ruiz, Marra de Artiñano (2018) estimate the decrease in the wage gap for the years 2002-2014. They apply a Mincer regression. In addition, the paper also separately examines the gender wage gap according to the group of age, the education level or the sector of employment. The main conclusions are that women are generally treated unfairly. For example, women´s superior level of education is not reflected in wages. The authors stress the need for political action in order to offer the same labour conditions and opportunities for men and women. The authors cautions against the potential socioeconomic loss of qualified women who prefer not to enter in the labour market.
To perform a general comparison of the results is difficult. The studies differ in the choice of dependent variable (annual or hourly, gross or net), the estimation technique (Mincer regression, Oaxaca-Blinder decomposition, Juhn-Murphy-Pierce, Machado and Mata), the
10
years of investigation, the type and the number of controlled variables. However, we could conclude that there do exist some wage discrimination due to gender.
4. THEORIES OF DICRIMINATION
Discrimination occurs when members of a minority group are treated less favourably than members of a majority group with identical productive characteristics. Any form of this is forbidden by law in many of the countries. However, it may be difficult to detect (Haagsma, 2015).
Becker (1957) was one of the first economists to define discrimination in the labour market. According to him, discrimination occurs when there is evidence for difference in pay between two workers of equal productivity. Many economists during the years have developed different models to explain the causes of the differences in wages, as the competitive model (which refers to individual behaviour that may include discrimination) and the collective models (where discrimination is specified for a whole social group).
Arrow (1973) defines discrimination in the labour market as the valuation of personal characteristics of the worker that are not related to the productivity. In many occasions, discrimination in the workplace is associated with a wage difference between men and women. Among the causes for wage inequalities according to Arrow are:
the social self-limitation of women: as they prefer to stay at home and take care of the family
occupational segregation: when men and women perceive different kind of jobs like manly or womanly
inequality in human capital: as it is seen that it is not profitable for women to invest in human capital due to the fact that they may interrupt their professional working life because of maternity
11
4.1. TASTE-BASED DISCRIMINATION
In the study ¨The Economics of Discrimination¨, Becker (1957) describes how the market might produce incentives for discrimination based on individual´s preferences. He also clarifies the difference between segregation and market discrimination. There are three types of discrimination according to Becker which could affect females, as discrimination:
1) From employer´s point of view 2) From co-workers´ point of view 3) From the customer´s point of view
Taste-based discrimination is based on social preferences. In this case, Becker narrows different types of situations where male employers will only hire female workers if they can pay them lower wages. In addition, male employees may demand higher wages if they are forced to work with female co-workers. As a fact, male customers might be willing to buy products and services from a woman if the price of the product or service is lower than if they were to buy the same product or service from a man (Sjögren, 2004). Discrimination of such kind causes a cost to society and a loss of productive efficiency.
Becker (1957) proposed that gender discrimination is a complex issue since it is related to biology and aspects of women´s role in society. We ask the reader to keep in mind that the paper was published in 1953, in a time where women were not as emancipated as today.
4.1.1. TASTE-BASED DISCRIMINATION FROM EMPLOYER´S POINT
OF VIEW
The taste-based discrimination from employer´s point of view could be defined in a way that employers would have to pay additional cost if they are willing to hire women instead of men. In this case, Becker (1957) concludes that employers will have the same utility function where they will maximise benefits in a way that:
12
where Π are the benefits,
𝑁𝑤 is the total number of women that work for the firm
𝑁𝑀 is the total number of men that work for the firm
𝑤𝑤 is the salary paid for women
𝑤𝑀 is the salary paid for men
(𝑁𝑊+ 𝑁𝑀) is the output
It is important to mention that the analysis implies only one type of work in a short term, where the capital is given. It is suggested that the employer maximises its utility function which is described as:
𝑈(𝛱, 𝑊, 𝑀)
𝑈 = 𝑈(𝐹(𝑊 + 𝑀) − 𝑤𝑤𝑁𝑤 − 𝑤𝑀𝑁𝑀; 𝑊, 𝑀)
Employers will maximise their utility function which is the sum of the output produced by males and females, given the wages.
The following conditions:
𝑈𝑊𝑔𝛱>0
𝑈𝑀𝑔𝑀 ≥0 𝑈𝑊𝑔𝑊<0
imply that employers will always maximize their utility function. However, employers will distinguish their benefits produced by men and women. The last condition describes the costs of only hiring women (Neilson and Ying, 2016). The utility function of hiring men or women changes due to the additional cost of hiring women (𝑈𝑊𝑔w<0).
Becker explains that women, as being discriminated for their gender, will only be hired if they are willing to perceive lower salary. This would happen due to the fact that employers will face additional economic cost of hiring them. This cost is entitled as the discrimination coefficient 𝑑𝑊, where
13
𝑀U𝑔𝛱
𝑑𝑊 = −
𝑀U𝑔
Thus, the discrimination coefficient will be the negative result of the marginal utility of the total benefits divided by the marginal utility of women. In addition, the marginal productivity of men and women is represented as:
𝑀𝑃𝑊 = 𝑤𝑤+𝑑𝑤
𝑀𝑃𝑀 = 𝑤𝑀
The first equation above represents the marginal productivity of women, which assumes the discrimination coefficient. While the second equation represents the marginal productivity of men (Rivera, 2013).
Also, in the equilibrium the salaries paid to men exceed the salaries paid to women and in this way
𝑤𝑀= 𝑤𝑊+𝑑𝑤
𝑤𝑀− 𝑤𝑊=𝑑𝑤
where men salaries is the sum of women salaries and the discrimination coefficient. coefficient. Thus, the difference of wages between men and women is represented by the discrimination coefficient.
Charles and Guryan (2008) represent the Becker theory graphically (Figure 1). They explain that the equilibrium ratio of female to male wages responds to three sets of market conditions The first condition occurs when the discriminate coefficient 𝑑𝑊 is equal to zero. The
marginal discriminator is unprejudiced and there is no gender wage gap in the equilibrium.
The second condition occurs when there is a change in the offer for women in the labour market, while the preference between men and women is kept constant. The offer changes from 𝑆1 to 𝑆2 and it this way the ratio 𝑤
𝑊
decreases.
𝑤𝑀
14 𝑆1 𝑆2 A B C D C´ D´
The third condition occurs when employers elevate their discrimination level towards women meanwhile the offer stays constant. In this way, the demand changes to the point D´ and this reduces even more women´s salaries compared to men´s salaries. As a result, it could be observed in Figure 1, that if the discriminate coefficient
increases, the number of women in the labour market will be lower.
Figure 1- Taste-based discrimination
𝑤𝑊 𝑤𝑀 𝑤𝑊1 𝑤𝑀1 𝑤𝑊2 𝑤𝑀2 𝑁𝑀 𝑁𝑀3 𝑁𝑀1
Source: Charles and Guryan (2008).
It is important to mention that the explained conditions may occur in short term, but not in long term given the fact that there may be more firms entering into the market. This is one of the critics of Arrow (1973) who states that in long run there will be the condition of perfect competition.
15
4.1.2. TASTE-BASED DISCRIMINATION FROM CO-WORKERS´ POINT
OF VIEW AND CUSTOMER´S POINT OFVIEW
Becker (1953) explains that there might be males in the work place who would prefer not to work with females. The result would be that males will demand higher salaries due to the inconvenient to work with women (𝑤𝑊 + 𝑑𝑤).
Becker proposes a possible solution to the problem as giving the idea so the manager organises the work in a way that there are two groups. In this way, males work only with males and there will be no additional costs to compensate the mix situation group. Anyhow, there will be segregation between the two groups.
In addition, if it is possible for all prejudiced individuals to find jobs in firms without female co-workers, then the marginal discriminator is unprejudiced and the wage gap is zero. If, however, such segregation is not possible there must be a gender wage gap. (Kerwin and Guryan, 2007).
From another point of view, Becker (1957) narrowed that there might be some cases, where there is evidence for discrimination from the customers. In this way customers are willing to pay higher price for a product which was produced by males and not females. At the end, females will sell fewer products and services. In this way they will need to charge lower price and this will result in lower productivity. Some customers who are prejudiced may have to pay higher prices for goods. This model suggests that customer prejudice may present a more enduring source of labour market discrimination than employer prejudice (David, 2003). Kricheli-Katz and Regev (2016) used this theory to analyse a large data set containing all eBay auction transactions of most popular products by private sellers between the years 2009 and 2012. They tried to show that people accurately identify the gender of sellers based on typical information provided in postings (as policy eBay does not reveal the gender of the users). The result showed that, on average, female sellers received about 80 cents for every dollar a man received when selling the identical new product. And 97 cents when selling the same used product.
16
4.2. STATISTICAL DISCRIMINATION THEORY
By the early 1970s many economists had expressed criticism of Becker’s model of discrimination. Arrow (1973), for example, criticised Becker’s finding that perfect competition would drive discriminatory employers out of the market. Another source of dissatisfaction was that in Becker’s model the discriminatory tastes were taken as given. A different model of discrimination based on rational optimising behaviour and limited information is proposed by Phelps (1972) and Arrow (1973). This ¨statistical discrimination model¨ eventually became the other standard formulation of discrimination in the economics literature (Guryan and Kerwin, 2013).
Phelps (1972) formed the statistical discrimination model in the following way: the employer is able to measure the performance of the candidates in a test 𝑦𝑖, which actually measures the
applicant’s degree of qualification 𝑞𝑖 and an error term normally distributed.
𝑦𝑖 = 𝑞𝑖 + 𝑢𝑖.
The employers could observe the test 𝑦𝑖because it provides information about degree of
qualification of the candidates. However, the main observable variable would be the expected value of 𝑞 given 𝑦. Aigner and Cain (1977) developed the original model of Phelps and formulate the following equations:
𝑞 𝑞 = 𝐸 ( 𝑦) = (1 − 𝛿)+ 𝛿𝑦 𝑉𝑎𝑟(𝑞) 𝛿 = 𝑉𝑎𝑟(𝑞) + 𝑉𝑎𝑟(𝑢) = 𝐶𝑜𝑣(𝑞, 𝑦) 𝑉𝑎𝑟(𝑦)
Where 𝛿 measures the precision of the test and takes values between 0 and 1. If the value results in 1, it means that the test is reliable. And if the value is 0, then the opposite.
In addition, Phelps (1972) considers two groups of employees with different mean (for females) and (for males) and different variance1. The employer tends to pay a fixed amount of money 𝑞 based on the specific group:
1In the original paper of Phelps, the aim of study is the race discrimination among the population. However the developed theory could be applied to the gender discrimination.
17
𝑞𝑀^= (1-)+𝛿𝑀 𝛿𝑀 (for males) 𝑞𝑊^ =(1-𝛿𝑤)𝛼𝑤+𝛿𝑤𝛿𝑤 (for females)
The employer evaluates the abilities of each group of people separately. The model of Phelps implies the following assumptions:
The variance for the error term for both groups is the same The variance 𝑞^(for females) is bigger than the variance of 𝑞^
𝑤 𝑚
Phelps assumes also difference in the average abilities at the outset, even though in general, the term discrimination is understood as the difference between workers with the same ability of production.
Each worker is paid in accordance with his expected productivity based on an unbiased predictor. The result of the study reflects the situation where employers intend to hire the most productive candidates. However the existence of the cost of not hiring the most productive candidates reflects the uncertainty of the employers. At the end, the profit maximization would lead to favouring one group over the other (William and Ying, 2016).
Statistical discrimination is based on imperfect information about workers’ productivity levels. When a worker’s true productivity is unknown, the employer hiring or promoting workers, or determining wages, must rely on some observable but imperfect indicator of productivity (Sjögren, 2004). The problem here is that the employer has limited information about the skills of the employees and in this way firms might use observable characteristics (of the whole social group and not individual’s) that might be related to the work performance, such as gender, age, race.
Altonji and Pierret (2001) studied the statistical discrimination model in the labour market of USA. The results of the study are that employers statistically discriminate workers based on some easily observable characteristics such as gender.
4.3. OVERCROWDING MODEL
Crowding models of the labour market are, according to Hirsch and Shumacher (1992), among the most frequently used explanations for the gender wage gap and occupational differences in employment. The model assumes that people may want to occupy positions with lower wage due to the lack of opportunities. The overcrowding model shows that women
18
“crowd” into limited number of occupations, which results in oversupply of labour and depresses their wages. (Usui, 2012).
The existence and proceed of occupational segregation by gender may lead to think that some policies might intend to lower wages in certain occupations. The overcrowding model could be explained using labour supply-demand curve. A situation where the supply is relatively small to the demand, results in high wages. The opposite situation, where the supply tends to be large relatively to the demand results in low wages (Grybaite, 2006).
Johnson and Stafford (1998) analysed why women overcrowded certain professions. Some of the professions are characterised as occupations where there is less employer discrimination. Others are characterised as fewer social pressure due to the fact that women would have comparative advantage (as children care occupation, house work, etc.).
Bren and Garcia-Penalosa (2002) conclude that women´s past career choices lead to labour crowding. Past differences between men and women in preferences for child care have persistent effects for the role of the women in the labour market. As a result, members of each gender make different career choices even if, currently, they have the same preferences.
5. THE FINANCIAL CRISIS IN SPAIN
The crisis of 2008 is considered by many economists to be the worst financial crisis since the Great Depression of 1929. A deep recession, high unemployment rates, economic instability are just a few of the several seriously damaging effects caused by the breakdown of the global economy (Unicri, 2015). The recession was a direct result of failure of mortgage market in the USA. The abundance of credits and the low interest rates created the financial situation. The crisis has forced the insolvency of many banks and financial institutions worldwide (Ramadhan and Naseeb, 2015).
The recession spread quickly across the world. It hit the EU during a phase of progressive regional convergence. The impact in the EU led to a 4,5% decline in real GDP per capita in 2009, bringing to an end a decade of economic growth. The construction boom in Spain, and the increasing rates of home ownership came to a rapid end in 2008. Relatively well-paid work in construction-related sectors disappeared; many middle class households were left in negative equity. (Crescenzi, Luca and Milio,2016).
19
The policy responses impacted men and women differently, and yet the effects of austerity measures on women are rarely considered (Unaids, 2012). Some governments, among them Spain, were forced to take actions and introduce economic reforms. These reforms could have had negative consequences for women. Thus, in this thesis we will work with the hypothesis that there could have been an impact of the crisis on gender inequalities.
5.1. THE IMPACT OF THE CRISIS IN SPAIN
The recession hit all economic sectors as a consequence of the dramatic fall in internal demand and investment caused by a high level of private indebtedness, and an increased credit squeeze in the private sector (Stiglitz, 2010). The continuous growth of housing prices, the unbalanced growth of credits and the lack of supervision of the banking system created the insolvent situation in the construction area.
Between 2007 and 2014 real per capita GDP in Spain fell at least 7% (Martí and Pérez, 2016). The public debt before the crisis in 2007 was at its lowest levels for three decades. In addition, the public debt to GDP ratio stood at 35,5% compared to the euro area average of 66%. In 2007 public spending was 38,9% of GDP. Welfare services constitute the most significant part (Martí and Pérez, 2016). As a consequence of the crisis, in 2008 the 2% of GDP surplus converted to a fiscal deficit of 4,4%. The hardest stage of the crisis was in 2009 when GDP fell 6,3% and unemployment in the country increased by around 800,000 people (Carballo- Cruz,2011).
The Spanish level of unemployment reached its peak of 26,1% (compared with the average EU28 countries of 10,8% (Eurostat, 2018)). More than 40% of job losses were in the construction sector (Myant and Piasna, 2014). This sector is considered male dominant, so if there are any great changes in the gender wage gap this could be one possible explanation of it. Part of male employment sector is destroyed and the pay gap balance might change.
Before the 2008 crisis the female employment rate in Spain reached a peak of 58,6% in 2007. Male employment being 80,6% for the same year (Eurostat, 2018). In addition, Galdano and Terskaya (2017) state that women´s supply of labour in Spain increased after the crisis. It was a logical response to their partners´ job losses and the reduction in the income of the family. During the first phase of the crisis construction sector, manufacturing and transportation were affected most. However, during the second phase of the crisis public sector employment was affected as well. Women present higher participation level of public employment being 58,3% for 2016 (INE, 2018).
20
It is important to mention the duality of the labour market in Spain. Job market duality refers to the relationship between permanent and temporary contracts. On average before the crisis approximately 60% of employees have permanent contract, which mean legal restrictions to being fired. The remaining 40% work under fix term contracts (Aceleanu, 2013). As a consequence of the crisis, the share of workers with temporary contracts decreased, as they are easiest to dismiss. Temporary workers are mainly young people and women (Élteto, 2011). Before the crisis 2006 the percentage of male workers with temporary contract was 32%, while women´s share was 36,6%. After the recession in 2010 and 2012 men´s share was 23,6% and 22%, while women´s share was 26,1% and 24,9% respectively (OECD,2018). The crisis modified the economic structure in the country. The next chapter investigates the possible impact of the reforms on gender equality in Spain.
5.2. COMBATING THE CRISIS
As a response to the crisis, new reforms were implanted in the labour market in order to make the market more flexible and efficient. The financial system and the public sector were targeted as well. The new structural reforms aimed at decreasing the size of the budget deficit, as well as reducing unemployment, increase competitiveness of Spanish firms, increase productivity and quality of employment. Reducing the deficit requires cuts in spending, increase in taxation or both.
The so called austerity measures (or the well-known structural reforms) were adopted in 2010 and 2012 in Spain as a reaction to the crisis. They were mainly supported by the International Monetary Fund, the European Central Bank and the European Commission. Austerity policy was aimed at a consolidation of public finances and assisting in overcoming the structural problems of Spain´s economy exposed by the financial crisis (Threadgould, 2013).
Spain is one of the countries in which the austerity policies have gone furthest (Unicri, 2012). These measures often include cuts in social services, education and health. Public investment was reduced for 2010 and 2011 by more than six billion euros. Women are the ones who provide most unpaid care work, so as a consequence any cuts in social services affect them. Women in Spain dedicate on average 38 hours per week of unpaid work, compared to men who dedicate 21 hours (INE, 2018).
21
public sector were cut by an average of 5%. The working week was extended from 35 to 37,5 hours. Income taxes rates increased by between 0,75% and 7%. The reform in the labour market was design to reduce the financial incentives for hiring employees on temporary contracts, and instead promote the signing of permanent contracts (Witte, 2012). It was made easier and cheaper to fire workers.
The increased possibilities for firms to change individual’s contracts gave them greater power to redistribute the working hours. Such reform affected women most because a change in the working hours made it more difficult to achieve a work-life and childcare balance (Pérvier, 2018).
The result was a reduction in the labour market activity rate and generating more jobs available for men. In addition, budget cuts in health and child care services led women to leave the labour market, or reduce paid employment, substituting for services no longer provided by the government. Such policies returned women to the traditional gender roles compared to the situation before the crisis (Garcia, 2014).
6. METODOLOGY
There are numerous methods that are used to study the gender pay gap. Some studies refer to the gender wage gap for the labour market in general, while others study specific occupations or sectors. This thesis presents two types of econometric methodologies in order to describe the magnitude of the gender wage discrimination, foremost in Spain.
6.1. MINCER METHOD
Mincer (1974) was one of the first to estimate the gender wage gap differences. His work influenced the field of labour economics (Olsen, 2004). Nowadays, the method is considered as one of the most used to measure wage gap discrimination; see for example Peñas (1996), Guner (2012), Bonhomme (2012), Biltagy (2014), Anghel (2018). Different methods based on his approach have been developed over the years, e.g. as Heckman (1979), Oaxaca-Blinder decomposition (1973), Juhn, Murphy and Pierce (1993), Machado and Mata (1995).
Mincer based his econometric estimations on the human capital theory. The human capital approach refers to the fact that individuals invest in education, training and experience in
22
order to improve their labour market returns. In addition, the human capital method assumes that the salarywhichaworkerreceivesisequaltoitsproductivityanddependsonpersonaland human capital characteristics. This way he could investigate the possible wage differences (Olsen, 2004).
Mincer (1974) developed a log wage equation based on a linear function of education and a quadratic function of experience. The results implied that the returns to schooling increased linearly. It estimates the gender wage differences including a gender dummy variable. The estimation method is flexible because it allows including a set of variables affecting the wage distribution. A simple OLS regression is performed and the logarithm of wage is used as the dependent variable. The equation of estimation takes the following general structure:
ln(𝑦
𝑖) = 𝛽
0+ 𝛽
1∗ 𝐹𝑒𝑚𝑎𝑙𝑒 +𝛴
𝑗=2𝑚𝛽
𝑗∗ 𝑥
𝑖𝑗+ 𝑢
𝑖,
Where ln(𝑦𝑖) is the logarithm of the real salary per hour
Female is a gender dummy variable which takes value 0 if the worker is a male and value 1 if the worker is a female.
The variable are set of variables which could determine the worker´s salary. In this
thesis the variables taken into consideration are: o the age of the workers
o the age squared of the works
o the level of education (high school education, university, etc.) o the experience of the working life
o the size of the company (10-199 workers or more than 200 workers). o the type of the contract (indefinite or temporary contract)
o the working day (part-time or complete)
𝛽1 refers to the difference between the hourly wage of a woman and a man, holding all
the other variables constant.
If the estimated coefficient of the variable 𝛽1 is significantly different from zero, then it is said
23
The dependent variable is explained by two groups of variables such as personal characteristics and job characteristics. In a matter of fact, these variables could explain some or all of the gender wage differences. Some studies extend the Mincer equation incorporating region, union membership status, health status, ethnicity and other set of variables that could influence the wage distribution.
However, this method presents some problems. For example, the productivity could depend on the gender, or the explanatory variables could be endogenous (Guner, 2012).
6.2. OAXACA-BLINDER METHOD
Oaxaca and Blinder (1973) developed a method which was the first one to propose dividing the gender pay gap into two parts. This method consists of separately estimating an OLS wage equation (based on the Mincer approach) for men and women. Thus, the difference between these two equations could be decomposed.
This technique separates the observed wage gap into explained and unexplained wage gap. The first part reveals the explained components, such as the observable difference in the skills of the individuals. In addition, it consists of estimating the difference in human capital endowments weighted by the rates of return to human capital. The second part of the gender pay gap is interpreted as discrimination since the wage differential between men and women cannot be explained by the observable variables.
The formal composition of method takes the following structure:
ln(𝑦
𝑚𝑖) = 𝑥
𝑚𝑖𝛽
𝑚+ 𝑢
𝑚𝑖ln(𝑦
𝑓𝑖) = 𝑥
𝑓𝑖𝛽
𝑓+ 𝑢
𝑓𝑖ln(𝑦
𝑚) − ln(𝑦
𝑓) =𝑥
𝑚𝑖𝛽
𝑚−𝑥
𝑓𝑖𝛽
𝑓Where the first equation is related to the wage structure of males and the second equation is related to the wage structure of females. The difference represents the wage gap between males and females.
24
the dependent variable is presented as the logarithm of the salary perceived 𝑥𝑚 and 𝑥𝑓 indicate the average attributes of the male and female workers
• 𝛽
𝑚 and 𝛽 𝑓
females
are the coefficient estimates from separate regressions for males and
Elder, Goddeeris and Haider (2010) performed a detailed analysis of the structure of the Oaxaca-Blinder method. The equations furthermore follow their interpretation of the method. In case it is supposed that there is no discrimination among individuals, which is the same as saying, if women had perceived the same salaries as men, then the expression of the equation would be the following:
ln(𝑦
𝑚) − ln(𝑦
𝑓) = β
𝑚^(𝑥
𝑚) −β
𝑓^(𝑥
𝑓)
However, if discrimination exists, then:
ln(𝑦
𝑚) − ln(𝑦
𝑓) = β
𝑚^(𝑥
𝑚− 𝑥
𝑓) +𝑥
𝑓(β
𝑚^− β
𝑓^)
In the last equation we have added the counterfactual
𝛽
𝑚𝑥
𝑓, which is the average wage that females would have if they had the same returns to observed characteristics as males. Thus, the salary difference could be divided into two parts. The first component of the equation above indicates the wage gap differences explained by the difference in the observed productivity characteristics (the explained difference). It is also called the composition effect. The second component is the unexplained difference in returns of the productivity characteristics. It also refers to the wage structure effect. In addition, it means that the gender wage gap cannot be explained by the assumed observable characteristics. The last term actually refers to the concept of wage gap discrimination.STATA presents the results of the Oaxaca-Blinder method in a table and substitute males and females coefficients in both males and females equations. The interpretation of the results of the tables presented by STATA should be as follows. The first part (the endowments) reflects the mean increase in women’s wages if they had the same characteristics as men. The second term (the coefficients) indicates the change in women’s wages when applying the men’s coefficients to the women’s characteristics. The interaction term measures the simultaneous effect of differences in endowments and coefficients (Jann, 2008).
25
In addition, the discriminatory coefficient was formulated by Oaxaca (1973) as:
𝐷 =
(
𝑤
𝑤
𝑚 𝑓) − (
𝑤
𝑚𝑤
𝑓)
0(
𝑤
𝑤
𝑚 𝑓)
0Where is the observed male-female wage ratio. While is the women to men wage ratio in the absence of discrimination. Rewriting the equation using natural logarithms it would look as it follows (Ospino, 2009):
ln(𝐷 + 1) = 𝑙𝑛 (𝑤𝑚 𝑤𝑓) − 𝑙𝑛 ( 𝑤𝑚 𝑤𝑓) 0 ln(D + 1) = ln(wm) − ln(wf)
The wage differential could be decomposed into the effect of discrimination and the effect of differences in individual characteristics. Thus, the discriminatory coefficient would take the following structure:
𝐷 = 𝑤𝑚− 𝑤𝑓 𝑤𝑓
Where wm and wf are the average wages for men and women respectively.
The discriminatory coefficient measures the proportion in which the relative male salary (to female salary) exceeds the relative salary that would exist if there is no discrimination prevalent and both individuals would receive the same earnings in the labour market. Women would receive less income than what a nondiscriminatory labour market could give them. Numerous studies have applied this method considering it the most adequate one to analyse the gender wage gap (Guner, 2012; Scotti and Manzano, 2014; Espinosa, 2007; Boll, 2016). However, one of the problems with the Oaxaca-Blinder method is that all the variables included in the equations are considered as exogenous, which means that they are not correlated with the error term. Still, some variables could be related to the error term which would lead to biased estimators.
(𝑤𝑚 𝑤𝑓
) (𝑤𝑚
𝑤𝑓
26
For this reason the zero conditional mean assumption:
𝐸 (𝑢
𝑚|𝑥
𝑚) = 𝐸 (𝑢
𝑓|𝑥
𝑓) = 0
ensures that the error term is not correlated with the repressors, so the OLS estimation will be unbiased. Thus, it will approximate the population parameter.
27
7. DATA
There are two ways to estimate the gender wage gap: by using unadjusted data or completing the analysis by using adjusted data. The adjusted data could give a more precise view of the gender wage gap discrimination. This thesis uses both types of data sets.
7.1. THE UNADJUSTED DATA
According to Eurostat (2016) the unadjusted gender pay gap (GPG) is calculated as the difference between the average gross hourly earnings (GHE) of male paid employees and female paid employees, as a percentage of average gross hourly earnings (GHE) of male paid employees. The formulation would take the following structure:
GPG =
GHE of male employees−GHE of female employees
%
GHE of male employees
Eurostat (2009) launched a study explaining with details the unadjusted data. It is important to state that there are three conditions which require attention.
1) The unadjusted indicator is based on a mix of several national data sources, which implies that there is a lack of comparability between sources. This makes it difficult to compare gender pay gap indicators across countries.
2) The unadjusted data is unadjusted for composition effects, which implies that male and female work force may not be separated when collecting the data
3) The unadjusted data may explain different situation rather if it is used adjusted data.
Leythienne and Ronkowski (2018) explain another problem of the unadjusted data. The indicator could be influenced by the concentration of one sex in certain economic activities (sectoral gender segregation) or the concentration of one sex in certain occupations (occupational gender segregation). The unadjusted data does not account for women being concentrated in low-paying economic sectors while men could tend to be concentrated in high-paying sectors.
28
For a good interpretation of the data, it is worth to mention that the data is based only on: enterprises with 10 employees or more
there are no restrictions for age, hours worked and the duration of the contract part-timers are included
gross hourly earnings include paid overtime and exclude non-regular payments all available industries are considered
Although many studies consider the unadjusted data as inadequate, it could provide an overview of possible wage gap discrimination between men and women. This thesis will use unadjusted data provided from Eurostat.
7.2. THE ADJUSTED DATA
The adjusted data is collected under the same criteria across the European countries. This thesis will use the Structural Earning Survey of Spain. The adjusted gender wage gap measures the difference in percentage in salary controlling for different factors.
The Structural Earning Survey is estimated every four years in the Member States of the European Union. It provides information on the level of earnings, the individual characteristics of employees (sex, age, education level, etc.) and their employer (size of the enterprise, economic activity, etc). The data is defined as anonymised statistical microdata and the number of observations for the individuals (for Spain) vary through the years between 190 000 and 220 000. However, the access to the Structural Earning Survey for the European country members is restricted and requires special authorization by the authorities. The access for the Spanish microdata is granted under certain conditions by the National Statistic Centre (or INE) of Spain.
INE provides information for the years 1995, 2002, 2006, 2010 2014. The estimations in this report are based on the data for the years 2002, 2006, 2010 and 2014 in order to account for a potential impact of the financial crisis on the gender wage gap in Spain.
Advantage of the data is that it contains information about e.g. the occupation status of the individuals, the level of education, the type of contract and length of work experience. Each one of these characteristics is related to the wage and this will allow performing a precise analysis of the gender wage gap. In addition, it will distinguish between the gap related to
29
different personal characteristics, and the gap which is related to discrimination in the labour market.
The variables collected in the Structural Earning Survey are, among others: The base salary
Gender of the individuals Age of the individuals Working day
Education level Type of contract Experience level
In this thesis the selection of variables is based on the following studies: Peñas (1996), Guner (2012), Sperlich (2012), Biltagy (2014). This study will disregard variables, such as the nationality of the individuals (Spanish or foreigners), the extra payments, the right of vacancies, the parental leave, etc.
Table 2 below represents the values of the Structural Earning Survey that will be taken under consideration:
30
Table 2- Values of the Structural Earning Survey
Variable Specification
Logsalary (the logarithm of the base salary) The estimated base salary from October
Sex (Gender) 1= male
6= female
Age 1=less than 19 years old
2=20-29 years old 3= 30-39 years old 4= 40-49 years old 5=50-59 years old
6= more than 60 years old
Age squared The estimated square of the variable age
Education 3=High school level
4=Upper high school level 6=University level
Experience The gained working experience.
Entity Workers: 10-199
Workers: 200 and more The duration of the contract
The type of working day
1=indefinite 2=predetermined 1=complete working day
2=partial working day
The explanatory variables could be divided into 2 categories: variables related to the employee and variables related to the enterprise.
The variables related to the employee are:
Variables related to the human capital of the employee as education and experience Variables related to the characteristics of the employee as sex and age
31
The variables related to the enterprise The size of the enterprise
A limitation of the adjusted data set is the fact that the survey does not provide information about, for example, the number of children in the household or the marital status of the individuals. In addition, it does not distinguish among the individuals who have the ability to work, but choose not to participate in the labour market.
8. UNADJUSTED GENDER WAGE GAP
This chapter aims analysing the gender pay gap in unadjusted form. The gender wage distribution in Spain will be compared to the wage gap in Italy, Sweden and EU-28. In addition, the employment gender gap will be analysed. The selected years of study for the wage gap are 2006-2016. EUROSTAT (2018) provides the data sets.
8.1. RESULTS AND ANALYSIS FOR SPAIN
As it was mentioned in chapter 7.1, the unadjusted data could give overview of possible gender wage discrimination. Table 3 presents the estimation for the gender wage gap in unadjusted form for Spain and EU-28.
Table 3- Gender pay gap in unadjusted form for Spain and EU-28 (in percentage)
Geo\Time 2006 2007 2008 2009 2010 2011 2012 2013 2014 2015 2016 EU-28 - - - - 17,1 17,1 17,4 16,8 16,6 16,5*2 16,2* Spain 17,9 18,1 16,1 16,7 16,2 17,6 18,7 17,8 14,9 14,2 14,2* Source: Eurostat
Focusing on the results before and after the financial recession, it could be stated that Spain has the tendency to present lower wage gap the three following years after the crisis.
32
However, the gap in 2011 and 2012 increases by on average 1% and then again lower its levels. The gap varies between 14,2% to 18,1% through the years. It presents close values to the pay gap of EU-28.
One explanation of the continuous change in the pay gap in the Spain may be found in the study of Amuedo and De la Rica (2006). It states that a significant part of the gender pay gap is due to the presence of segregation and pay structure of the country. In addition, the average qualification of women in terms of education and experience has improved during the years. Table 4 represents the results for female participation rate in education and training in Spain.
Table 4- Participation rate in education and training in Spain (in percentage)
Geo\Time 2002 2003 2004 2005 2006 2007 2008 2009 2010 2011 2012 2013 Spain 4,9 5,1 5,3 5,2 5,3 11,7 11,9 12,0 12,2 12,1 12,3 12,3 Source: Eurostat
Female participation rate in education and training has varied between 4,9% and 5,3% for the years 2002-2004. However, for 2005 the rate increased until to 11,7% and it maintained its valued around 12% until 2013 (EUROSTAT, 2018). There was a progress in public equality policies in the country. Several laws were approved between the period 2003-2007, as the Organic Law for the Effective Equality of Men and Women. It aimed at the limitation of inequalities in all areas of social and political life.
Another reason for the variation of the pay gap may be found in the fact that women tend to occupy low-paying employment. The crowding model explained in chapter 3.3 supports the state that women may overcrowd in certain professions. Past belief and social pressure might influence the choice of a career. In addition, women might occupy positions with lower wages due to lack of opportunities. This result is oversupply of labour and wage depression.
In addition, Table 3 represents a reduction in the Spanish pay gap of 2% in 2008. It could be owned to the fact that male labour force participation was impacted most at the first stage of the crisis. Male unemployment in Spain drastically increased due to the crisis and maintained
33
almost twice times the unemployment male rate in EU-28. Table 5 and figure 2 show the evolution unemployment male rate in Spain compare to EU-28.
Table 5- Unemployment male rate (in percentage)
Geo/Time 2006 2007 2008 2009 2010 2011 2012 2013 2014 2015 2016 2017 EU-28 7,6 6,6 6,6 9,0 9,7 9,6 10,4 10,8 10,1 9,3 8,4 7,4 Spain 6,4 6,4 10,1 17,7 19,6 21,1 24,6 25,6 23,6 20,8 18,1 15,7 Source: Eurostat
Figure 2- Unemployment male rate
Source: Author´s elaboration based on data from Eurostat
The impactful reduction in the construction, transport and industry area affected men´s employment most. These areas are considered as male dominant. More than 40% of job destruction was in the construction area (Myant and Piasna, 2014). The decrease in gender wage gap does not necessary imply an improvement in the labour conditions. The same results could occur if the male labour conditions worsened, as was the case in 2008.
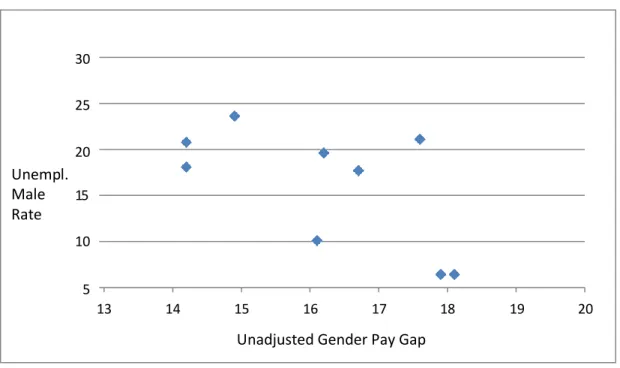
Figure 3 shows the relationship between unemployment male rate and unadjusted gender pay gap. 2006 2007 2008 2009 2010 2011 2012 2013 2014 2015 2016 2017 0 5 10 EU-28 Spain 15 20 30 25
34
Figure 3- Relationship between unemployment male rate and gender pay gap in Spain
Source: Author’s elaboration based on data from Eurostat
It could be observed the negative relationship between the gap and the unemployment rate in the first stage of the crisis. It means that smaller wage gap is correlated with the increase in unemployment male rate. After the crisis, the decrease in male unemployment is correlated with increase in the pay gap.
8.2. RESULTS AND ANALYSIS FOR ITALY AND SWEDEN
To put the Spanish results in a larger context, two other western European countries are briefly investigated. Table 6 represents the pay gap of Italy and Sweden.
Table 6- Gender pay gap in unadjusted form for Italy and Sweden (in percentage)
Geo\Time 2006 2007 2008 2009 2010 2011 2012 2013 2014 2015 2016 Italy 4,4 5,1 4,9 5,5 5,3 5,7 6,5 7,0 6,1 5,5 5,3 Sweden 16,5 17,8 16,9 15,7 15,4 15,6 15,5 14,6 13,8 14,0 13,3 Source: Eurostat
Unadjusted Gender Pay Gap
20 19 18 17 16 15 14 13 5 20 Unempl. Male 15 Rate 10 25 30
35
Italy presents an interesting pattern. The gap varies through the years between 4,4% to 7%. Compared to Sweden and Spain (table 3), the gap is much smaller. The question would be if such small gaps mean more gender equality with respect to the Italian wage distribution. Olivetti and Petrolongo (2008) provide some answer to this issue. They conclude that gender wage gaps across countries are negatively correlated with gender employment gaps. This means that the higher the employment gap is, the less gender gap there would be.
Indeed, Italian labour market presents one of the highest employment gaps across European countries of between 9,3% to 10,8% through the years (European Commision, 2017). As a consequence, women may prefer not to participate in the labour market if they know that their potential salary would be low (Olivetti and Petrolongo, 2008).
The same conclusion about the negative relationship between employment and wage gap could then, hypothetically, explain the observed data for Sweden. Table 7 represents the participation rate for females in Italy and Sweden.
Table 7- Employment participation rate for females in percentage of total population
Geo/Time 2006 2007 2008 2009 2010 2011 2012 2013 2014 2015 2016 2017 Italy 49,6 49,9 50,6 49,7 49,5 49,9 50,5 49,9 50,3 50,6 51,6 52,5 Sweden 75,8 77.1 77,2 75,7 75,0 76,5 76,8 77,2 77,6 78,3 79,2 79,8 Source: Eurostat
Sweden´s 79,8% female employment rate for 2017 (the value did not vary significantly for the previous years between 75,0%-79,8%) is one of the highest in Europe. From another hand, Italian female participation takes values of between 49,5%-52,5% (being 52,5% for 2017). It is one of the lowest among European countries.
It could be observed the fact that the gender wage gap decreased in 2008 for the three selected countries. This was mainly due to the fact that male employment was most effected by the crisis at first stage. In addition, in 2012 (four years after the crisis began), the gender wage gap increased again in Italy. The countries most impacted by the financial crisis implemented strategies as budget cuts which reflected the welfare state and this increased the wage gap (OECD, 2012). The impact of the financial crisis was similar in Italy and Spain.
36
In Italy between 2008 and 2012 there was increase in the national debt as a percentage of GDP. Banking system was affected as well leading to a situation with some insolvency. The political response of the crisis consisted in increasing the taxes on households to 44,7% of gross income. The government also made deep cuts in social spending. One of the major reforms aimed at increasing the retirement age for men and women. As a result, it affected the labour market. People who planned to retire did not have this opportunity. Many lost their jobs and were let go without a pension. The unemployment rate increased from 8,4% to 10,7% between 2011 and 2012 (OXFAM,2013).
Sweden was not affected in such dimensions by the crisis. The country overcame the global financial and economic crisis with limited damage, thanks to the strong macroeconomic, fiscal and financial fundamentals. There was a modest decline in productivity growth as a result of the reduced investment during the first stage of the crisis. However, Sweden faced the crisis with a large budget surplus leaving room for the operation of automatic stabilisers (OECD,2017).
8.3. MAIN FINDINGS OF THE UNADJUSTED DATA
The unadjusted data does not allow researchers to compare the gender wage imbalances across countries. However, it could be observed the distribution of the pay gap for each one of the country individually. The comparisons between Spain, Italy and Sweden were made because the three countries represent different labour market behaviour and also wage gap. In addition, it was demonstrated that using unadjusted data does not reveal the real gender inequality situation in the country. Small gender wage gap in Italy does not necessary mean less gender inequalities than for example Sweden.
It is important to keep in mind, that these results may be affected not only by the employment gap, but also by the impact of the differences in characteristics of males and females, which are not taken under consideration. In addition, employed women may have better characteristics in some countries than others and this will affect the interpretation of the gender wage gap (European Commision, 2017). For this reason, we now turn to the adjusted data set.