English Studies – Linguistics BA Thesis
15 Credits Spring 2018
Supervisor: Soraya Tharani
Gende(r) in the Boston Accent
A linguistic analysis of Boston (r) from a gender perspective
Table of Contents
Abstract ………... ii 1 Introduction ………. 1 2 Background ………. 2 2.1 Historical background ………. 2 2.2 Theoretical background ………... 3 2.3 Previous studies ………... 73 Design of the present study ……….……….…………. 10
3.1 Participants ……….... 10
3.2 Data elicitation ……….. 11
3.3 Method ……….. 13
4 Results and discussion …...……….………... 14
4.1 Casual speech vs careful speech ………... 14
4.2 Gender differences ……… 16
4.3 Other social factors ………... 17
5 Concluding remarks ……….………. 20
Abstract
The Boston accent is one of the most famous accents in the United States and is known for its
non-rhoticity, which essentially means that Bostonians do not normally pronounce their r’s after
vowels. While most Boston locals would tell you to ‘pahk the cah ova hea’ when you arrive in the city, not every Bostonian has the same level of non-rhoticity; this variation is due to a number of different factors, but arguably one of the most interesting factors, which this paper focuses on, is gender. This study looks into how Boston non-rhoticity differs between males and females, as well the theories that explain these potential differences. This is done by collecting and analyzing the speech of Boston locals, following two previous studies on the same topic. In addition to gender, types of speech and other social factors are also analyzed. The biggest finding of this study is that there is a statistically significant difference in non-rhoticity between males and females, with females pronouncing more r’s, which supports one previous study and opposes another, and also supports the linguistic theory that women tend to exhibit more standardized speech than men.
1 Introduction
The Boston accent is conceivably one of the most notorious accents in the United States. It is depicted in several movies starring famous actors, such as The Departed with Mark Wahlberg and Matt Damon, who are both Boston natives, or Black Mass with Johnny Depp, who, not being from Boston, mimics the accent on screen. The Boston accent is arguably easily recognized by most Americans in part due to its cinematic exposure, but also because of its own distinction among American accents. If one finds themselves in Boston listening to locals speak, they might hear words like jar pronounced as ‘jah,’ or park the car pronounced as ‘pahk the cah.’ While this type of speech is often caricaturized, such impressions certainly lend themselves to the reality of the accent. The Boston accent is predominantly characterized by, and known for, its r-deletion, or non-rhoticity, which will often be referred to in this paper as the sociolinguistic variable (r)1;
this study focuses solely on this specific aspect of the Boston accent, although there are a number of other aspects.
The history of (r) in Boston is somewhat debated, but the Boston accent seems to have been non-rhotic for at least 200 years. However, there have only been two studies published that solely focus on Boston (r), and they are both fairly recent. While one study only analyzed careful speech, the other only analyzed casual speech, and both studies also had different results when comparing the non-rhoticity of males and females; there were also some differences regarding the effect of other social factors. These differences leave the Boston accent somewhat unresolved in linguistic comparison, and it has been eight years since the last study of Boston (r). In
addressing this issue, this study will investigate the Boston accent from a gender perspective, as well as types of speech and other social factors that affect language. To this end, the following research questions are posed:
(1) How does the consistency of r-deletion in the Boston accent differ between careful speech and casual speech?
(2) How do males and females from the Greater Boston area differ in their level of non-rhoticity?
(3) How does the non-rhoticity of males and females from Greater Boston differ within the social categories of age, level of education, and occupation?
1 The variable (r) is used following previous studies and theorists. When reading the variable (r) in this paper, whether aloud or to oneself, it is useful to say the phrase ‘r-deletion’ simply for the sake of readability.
2 Background
The background of this paper consists of the following three sections: Historical background,
Theoretical background, and Previous studies. The Historical background provides the history
of non-rhoticity in Boston, the Theoretical background explains the major theoretical concepts in this paper, and the Previous studies section details the two previous studies about (r) in Boston.
2.1 Historical background
According to Fitzpatrick (2006), the Boston accent originated from America’s early English settlers who arrived at Plymouth Rock, approximately 50 kilometers south of Boston, in the early 1630s. He claims that Boston (r) derived from British non-rhoticity and that this can also be seen in other places that the British settled, such as in the American South. While Boston remained a Puritan community for quite some time, an influx of immigration in the late 1800s and early 1900s reshaped Boston for the foreseeable future. After an influx of Irish immigrants came to Boston to escape the potato famine, a number of immigrants from other countries such as Italy, Poland, and Russia soon followed. By 1920, Boston’s population was one-third foreign-born immigrants; they and their children made up three-quarters of Boston’s population within one generation, and (r) seemed to remain in Boston throughout the city’s demographic change (Fitzpatrick, 2006).
Despite a general consensus on the origins of Boston (r), some linguistic historians disagree with the claim that (r) came directly from Britain in the 1600s. According to Parslow (1967), (r) did not encompass the whole city of Boston until after the American Revolution (i.e. the late 1700s and early 1800s), which may have had something to do with the city’s population rising and changing because of the Industrial Revolution. There is also some debate surrounding the consistency of non-rhoticity in England in the 1600s; Pyles (1964) claims that (r) had not made its way out of Southern England until the late 1700s, which means that (r) may not have come with the Puritans from Lincolnshire, which is just outside of Southern England, in the 1630s (Fitzpatrick, 2006). There is no conclusive evidence on either side of the debate, but it seems that most historians and linguists are in agreement that (r) has existed in Boston for at least 200 years. However, (r) does seem to be receding in Boston nowadays with each new
generation; this will be discussed further in the previous studies section, but it is important to keep in mind when considering the history of (r) in Boston.
2.2 Theoretical background
The theoretical background is divided into the following four subsections, which are the main theoretical concepts that will be explained: Rhoticity and non-rhoticity, Types of speech, Gender, and Other social factors affecting language.
2.2.1 Rhoticity and non-rhoticity
According to Collins and Mees (2013), English accents can be divided into two groups regarding the pronunciation of the orthographic letter r, either rhotic or non-rhotic. While a rhotic accent is an accent in which speakers pronounce orthographic r whenever it occurs, a non-rhotic accent is an accent in which speakers do not pronounce orthographic r when it is preceded by a vowel (also known as post-vocalic r). When r is not pronounced it is deleted, or vocalized, meaning the pronunciation of r turns into a vowel sound, such as if the word car is pronounced as /kɑ/ instead of /kar/; this phenomenon is known synonymously as r-vocalization, r-deletion, r-dropping and the sociolinguistic variable (r) (Collins & Mees, 2013; Labov, 1966/2006).
Under the shadow of (r), non-rhotic accents consist of two more defining factors, linking
r and intrusive r (Collins & Mees, 2013). A linking r means that non-rhotic speakers normally
pronounce r between words when r precedes a vowel, such as if a speaker who pronounces car as /kɑ/ pronounces car alarm as /ˈkɑ r əˈlɑm/; this can only occur with non-rhotic speakers because rhotic speakers already pronounce the r, so by definition, rhotic speakers cannot say linking r’s. Within the topic of linking r there is intrusive r, the phenomenon of r being
pronounced when no word-final r exists, which only occurs between a word ending in a vowel and a word beginning in a vowel; an example of this would be a speaker pronouncing I saw a
movie as /ˈaɪ sɑ r ə ˈmuvi/.
While most linguists seem to agree on the fundamental aspects of rhoticity and non-rhotic accents, there is a point where some stray from the superlative idea that non-rhotic speakers never say their post-vocalic r’s. Labov (1966/2006) claims that speakers tend to pronounce word-final r more often than they pronounce non-final r; he believes that this has to do with constraints that create a difference in word-final and word-internal pronunciation. In addition to
word-internal r pronunciation, Labov (1966/2006) also claims that otherwise non-rhotic speakers tend to pronounce r in words such as her, were, occur, and nurse; these words are commonly referred to as ‘NURSE words’, which are words that have the phoneme /ɜr/ in them. Labov (1966/2006) does not give an exact explanation of why this might occur, but he claims that it could have something to do with syllable stress. In addition to Labov’s claims, Fitzpatrick (2006) argues that the Boston accent is specifically susceptible to differences in non-rhoticity, with some speakers pronouncing all of their post-vocalic r’s, some pronouncing a fraction, and others not at all.
2.2.2 Types of speech
There are a number of different terms used in describing both speech that occurs in everyday conversation and speech that occurs when reading texts. Labov (1966/2006) and Bell (1984) use terms such as careful speech, casual speech, free speech, and reading speech. According to Bell (1984), careful speech represents a high level of speaker’s attention to their own speech, such as while reading a text, whereas casual speech represents a low level of speaker’s attention to their own speech, such as in everyday conversation. A difference in style (the way in which one speaks), rather than attention, is denominated in the stylistic terms of free speech and reading
speech, with free speech corresponding to casual speech and reading speech corresponding to
careful speech (Bell, 1984). For reading speech to occur, the speaker must be reading something aloud, and free speech must occur in regular, casual conversation. Regarding the relationship between attention and style, some readers with a lower level of reading skill may have to pay more attention while reading a continuous passage aloud, which in turn affects style (Bell, 1984). The concept of formality, which falls under style, is also connected with attention. Formal
speech can be caused by more attention and result in careful speech, whereas informal speech can be caused by less attention and result in casual speech (Bell, 1984; Labov, 1966/2006); formality will not be directly analyzed in this study, but it is important to keep in mind when considering careful speech and casual speech.
Despite the various terms being used, the difference in linguistic significance between casual/free speech and careful/reading speech is widely discussed among sociolinguists. In discussing the importance of free speech, Bell (1984) claims that free speech and reading speech are not comparable because they essentially behave differently, with nonstandard speech
occurring frequently in free speech and more standardized speech occurring in reading speech2.
Bell (1984) also highlights the significance of casual speech in sociolinguistic studies, claiming, ‘The hidden agenda of a sociolinguistic interview is to get casual speech’ (p.181). Labov
(1966/2006) goes further in his explanation of the difference between casual speech and careful speech in that careful speech can be found not only in reading, but also in an unnaturally formal conversation, including a sociolinguistic interview which contains formally stated questions; casual speech, then, must be induced by way of everyday conversation. He also writes that certain kinds of reading can also make speech less formal, requiring less speaker attention and yielding casual speech, such as a narrative text. All of these claims seem related to Bell’s (1984) concept of attention; if careful speech has a high level of attention, then speakers may be affected by that.
Formality, style, and attention seem to inevitably intersect, and while casual speech seems to be important to obtain in a sociolinguistic study, careful speech does not seem to be deemed unreliable in sociolinguistics, but rather simply different than casual speech. Also, while casual speech seems to only occur in conversation, careful speech does not necessarily occur only in reading. This paper primarily uses the terms careful speech and casual speech due to the fact that they are used in the previous studies of Boston (r), and for the sake of this specific study, these terms are meant to represent the concepts of reading speech and free speech as well.
2.2.3 Gender and language
Mooney and Evans (2015) claim that gender is a social construct that is done, or performed, through the way people conduct themselves in society and interact with others, as opposed to sex, which is simply a biological category. One way that gender is performed is through language, a concept which was somewhat pioneered by Lakoff (1973). It should be noted that before Lakoff, and even still after, some linguists still use the term sex when seemingly
discussing gender, meaning they discuss the social behaviors (i.e. the performance of identity) but relate it to sex rather than gender; this can be somewhat problematic as men and women are generalized to behave like others in their biological category (Mooney & Evans, 2015). It should also be noted that while Lakoff was widely criticized, such as by Dubois and Crouch (1975),
2 Nonstandard speech consists of local accents, such as the Boston accent, while standardized speech consists of non-regional, more widely accepted accents, such as General American.
who claim that Lakoff’s theories are almost entirely based on personal observations, she seems to be considered an integral theorist in both linguistics and gender studies.
In the discussion of performing gender, Lakoff (1973) explains that women’s language often follows a pattern of characterization, such as avoiding swear words, using fillers (e.g. kind
of), high levels of politeness, and more standardized speech. These characteristics are not
necessarily the fundamental aspects of women’s speech, but rather culminate in society’s expectation of how women should speak, and this concept works in the same way for men. Essentially, the basic stereotype, which Mooney and Evans (2015) present as not actually true, is that women tend to use less powerful language and men tend to use more powerful language. While this stereotype is not necessarily accurate, it does bring to light the fact that gender, power, and language are rather inseparable concepts.
While power dynamics between men and women have been studied immensely, and an entire literature study could be devoted to the topic, this paper will primarily remain focused on the language aspect of gender performance, but power dynamics are important to understand on a basic level. One theory in particular is useful in understanding how language performance can be affected by power differences between men and women: Spender’s (1980) theory, which essentially claims that men tend to dominate language groups just as they do in other aspects of society, provides a necessary understanding of this topic. In addition to this, a number of theorists including Fischer (1958) and Labov (1966/2006) argue that men tend to embrace their local accents while women tend to have more standardized speech, and this can be specifically applied to (r)3. Labov (1966/2006) claims that women tend to have a negative attitude towards
their local accents, while men favor theirs; he also claims that women tend to put more effort into changing their accents. Labov (1966/2006) believes all of this is related to women showing more ‘linguistic insecurity’ than men (p. 279).
2.2.4 Other social factors affecting language
The following three social factors will be studied in relation to gender: age, level of education, and occupation. Regarding age, Labov (1966/2006) claims that younger speakers have a lower frequency of (r), and that they put more effort into changing their speech; he believes this has to
3 It should be noted that some specific studies have not always found a gender difference in regard to (r), such as Irwin and Nagy, which will be discussed in the Previous studies section of this paper.
do with younger speakers having a potentially more refined education. Feagin (1990) agrees with Labov regarding the return of r in non-rhotic accents, claiming that non-rhotic accents are
becoming more rhotic with every new generation. Regarding both education and occupation, a speaker’s level of education and income are, according to Labov (1966/2006), indicators of social class (a higher education and income indicate a higher social class). Higher social classes tend to exhibit more standardized speech, and thus (r) occurs less frequently among those with a higher level of education or a well-regarded and higher paying occupation (Fischer, 1958; Labov, 1966/2006). A higher level of education is particularly associated with the return of r in younger generations, which may have just as much to do with social circles, peer influences, and conformity as it does with the actual education and courses (Labov, 1966/2006; Feagin, 1990).
2.3 Previous studies
While Boston (r) has been mentioned in larger studies of (r) in the United States, there are two previous studies exclusively about (r) in the Boston accent: Irwin and Nagy’s 2007 study
involving careful speech and Levy’s 2010 study involving casual speech. This paper uses aspects of both studies in its method and analysis, and this section describes those studies and is
accordingly divided into the following two subsections: Irwin and Nagy and Levy.
2.3.1 Irwin and Nagy
Following various studies of (r) in the United States, Irwin and Nagy’s 2007 study, ‘Bostonians /r/ speaking: A quantitative look at (R)4 in Boston,’ was the first quantitative analysis of (r) to be
done in Boston. The study solely focuses on careful speech, and the authors pose the following three research questions:
(1) What internal constraints affect variation in coda /r/ in Boston? (2) How does (R) vary with social factors?
(3) Is the Boston r-less pronunciation receding?
To answer these questions, Irwin and Nagy approached strangers in public and asked them to participate in a university study. They began by confirming that participants were native
Bostonians before recording them, and speakers also filled out a demographic questionnaire, but
4 Irwin and Nagy use (R) whereas this paper uses (r) following Labov (1966/2006), although they are basically the same variable and represent the same thing.
exactly what was asked is unspecified. After gaining permission to record, Irwin and Nagy asked their participants to read a story about the infamous Boston blizzard of 1978. The story was three pages long, composed of two texts that were slightly edited by the authors, and contained 224 words with post-vocalic r.
The authors ultimately interviewed 24 lifelong Boston residents that consisted of 12 females with an average age of 52 and 12 males with an average age of 58. They provide a distribution of speakers’ income (based on their occupation) as well a distribution of speakers’ level of education; both of these distributions are separated by sex5. Besides giving the average
age for males and females, the authors do not provide an in-depth distribution of speakers’ age. For their analysis, the authors marked either the presence or absence of each r token, and they analyzed a total of nearly 5000 tokens. Irwin and Nagy analyzed (r) in terms of linguistic factors and social factors. The linguistic factor analysis was also somewhat a qualitative analysis, analyzing where (r) tends to occur in words, such as word-medial or word-final, in specific words, and in stressed or unstressed syllables6. Irwin and Nagy did find that speakers were most
likely to pronounce r in NURSE words and that speakers were more likely to pronounce word-final r than non-word-final r, echoing Labov’s claims on rhoticity (1966/2006).
In regard to social factors, Irwin and Nagy analyzed the categories of age and sex (simultaneously), education, and income. While education and income were separated by sex in their initial distributions, they were not in the analysis. The authors found virtually no difference in (r) between males and females overall, but they did find that younger participants were more rhotic regardless of sex, and older women were more rhotic than older men. Also, speakers with a lower level of education, as well as lower income, tended to be more non-rhotic.
2.3.2 Levy
Levy’s 2010 study, ‘The social stratification of (r) in Boston,’ immediately differs with Irwin and Nagy’s in that it solely focuses on casual speech. While Levy does not directly present research questions, his aim is to characterize ‘the sociolinguistic variation and vitality of (r) in Boston in terms of age, sex7, race, social class and city neighborhood.’ To this end, Levy
5 It should be noted that Irwin and Nagy use the term sex when seemingly discussing gender as a social construct. 6 While Irwin and Nagy did somewhat focus on these qualitative linguistic aspects of (r), because of the scope of this paper, the forthcoming investigation will solely contain a quantitative analysis.
employed Labov’s (1966/2006) Rapid and Anonymous methodology, which Labov used in his 1966 study of New York (r).
Following Labov’s method, Levy approached strangers in public wearing plain clothing and asked them a question that has one correct answer. The study took place on the day of a baseball playoff game at Fenway Park in Boston, and Levy’s questions depended on this variable. He asked one of the following two questions depending on where he was in the city:
(1) What’s the closest T stop?
(2) I’m trying to get to the (Red Sox) game (by T) ...
The ‘T’ is the Boston public train system, and the Red Sox are Boston’s local baseball team. Question (1) was asked at Fenway Park and Kenmore square, and question (2) was asked
everywhere else in the city. The answer to these questions had to contain the name of the closest T stop to Fenway Park, ‘Kenmore,’ in order for participants’ responses to be counted; this means Levy only looked at word-final r pronunciation.
A total of 90 participants were ultimately counted, and they were selected based on whether they were at work or going to the Red Sox game; at-work participants were determined by their uniform or current activity (e.g. police officers in uniform, ticket resellers yelling ‘tickets!’, and Red Sox fans dressed in Red Sox attire). Levy recorded participants’ occupation (or status as a Red Sox fan), age, sex, and race. Levy did not ask participants for demographic information, and seemed to determine these aspects himself, even estimating age in ten-year intervals; this is particularly problematic since he could have assumed this information incorrectly.
In presenting his results, Levy provided a table that included an entire demographic distribution with the categories of Sex, Social Class Composite (determined by occupation), Age, and Race8; each category’s corresponding factor weight for (r) was presented in the same table. Participants were, for the most part, not evenly distributed, which seemed to be accounted for statistically. Levy found that males and females differed significantly in their non-rhoticity, with males being far more non-rhotic, contrary to Irwin and Nagy (2007). He also found that all social classes differed in their non-rhoticity in one way or another, and when social class was separated by sex, females showed a far greater standardization of speech in higher social classes than men.
8 While Levy deals with race, this study does not as all participants happened to be white, although this is something that a future study could focus on.
However, Levy did not find a significant difference in age overall, contrary to Irwin and Nagy’s findings.
Levy’s study was generally executed differently than Irwin and Nagy’s, and while both studies are extensive and informative, they do seem to have a few shortcomings. The present study attempted to take the most useful aspects of the two previous studies (e.g. Levy’s presentation of demographic information and Irwin and Nagy’s separation of education and income) and correct the problematic aspects (e.g. the usage of the word sex when gender is being discussed and the assumption of participants’ demographic information). While the scope of the present study did not allow all aspects of the previous studies to be repeated, an effort was made to combine the two in the best way possible.
3 Design of the present study
The design of the present study is separated into three subsections: Participants, Data elicitation, and Method.
3.1 Participants
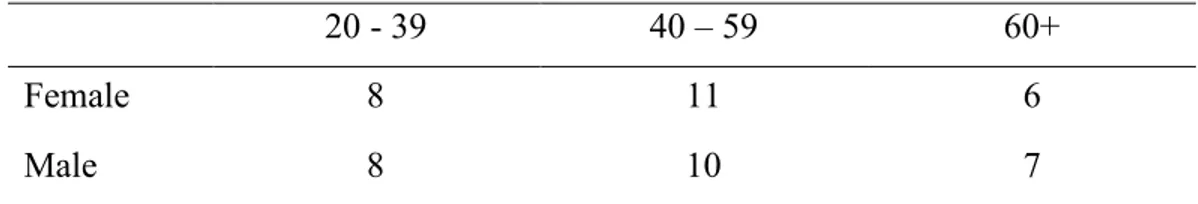
A total of 50 lifelong residents of Greater Boston, consisting of 25 males and 25 females between the ages of 20 and 66, ultimately participated in the study; the following three tables show the demographic distribution of male and female participants according to their age, level of education, and occupation:
Table 1: Distribution of speakers by age
20 - 39 40 – 59 60+
Female 8 11 6
Male 8 10 7
I sought participants who varied evenly in age in order to obtain a relatively even distribution and wide range between the age of males and females; this relatively equal spread is reflected in the data of this table. The average age coincidentally turned out to be 47 for both males and females.
Table 2: Distribution of speakers by level of education
High school Bachelor’s Master’s
Female 1 12 12
Male 4 12 9
It should be noted that age is relatively evenly distributed throughout the category of education.
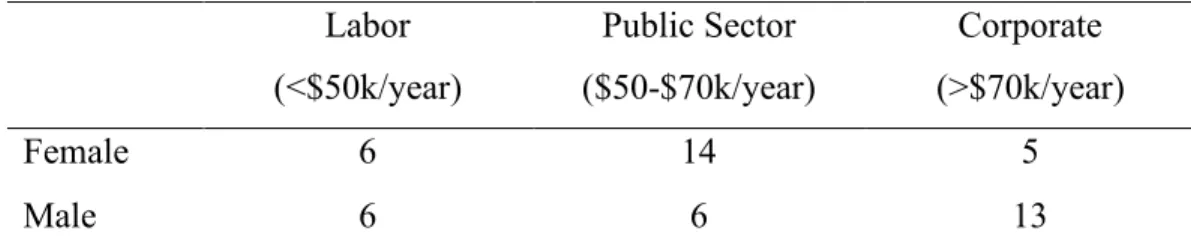
Table 3: Distribution of speakers by job category and estimated income Labor (<$50k/year) Public Sector ($50-$70k/year) Corporate (>$70k/year) Female 6 14 5 Male 6 6 13
Estimated income was gathered from the job-search website Indeed (www.indeed.com) and is provided to show general income variation. Those who fall under the ‘Labor’ category work in fields such as manual labor and as assistants or secretaries; those who fall under the ‘Public Sector’ category work in fields such as education (both as teachers and administrators) and in other public sectors such as nursing; those who fall under the ‘Corporate’ category work for large companies in positions such as sales, engineering, and management. Age is also relatively evenly distributed throughout the category of occupation. Those who work in the public sector or in a corporate job have either a bachelor’s or master’s degree, and most participants with a master’s degree work in higher paying jobs. All of these participants were interviewed and recorded.
3.2 Data elicitation
The data for this study was collected between April 7 and April 14, 2018 in and around Easton, Massachusetts, a Greater Boston9 suburb. Most participants volunteered ahead of time while
others were asked to volunteer on the same day as the interview. Volunteers signed-up or agreed to participate in one of two gender groups, male or female; this was done to try to obtain an even
9 Greater Boston is defined by the 495-highway belt surrounding it, as proposed by Irwin and Nagy (2007), coinciding with the US Census Bureau
number of male and female participants before I arrived in Easton to collect data, as I had a limited amount of time to do so. I did not tell participants the purpose of the study beforehand; they were told that they were taking part in research for my bachelor’s thesis. Participants either went to the home-office I was using or had me come to them at their place of work, and same-day volunteers were often recruited at a previous volunteer’s place of work. In order for volunteers to be able to participate, they had to be lifelong residents of Greater Boston; while over 60 people initially volunteered, a number of them were ineligible due to the fact that they were not born and raised in Greater Boston or had lived somewhere else for a significant amount of time (i.e. a year or more).
Both the careful speech and casual speech of participants were recorded in this study. Casual speech was recorded from a casual conversation between me and the participants, and careful speech was recorded from participants reading a 129-word article. While the
conversation was made to be as casual as possible, there is still a chance that careful speech could have occurred because of the interview setting, and this was taken into account. The topic of both the conversation and the article was a recent spate of storms that hit Greater Boston and particularly affected the town of Easton about a month before the interview. The article, written by Boston.com (‘Over 30,000,’ 2018), is about the vast power outages caused by the storms; it includes the words storm, blizzard, Nor’easter, and power, which all contain at least one instance of post-vocalic r. The purpose of the conversation was to get participants to say those four words in casual speech so that they could be compared with the reading. I did this by asking various questions about the weather, including some or all of the following questions:
• What was the weather like last month?
• I heard there were a couple of storms, can you tell me about those?
• How did the weather personally affect you? And what about your family and friends? • Did you or someone you know lose power?
• Can you tell me the type of storm that occurred?
Conversations varied based on the different answers given by each participant; if necessary, more questions were asked in order to get the participants to say the four words, and fewer questions were asked if all four words were said early on in the conversation. If, for whatever reason, participants continually did not say one or more of the words, I moved on so as not to make the speaker uncomfortable.
3.3 Method
All interviews took place privately behind closed doors at every location. After participants were welcomed into the room, they were asked their age, level of education, occupation, where they are from (i.e. born and raised), where they live now, and if they have lived anywhere else for a year or more; this was done before collecting the actual data in order to help the participants become more comfortable with me. It should be noted that I already recorded the participants’ gender beforehand, and that is why I did not ask during demographic questioning. Also, for assumptions to be avoided, if participants gave vague answers to the demographic questions, they were asked to be more specific; this is the main reason why I did not have participants fill out their own demographic questionnaire.
Once participants confirmed that they were ready to begin recording, they were asked for their name and permission to record. Names were asked to validate the permission given, but participants will otherwise remain anonymous. After permission was granted, the recording of speech began. Recording was done with an iPhone X10 on the Voice Memos application, and
tracks were labeled based on gender and number of the participant: F1 for the first female, M3 for the third male, etc. Once data was collected, all 50 tracks were transferred from the iPhone X to a MacBook Air as MP4 files. Tracks were listened to on iTunes for macOS High Sierra with
Speed-up, an audio-speed-changing application. Tracks were listened to once at regular speed
and an indefinite number of times at half speed thereafter. Studio-quality noise-cancelling headphones were used to ensure no interference when tracks were being listened to.
The first aspect of the recordings that was counted was the r-deletion of the words storm,
blizzard, Nor’easter, and power in both careful speech and casual speech so that they could be
compared in order to answer question (1) of this paper. If participants pronounced their r’s in those words in the same way in careful speech as they did in casual speech, whether they
pronounced or deleted r, those participants were considered to be consistent with their r-deletion and marked as such. While all participants did not say all four words in casual speech, they all at
10 An iPhone microphone, as opposed to a professional microphone, was chosen in consultation with a professional recording artist, who, being an expert in audio technology, recommended an iPhone as long as the recording was taking place in a closed room, which was the case.
least said two of them; when less than four words were said, only those words were used in the comparison. The remaining quantification of data only regarded the reading of the article.
The article contains 32 instances of post-vocalic r, four of which are potential instances of linking r, as well as one instance of potential intrusive r. First, the number of deleted r’s were counted and recorded as a percentage, which were then averaged for males and females
separately. Once averages for (r) were obtained, a two-tailed t-test was performed to determine statistical significance in order to answer question (2) of this paper. The social categories of age, level of education, and occupation were also averaged for both males and females to answer question (3). The significant difference between the number of males and females working in both the public sector and in corporate jobs, as well as the distribution between the categories of education and occupation, are later taken into account.
Linking r’s and intrusive r’s were counted for supplementary observation. If someone was completely rhotic (i.e. pronounced all r’s) the linking r’s and intrusive r were not counted. If someone was at all non-rhotic, the number of possible linking r’s were counted and recorded as a percentage, and those who pronounced the single intrusive r were marked as such. Linking r percentages were averaged separately for males and females, and participants who pronounced intrusive r’s were totaled separately. The reason linking r’s were counted only for supplementary observation is that in order to use them to make a viable linguistic claim, the words that they occur after must occur again. For example, in the text that was read, there is the phrase ‘after a,’ which could be pronounced with a linking r as /æftə r ʌ/, but without the word after occurring again, one cannot tell if the speaker always pronounces the r in after or not. While intrusive r’s occur independently, they were also not used to make any claims.
4 Results and discussion
The Results and discussion section is divided into the following three subsections in order to answer and discuss research questions (1), (2), and (3): Casual speech vs careful speech, Gender, and Other social factors.
4.1 Casual speech vs careful speech
Regarding question (1) and how the consistency of non-rhoticity differs between casual speech and careful speech, all 50 participants were marked as 100% consistent, meaning they all
pronounced r in storm, blizzard, Nor’easter, and power (or some of those words) the same in casual speech as they did in careful speech. However, while all effort was made to have a casual conversation with participants, it is possible that the interview setting had an effect on their casual speech, which could have made it move towards careful speech. It is difficult to tell if this was or was not that case, but it should be taken into consideration as a possibility.
The consistency of these four words was primarily tested in response to Bell’s (1984) claims about careful speech and casual speech. While his general theories about the different types of speech (specifically regarding attention) seemed difficult to test concretely, his more specific claim (that a higher frequency of nonstandard speech occurs in casual speech, while careful speech renders more standardized speech) seemed feasibly testable. The consistency test was aimed at applying Bell’s theory specifically to the Boston accent, and the results show that his theory does apply to the Boston accent in this study since there was no discrepancy between casual speech and careful speech (keeping the potential effect of the interview in mind).
In regard to attention, although it is difficult to prove, for participants who may have had difficulty reading and thus would have to pay more attention to their speech (Bell, 1984), this possibly higher level of attention did not seem to change their natural speech. It is also possible that the type of text that was read by participants, which was rather informative and written like a verbal news report, caused the careful speech to actually become more casual, as Labov
(1966/2006) claims. This does seem like a plausible explanation as to why participants
maintained their accents in careful speech, but another factor could have been at play; the fact that the reading succeeded the casual conversation may have had an effect. If casual speech is essentially induced by way of casual conversation, it could be possible that the natural quality of such a conversation can affect subsequent careful speech. Also, as previously mentioned, since it is possible that careful speech can occur because of the formality of a sociolinguistic interview, there is a chance that their conversational speech was somewhat careful.
Regardless of the exact explanation of the occurrence, it is clear that in the current study Boston (r) is consistent between casual speech and careful speech. The results of this section seem to act as a bridge between Irwin and Nagy’s (2007) careful speech study and Levy’s (2010) casual speech study. Levy attributed the difference between his results and Irwin and Nagy’s to the possible effect of the different types of speech, and Irwin and Nagy even called for a casual speech study to see if there would be a difference. What this study has possibly shown is that no
such difference between casual speech and careful speech seems to exist in the case of Boston (r). While it may not be the case for all linguistic studies, casual speech and careful speech seem to be comparable in this case, which may add validity to the rest of this study since only careful speech is looked at in the forthcoming quantitative analysis.
4.2 Gender differences
Regarding question (2) and how males and females from Greater Boston differ in their level of non-rhoticity, there was a significant effect for gender at p < .005, with men having a higher (r) rate than women. The male group had an average (r) rate of 37%, whereas the female group had an average (r) rate of 19%. Also, only 56% of the women in the study were non-rhotic, whereas 80% of the male participants were non-rhotic; within the non-rhotic speakers, the female group had an average (r) rate of 34%, whereas the male group had an average (r) rate of 40%, showing that men were still more non-rhotic when completely rhotic speakers were not factored in. In regard to the supplementary aspect of linking r’s and intrusive r’s, the rate of linking r’s was virtually the same, at 95% for the female group and 92% for the male group, and both three females and three males pronounced the intrusive r, which seemed to be a random occurrence (again, this will not be analyzed further).
It seems that in this study, Boston (r) has lived up to claims made by Lakoff (1973), Labov (1966/2006), and Fischer (1958) that women tend to exhibit more standardized speech than men. While participants were not asked their opinion of their own accents, it does seem possible that Labov’s (1966/2006) claim that women tend to have a negative attitude toward their accent and put more effort into changing it is a plausible explanation; a questionnaire (or verbal questioning) could be done in a future study in order to see what participants think of their accent and if they have ever made a conscious effort to change it. Also, while there is seemingly no feasible way to directly prove Labov’s (1966/2006) idea of linguistic insecurity in women, it would certainly be a possible explanation if the women did, in fact, have a negative view of their (or their family and peers’) local accent.
In regard to the effect of power on language, there is a possible explanation involving power dynamics in the lower rates of non-rhoticity among Greater Boston females. With Labov’s (1966/2006) theory that women tend to have a negative attitude towards their local accent and try to change it, together with Spender’s (1980) theory that men dominate language groups, the
following is proposed: if men create, maintain, and dominate language groups, and women are essentially subservient in these groups, it seems possible that they would naturally want to break from them, whether consciously or not; this would also tie into Labov’s (1966/2006) theory of linguistic insecurity, since such insecurity could be caused by an uneven distribution of power.
Besides the cause of the results in this section and what they indicate theoretically, they allow the current study to act as an intermediary between the two previous studies. With Irwin and Nagy (2007) finding a difference between male and female non-rhoticity, and Levy (2010) finding no difference, this study is able to claim that there is a difference. The previous studies’ varying results could have been due to a number of different factors, such as the way in which data was collected (Levy’s being more instantaneous and less personal than Irwin and Nagy’s) or the data itself (Levy’s one-word answer versus Irwin and Nagy’s extremely long text).
4.3 Other social factors
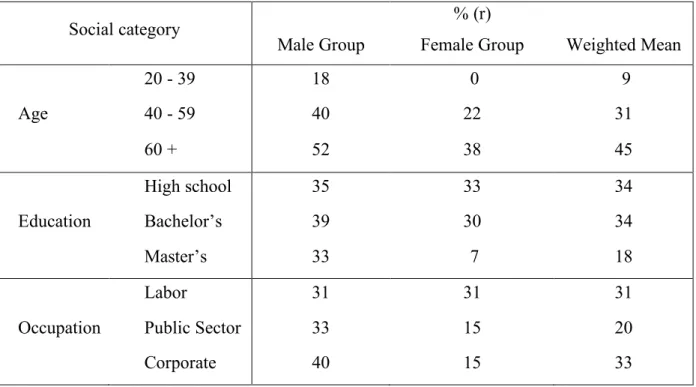
Regarding question (3) and how the non-rhoticity of males and females from Greater Boston differs within the social categories of age, level of education, and occupation, Table 4 shows the average (r) rate in each category by gender, as well as the weighted mean for each category.
Table 4: Average (r) Rate by Social Category in Relation to Gender
Social category
Male Group
% (r)
Female Group Weighted Mean
20 - 39 18 0 9 Age 40 - 59 40 22 31 60 + 52 38 45 High school 35 33 34 Education Bachelor’s 39 30 34 Master’s 33 7 18 Labor 31 31 31
Occupation Public Sector 33 15 20
In terms of the social factors as independent variables, each category seems to portray (r) rates that coincide with the corresponding theories presented by Labov (1966/2006), Fischer (1958), and Feagin (1990) (these theories will be discussed individually throughout this section). Also, the individual rates for males and females in each category corresponds to the overall results regarding gender differences, with males being more rhotic than females in every group but one (the one being the Labor group, which shows an equal (r) rate between males and females). While each social category can initially be looked at independently, they must then be considered in connection with the other categories and, especially in this study, in relation to gender. This section is divided into the following three subsections in order to allow a clear analysis of each social factor: Age, Education, and Occupation.
4.3.1 Age
Regarding age, Labov (1966/2006) and Feagin’s (1990) theory that younger speakers have a lower frequency of (r) is supported in this study, with an average (r) rate of 9% for 20 – 39-year-olds, and a significant increase with the two older generations. Participants were not asked about their personal history besides where they have lived, so the question of whether or not they took speech classes or focused on standardizing their speech more while growing up is not known, which makes it difficult to support Labov’s (1966/2006) explanation that younger speakers are more rhotic possibly because of refined education, but a future study could look into this.
However, the underlying data does show a possible correlation between age and education, as all but one of the 20 – 39-year-olds have at least a bachelor’s degree (education will be discussed more theoretically in the next subsection). Occupation does not seem to have a clear effect within age groups, as it is relatively evenly distributed throughout the category of age.
When looking at age and gender simultaneously, the first number that stands out is the 0% average (r) rate for females age 20 – 39. It seems the combination of the recession of (r) in younger generations and the theory that women tend to have more standardized speech has possibly affected these female participants to such an extent that they are completely rhotic. Again, this could probably be a result of higher levels of education, as all but one female between 20 and 39 have a master’s degree, with the remaining one having a bachelor’s degree. When looking at the male group, the youngest generation of males have a low average (r) rate of 18%, with a relatively even distribution of bachelor’s and master’s degrees, besides one young
male who has a high school education. When comparing the rest of the age groups, males are, on average, 12% less rhotic with each new generation, whereas females have a 16% drop from the oldest generation to the middle generation, and then a 22% drop from the middle generation to the youngest generation, showing a difference between genders in the recession of (r). These results support Irwin and Nagy’s findings that (r) is receding in Boston speech, and they oppose Levy’s findings that it is not.
4.3.2 Education
Regarding education, Fischer (1958) and Labov’s (1966/2006) theory that higher social classes stray more towards standardized speech is supported in this study. Those with a significantly higher level of education (i.e. a master’s degree) are nearly twice as rhotic than those with either a bachelor’s degree or a high school diploma, with an average (r) rate of 18% for the master’s group compared to 34% for both the bachelor’s and high school groups; these results support Irwin and Nagy’s (2007) similar findings. Participants were not asked about their social class (i.e. if they are middle class, lower class, etc.), thus education is used as an indicator of social class, following Labov (1966/2006). Occupation is also an indicator of social class, and while occupation will be discussed in detail in the next subsection, it is useful to look at it within the category of education. With the exception of one participant, those with a master’s degree either work in corporate jobs or in the public sector, thus they seemingly tend to earn more than those with a bachelor’s degree or high school diploma; this possibly perpetuates their lower (r) rates as the combination of a higher level of education and a higher income puts them at a higher social class, which coincides with more standardized speech. Age did not seem to have a clear effect as it was relatively evenly distributed within the category of education.
Regarding gender within the category of education, it is immediately clear that the male group has relatively similar (r) rates among the different levels of education, with the bachelor’s level interestingly having the highest average (r) rate of 39%; this could possibly have to do with social circles that coincide with education, as Labov (1966/2006) and Feagin (1990) claim is a possible influencing factor. The other number that stands out is the 7% average (r) rate for women with a master’s degree, which further shows that when gender is combined with other social factors, the standardization of Boston (r) seems to be perpetuated; these results support Levy’s (2010) similar findings as well.
4.3.3 Occupation
Fischer (1958) and Levy’s (1966/2006) previously mentioned theory on social class is not well supported in the case of occupation, with the highest paid participants who work in corporate jobs having the highest average (r) rate of 33%; the lowest paid participants who work in labor have a similar but lower average (r) rate of 31%, whereas the middle-earning participants who work in the public sector have the lowest average (r) rate of 20%. These results do not support Irwin and Nagy’s (2010) findings that those with a lower income have higher (r) rates. The extremely low (r) rate in the public sector possibly has to do with the fact that the group contains educators, and one might expect educators to have more standardized speech because of the nature of both their occupation and previous education. Also, three-quarters of those who work in the public sector have a master’s degree, with the rest having a bachelor’s degree, which may have had an effect on their speech. It is interesting that those who work in labor do not have the lowest (r) rates, and it is difficult to determine why those who have a higher income have the highest (r) rates, as both groups have a relatively even distribution of education and age.
In terms of gender, the male group seems to directly disprove Fischer (1958) and Levy’s (1966/2006) theory as their (r) rates rise with higher income. This possibly has to do to with social influences and the fact that corporate environments seem to have a large number of males, which is shown on a small scale in this study; the same could be said for females in the public sector. When comparing males and females within occupation groups, it is evident that females have lower (r) rates in the public sector and at the corporate level (15% for both) than men (33% and 40%, respectively). However, males and females did have the same (r) rate of 31% in the Labor group. These results actually support Levy’s (2007) findings that females showed a far greater standardization of speech in higher social classes than men.
6 Concluding remarks
Based on the results of this study, it is clear that gender seems to have a strong effect on Boston (r), with a rather definitive consistency between casual speech and careful speech. Females seem to be leading the standardization of Boston speech on both a general and specific level, with their (r) rates being higher than males in almost every social category; in the categories that are highly rhotic in general, females seem to particularly stand out, such as having an average (r) rate of 0%
in the 20 – 39-year-old age group, and 7% in the master’s degree group. These findings have, for the most part, supported the various theories presented in the background of this study, as well as the previous studies of Boston (r). In potential future studies of Boston (r), one could possibly obtain more personal and historical information from participants, as well as their opinions on their own accents, in order to better explain various phenomena, especially regarding gender. One could also do a more qualitative study and focus on the position of (r) in words and if that differs between casual speech and careful speech. As Boston (r) does seem to be constantly in flux, it would be interesting to see how it behaves in the future.
References
Bell, A. (1984). Language style as audience design. Language in Society, 13, 145–204. Collins, B., & Mees, I. M. (2013). Practical Phonetics and Phonology: A Resource Book for
Students. New York: Routledge.
Dubois, B. L. & Crouch I. (1975). The question of tag questions in women's speech: They don't really use more of them, do they?. Language in Society, 4 (3), 289–294.
Feagin, C. (1990). The dynamics of a sound change in Southern States English: From less to r-ful in three generations. In Edmondson, J. A., Feagin, C., Mühlhäusler, P. (Eds.),
Development and diversity: Language variation across time and space. A Festschrift for Charles-James N. Bailey (pp. 129–146). Arlington, TX: The Summer Institute of
Linguistics and The University of Texas at Arlington.
Fischer, J (1958). Social influences on the choice of a linguistics variant. Word, 14, 47-56. Fitzpatrick, J. (2006). Beantown babble. In W. Wolfram & B. Ward (eds.), American voices:
How dialects differ from coast to coast (63-69). Malden: Blackwell.
Irwin, P., & Nagy, N. (2007). Bostonians /r/ speaking: A quantitative look at (R) in Boston.
University of Pennsylvania Working Papers in Linguistics, 13(2), 136-46.
Labov, W. (2006). The social stratification of English in New York City (2nd ed.). Cambridge: Cambridge University Press. (Original work published 1966)
Lakoff, R. (1973). Language and women’s place. Language in Society, 2, 45–80.
Levy, J. (2010). The social stratification of (r) in Boston. Toronto Working Papers in Linguistics,
33, 1-12.
Mooney, A., & Evans, B. (2015). Language, society, and power: An introduction. New York, NY: Routledge
“Over 30,000 in Massachusetts still have no power two days after blizzard.” (2018, March 15).
Boston.com. Retrieved from
https://www.boston.com/news/local-news/2018/03/15/over-30000-in-massachusetts-still-have-no-power-two-days-after-blizzard
Parslow, R. (1967). The Pronunciation of English in Boston, Massachusetts: Vowels and
Consonants. Doctoral dissertation, University of Michigan, Ann Arbor.
Pyles, T. (1964). The Origins and Development of the English Language. New York: Harcourt, Brace & World, inc.