Abstract
Background: Satiety and sweet craving are strongly influenced by secretion of gastrointestinal hormones,
which are dependent on dietary factors. An Okinawan-based Nordic breakfast with moderately low carbohydrate content and high fat and protein contents has shown increased postprandial satiety, along with improved endocrine and metabolic profile. The primary aim of the study was to estimate the degree of satiety, sweet cravings, and gastrointestinal symptoms, during and after dietary intervention, and to correlate these subjective estimates with anthropometric, metabolic, and hormonal parameters and health-related quality of life (HRQoL). Secondary aim was to correlate the Visual Analogue Scale for Irritable Bowel Syndrome (VAS-IBS) against the HRQoL questionnaire RAND-36.
Methods: Thirty type 2 diabetes patients were given the Okinawan-based Nordic diet during 12 weeks. Blood
sampling, anthropometric measuring and completion of questionnaires about satiety and sweet cravings, VAS-IBS, and RAND-36 were performed at baseline, after 12 weeks of dietary intervention, and after 16 weeks of follow-up.
Results: The satiety was increased after dietary intervention, and sweet craving was decreased, without
correlations with any parameters. These changes persisted throughout the study period (p=0.002). At follow-up, satiety was inversely correlated with GIP (p=0.041) and Social Functioning (p=0.044). Sweet craving correlated with leptin levels (p=0.037), weight (p=0.048), BMI (p=0.001), waist circumference (p=0.006), vitality (p=0.046), and less abdominal pain (p=0.034). Psychological improvement was seen during the dietary intervention, and gastrointestinal symptom reduction afterwards, with correlations between the parameters.
Conclusions: A diet with moderately low carbohydrate content and high fiber, fat, and protein contents
renders an increased satiety and a reduced sweet craving, independently of anthropometric, hormonal, metabolic or psychological factors. Improved psychological well-being and HRQoL preceeds the reports of decreased gastrointestinal symptoms.
High Fiber Fat and Protein Contents Lead to Increased Satiety Reduced
Sweet Cravings and Decreased Gastrointestinal Symptoms Independently
of Anthropometric Hormonal and Metabolic Factors
Bodil Ohlsson1*, Gassan Darwiche1, Bodil Roth1, Mariette Bengtsson2 and Peter Hoglund3
1Department of Internal Medicine, Skane University Hospital, Lund University, Malmo, Sweden 2Department of Care Science, Malmo University, Sweden
3Department of Clinical Chemistry & Pharmacology, Skane University Hospital, Lund University, Lund, Sweden
*Corresponding author: Bodil Ohlsson, Department of Clinical Sciences, Skane University Hospital, Inga Marie Nilsson Street 32, S-205 02 Malmo, Sweden, Tel: +4640331000; Fax: +4640336208; E-mail: bodil.ohlsson@med.lu.se
Received February 24, 2017; Accepted March 20, 2017; Published March 27, 2017
Citation: Ohlsson B, Darwiche G, Roth B, Bengtsson M, Hoglund P (2017) High Fiber Fat and Protein Contents Lead to Increased Satiety Reduced Sweet Cravings and Decreased Gastrointestinal Symptoms Independently of Anthropometric Hormonal and Metabolic Factors. J Diabetes Metab 8: 733. doi: 10.4172/2155-6156.1000733
Copyright: © 2017 Ohlsson B, et al. This is an open-access article distributed under the terms of the Creative Commons Attribution License, which permits unrestricted use, distribution, and reproduction in any medium, provided the original author and source are credited.
Keywords:
Gastrointestinal hormones; Gastrointestinal symptoms; Health-related quality of life (HRQoL); Okinawan-based Nordic diet; Satiety; Sweet cravingIntroduction
Several gastrointestinal hormones are involved in the regulation of appetite control, digestion, and satiety, e.g., cholecystokinin (CCK), ghrelin, glucagon-like peptide-1 (GLP-1), glucose-dependent insulinotropic polypeptide (GIP), insulin, leptin, and polypeptide YY (PYY) [1,2]. Both diet and physical activity have great impact on the hormonal secretion [3,4] and perception of gastrointestinal complaints and quality of life [5]. High protein content in the diet stimulate satiety through several hormones and vagal afferent pathways, and protein has been described as the most potent satiating macronutrient [6]. Also a high fat content stimulates hormone secretion with ensuing slower gastric emptying, which is an important factor for experience of satiety [7,8]. During the last years, patients with functional bowel diseases are recommended to avoid food components with high intake of carbohydrates, to reduce their gastrointestinal complaints [9]. Not only the food content, but also irregularity of food intake may be important for perception of gastrointestinal complaints [5,10].
A modified Okinawan diet has been developed consisting of moderately low carbohydrate content, and higher contents of fiber, fat, and protein, with tastes and food components suitable for the
Nordic population [11]. The diet induced weight reduction, lowered blood pressure, and improvement of metabolic parameters in type 2 diabetes. At the same time, an improvement of health-related quality of life (HRQoL) was observed [11]. Already a single breakfast of the diet rendered improved metabolic parameters with increased satiety compared with a traditional breakfast [12]. In contrast, serum zonulin, a biomarker of increased intestinal permeability [13], was increased during the dietary intervention [14].
Our hypothesis was that this diet influences the sensation of satiety, sweet cravings, and gastrointestinal symptoms through its effects on
hormonal and metabolic parameters. Blood samples were taken before study start, after 12 weeks of dietary intervention, and after 28 weeks when the participants had chosen their own food for 16 weeks. At the same time, the patients had to estimate their satiety, sweet cravings, and gastrointestinal symptoms on visual analog scales (VAS), and HRQoL on RAND-36. The result on anthropometric and metabolic parameters and RAND-36 are presented in a previous report [11]. The objective of the present study was to estimate the degree of satiety, sweet cravings, and gastrointestinal symptoms during and after a dietary intervention, and to correlate these subjective estimates with anthropometric and metabolic parameters and plasma levels of hormones regulating satiety and well-being, i.e., CCK, cortisol, C-peptide, ghrelin, glucagon, GLP-1, GIP, insulin, leptin, plasminogen activator inhibitor-1 (PAI-1), PYY, resistin, and visfatin, and HRQoL.
Subjects and Methods
The subjects were treated according to the Helsinki declaration and the study was approved by the Regional Ethics Review Board at Lund University (2014/460). All subjects were informed written and orally, and gave their written, informed consent before entering the study which was monitored by an external monitor and registered at ClinicalTrials.gov data base (NCT02405806).
Study population
Patients with type 2 diabetes, aged between 18-70 years, were recruited at a primary health care center in the southernmost district of Sweden. Patients were to have both parents inborn in Scandinavia, to avoid possible influence of ethnicity on the study results. They were included in the study independently of body mass index (BMI) or anti-diabetic treatment regimen. Overall exclusion criteria were severe food allergy, and severe heart, pulmonary, cardiovascular, malignant, or psychiatric diseases. Patients with type 1 diabetes mellitus, severe liver insufficiency, defined as spontaneous international normalized ratio (INR)>1.1, or severe renal insufficiency, defined as glomerular filtration rate (GFR)<30 mL/min/1.73 m2, as well as patients with a prior major gastrointestinal surgery were excluded. Patients with known alcohol and drug abuse were not considered for inclusion. Participants were initially informed of the project design and purpose through a letter sent by mail. One week later, all patients were contacted by phone by one of three investigators (BO, GD, physicians, or EL, nutritionist).
Study design
The trial was a clinical prospective interventional study and conducted at Skane University Hospital, Malmo, Sweden, during 12 weeks with a new modified diet, followed by a clinical follow-up after another 16 weeks with unrestricted diets. Food for preparation of lunch and dinner was delivered in a cooler bag home to the subjects three times a week free of charge, along with written information and recipes for meal preparation. Each participant had to prepare their own breakfast. The participants were encouraged to maintain their regular physical activity habits throughout the intervention.The study data consisting of blood sampling; assessments of anthropometric data; and completion of questionnaires was obtained at 3 separate visits: 1) at study start before introduction of the modified diet; 2) after 12 weeks on the modified diet; and 3) after 16 weeks on unrestricted diet (Figure 1). Blood samples were collected through an intravenous catheter after a 10-h fast. Plasma and serum was harvested and stored at -80°C until analyzed for metabolic parameters and hormonal concentrations. The physician and the patient had a discussion about the compliance and ability to follow the dietary recommendations and the degree of
satisfaction with the food composition. A clinical examination including measuring of anthropometric data was accomplished. To estimate the degree of satiety and sweet hunger, a scoring on a visual analogue scale (VAS) was used. To estimate the degree of abdominal symptoms and HRQoL, the Visual Analog Scale for Irritable Bowel Syndrome (VAS-IBS) and RAND-36 were filled in. The data surveys were completed at home one day before the hospital visit. The study started on 2 February 2015 and ended on 18 September 2015.
Diets
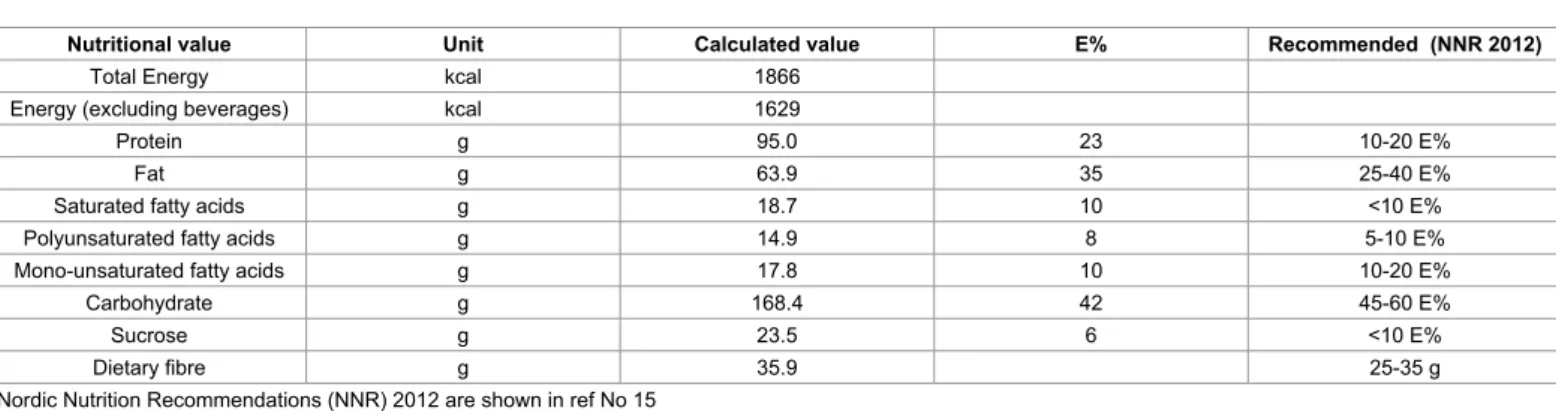
The diet is based on the traditional Okinawan diet [15,16] but modified to suit the Nordic diet with tastes and food components suitable for the Nordic population [11]. The meal composition is consistent with moderately low carbohydrate content [17]. At the same time, the contents of fiber, fat, and protein are increased, which lead to a bigger meal demanding more mastication and prolonged meal intake [12]. The food is based on traditional Nordic raws, e.g., whole grains, vegetables, legumes, root crops, fat fish, birds, fruits, berries, and nuts, with minimal industrial processing. At the same time, the amount of sugar, red meat, processed meat, and dairy products is limited. The diet has a good nutritional supply including a mean calorie intake around 1900 kcal/day, which is slightly lower compared with a traditional diet. The participants were allowed to eat three meals a day including breakfast, lunch, and dinner, and two snacks between meals consisting of a variety of fruits, berries, and seeds. Organic food items were preferred whenever possible. At the occurrence of cravings, the subjects were instructed to eat a third snack (e.g., carrots, boiled eggs, mackerel in tomato sauce, or cottage cheese with berries) to avoid eating fast carbohydrates. Raw vegetables or green salad were to be ingested with the main meals; 100 gram at breakfast and 150 gram at lunch and dinner, respectively. The participants were instructed always to start with the vegetables and to eat slowly. Nutrition information is given in Table 1.
Two breakfast alternatives were ingested, depending on their ordinary breakfast ingested, and the participants bought and prepared the meals on their own. The other meals were planned together with the kitchen of Igelosa Life Science Lab (Lund University) and delivered to the subjects free of charge, along with recipes and instructions on how to cook the food.
No dietary supplements such as fish oil, probiotics or multivitamin drugs were allowed to be introduced during the study period. As most one visit to a restaurant or to another diet per week was allowed. Journeys or a stay during a longer time period at another place had to be discussed with the investigators (BO and GD). Maximal intake of alcoholic beverages was set to 30 g ethanol/week (2.5 glasses wine).
Assessment of clinical variables and anthropometry
The investigation took place under identical conditions by two clinically experienced physicians (BO and GD). Physical examination included cardiopulmonary, abdominal, and neurological examinations as well as measurements of blood pressure, pulse, respiratory rate, weight, height, waist circumference, and assessment of BMI. A protocol was completed including data on presence of diabetic complications; information whether they already were on ongoing weight-reducing diet; intake of dietary supplements, vitamins, and probiotics; changes in medication; physical activity or routines; as well as any extraordinary events of daily life.
Blood sampling and chemistry analyses
ethylenediaminetetra-acetic acid (EDTA) glass tubes (BD Microtainer, New Jersey, USA) or serum separation tubes (SST) with coagulation activator and gel (BD Microtainer). Blood was centrifuged at 3000 rcf for 5 min and plasma and serum was stored in -80°C until analyzed. Cortisol, C-peptide, and insulin in serum and plasma glucose and blood hemoglobin A1c (HbA1c) were analyzed by standard methods in the Department of Clinical Chemistry. Zonulin was measured in serum and feces according to the manufacturer´s instructions, previously described [14].
Hormonal analyses
The Luminex analyses were performed within 9 months. Human diabetes 10-plex panel (Bio-Plex Pro™ Human Diabetes Immunoassay control no 5029560-1 and 5040782, Bio-Rad Laboratories, CA, USA) was performed on the Luminex-200 (Luminex xMAP, Bio-Rad
Laboratories) and data were analyzed using Bio-Plex Manager software 6.0 (Bio-Rad Laboratories). Hormones (pg/ml) measured were ghrelin, glucagon, GLP-1, GIP, leptin, PAI-1, resistin, and visfatin. For more details about the analyses, see Ohlsson et al. [12]. CCK and PYY were analyzed by ELISA according to the manufacturer´s instruction (Cloud-Clone Corp. Houston, USA, CEB802 Hu and CEB067 Hu, respectively).
Questionnaires
Satiety and sweet cravings
The patients completed one VAS for satiety and one VAS for sweet cravings at 12 weeks and at 28 weeks after study start, according to previous validation [18]. These items were measured on a scale from 0-100, where 0 represents no satiety or no sweet cravings, respectively, and 100 represents a maximal feeling of satiety or maximal feeling of Figure 1: Flow-chart of patient recruitment and study design. VAS-IBS=Visual Analog Scale for Irritable Bowel Syndrome. Two patients interrupted the
study at 6 weeks on diet, and data collected at that time point was calculated together with data from patients with 12 weeks of intervention.
Nutritional value Unit Calculated value E% Recommended (NNR 2012)
Total Energy kcal 1866
Energy (excluding beverages) kcal 1629
Protein g 95.0 23 10-20 E%
Fat g 63.9 35 25-40 E%
Saturated fatty acids g 18.7 10 <10 E%
Polyunsaturated fatty acids g 14.9 8 5-10 E%
Mono-unsaturated fatty acids g 17.8 10 10-20 E%
Carbohydrate g 168.4 42 45-60 E%
Sucrose g 23.5 6 <10 E%
Dietary fibre g 35.9 25-35 g
Nordic Nutrition Recommendations (NNR) 2012 are shown in ref No 15
Table 1: Nutrition composition and daily mean intake of energy, nutrients, and food components of the modified Okinawan-based Nordic diet, compared with Nordic Nutrition Recommendations (NNR) 2012.
for disappearance. Two patients interrupted the study at 6 weeks on diet, which time point was considered as end of the intervention, and data collected at that time point was calculated together with data from patients with 12 weeks of intervention.
We tested the hypotheses with linear mixed effect models to analyze continuous variables, with random intercept and unstructured covariance’s for repeated measures within a patient, with visits as nominal fixed effect, using baseline as reference. We assumed that missing observations were unrelated to the observed value, i.e., missing at random. In these analyses predicted mean values and their 95% confidence limits are presented, together with estimates of changes from baseline and 95% confidence limits and p-values for the changes. Fisher´s exact test was used for dichotomous variables and Spearman´s correlation test for correlation of continuous variables. Mann-Whitney U test was used for comparisons of VAS scales for satiety and sweet craving and values are presented as median and interquartile ranges. Descriptive statistics are presented as means and standard deviations (SD) for continuous variables and as counts or frequencies for categorical variables. Statistics were done using MATLAB R2015a (Mathworks Inc.) or IBM SPSS Statistics 23 (Statistical Package for the Social Sciences). P<0.05 was considered statistically significant.
Results
Basal characteristics
In total, 45 patients were randomly selected after consideration of inclusion and exclusion criteria. Of these, 30 patients (17 women), mean age 57.5 ± 8.2 years, were included from 45 invited patients (Figure 1). Reasons for not inclusion were: unwillingness to participate (n=11), late autoimmune diabetes in adult (LADA) (n=1), a history of gastric by-pass surgery (n=1), pregnancy (n=1), or already on a diet (n=1).
The duration of type 2 disease was 10.4 ± 7.6 years. The treatment given was metformin (40%), metformin in combination with insulin (27%), insulin solely (13%), metformin in combination with sulfonylurea (7%), diet solely (7%), sulfonylurea (3%), or dipeptidyl peptidase-4 (DPP) (3%). The most common secondary complication to the disease was autonomic neuropathy and/or peripheral neuropathy (30%), retinopathy (27%), and nephropathy and macroangiopathy (17% in both). Only one patient had a verified gastroparesis.
Sixteen percent had only completed primary school, 57% had completed high school, and 27% had higher education. The majority was employed, 67%, whereas 17% were retired. The rest of the patients were on sick leave or unemployed. Twenty of the patients were married or cohabitant, whereas six were divorced or widow/widower and four were living alone. Smoking and snuffing or both occurred in 23% of the patients.
An alcoholic beverage was ingested by half of the patients once a month or less, by 27% for 2-4 times a month, by 13% for 2-3 times a week, and 0% were teetotalers. A moderate physical exercise during leisure time was most common (53%), followed by moderately regular exercise (27%), regular exercise and training (13%), and sedentary leisure time (7%). Antihypertensive medication was prescribed in 63% of patients and lipid-lowering medication in 47%.
Only 2 patients had sole dietary treatment of the diabetes. In 15 subjects, the anti-diabetes medication was gradually reduced during dietary intervention, and two subjects, one with both oral hypoglycemic agents and insulin, had their medication cancelled. Of the other 12 subjects with insulin treatment, three had their insulin therapy cancelled sweet cravings, respectively. At 12 and 28 weeks after study start, the
patients also had to answer the questions: “Can you imagine to continue with this kind of food regime?”, “How strong is your satiety today compared with the feeling of satiety at study start and at dietary stop after 12 weeks, respectively?”, and “How strong is your sweet hunger today compared with the feeling of sweet hunger at study start and at dietary stop after 12 weeks, respectively?”. The questions had to be answered to the same degree, less, or more.
Visual analog scale for irritable bowel syndrome
The VAS-IBS was used to investigate gastrointestinal complaints in the study groups before study start, and at 12 and 28 weeks afterwards. VAS-IBS is a validated self-rating questionnaire for estimation of the most common gastrointestinal complaints in patients with non-organic, functional bowel disease experienced during the last 2 weeks [19]. This questionnaire has also been validated for estimation of symptoms over time [20]. The seven items measured in the VAS-IBS address the symptoms abdominal pain, diarrhea, constipation, bloating and flatulence, nausea and vomiting, psychological well-being, and intestinal symptoms´ influence on daily life. These items were measured on a scale from 0-100, where 0 represents severe problems and 100 represents a complete lack of problems. An additional two questions, if the subject experienced urgency to defecation and had a sensation of incomplete evacuation, were answered with yes or no.
Health-related quality of life questionnaire (RAND-36)
HRQoL refers to how health impacts on a person´s ability to function in daily life, and the persons perceived well-being in physical, mental and social domains of life [21]. The widely used and well-validated self-report questionnaire RAND 36-Item Health Survey was applied to evaluate HRQoL in present study. This questionnaire has been used to measure HRQoL in many various diseases, and normal references values are available [22]. Rand 36-items comprises eight health concepts with multi-item scales (35 items): Physical Functioning (PF) (10 items); Role function limitations caused by Emotional problems (RE) (3 items); Role function limitations caused by Physical health problems (RP) (4 items); General Health (GH) (5 items); Social Functioning (SF) (2 items); Mental Health based on emotional well-being (MH) (5 items); Vitality related to energy and fatigue (VT) (4 items); and Bodily Pain (BP) (2 items). An additional single item assesses change in perceived health during the last 12 months. These parameters are valuable to estimate the effects evoked in daily life, by a change in life style factors. The few minor differences between SF-36 and RAND-36 have been described by Hays et al. [23].Statistical methods
Two hypotheses were raised: 1) a diet with low carbohydrate content and high fat and protein contents renders higher satiety and lower sweet cravings and affects gastrointestinal symptoms and 2) the regulation of satiety, sweet cravings, and gastrointestinal symptoms are affected by anthropometric, hormonal, and metabolic factors and HRQoL.
A power analysis was performed based on a previous unpublished pilot study, and we determined that nine subjects was required to demonstrate clinically significant differences in metabolic parameters with 80% power at 5% significance level. We expected that diastolic blood pressure was the variable demanding most subjects to be able to discover, and that we needed 18 persons to demonstrate clinically significant differences in diastolic pressure with 80% power at 5% significance level. We planned to recruit 25-35 persons to compensate
the dietary intervention, and the decrease remained after 28 weeks, as also was true for fasting glucose and HbA1c (Table 5). The fasting levels of CCK (mean change=-7 pg/ml, p=0.005), cortisol (mean change=-41 pg/ml, p=0.015), C-peptide (mean change=-0.11 pg/ ml, p=0.022), glucagon (mean change=-0.66 pg/ml, p=0.003), GLP-1 (mean change=-0.88 pg/ml, p=0.0GLP-13), GIP (mean change=-23 pg/ ml, p<0.001), insulin (mean change=-6.43 pg/ml, p=0.004), leptin (mean change=-3554 pg/ml, p<0.001), and PYY (mean change=-427 pg/ml, p<0.001) were decreased at week 12 compared with baseline, and after 28 weeks, ghrelin (mean change=-123 pg/ml, p=0.012), PYY (mean change=-264 pg/ml, p=0.002), and visfatin (mean change=-186, p=0.021) was lowered, compared with baseline. Serum zonulin increased during the dietary intervention, and the increased zonulin levels persisted throughout the follow-up. Feces zonulin increased during the dietary intervention, but returned to basal levels when the intervention was stopped (Table 5).
Correlations between satiety, sweet cravings, gastrointestinal
symptoms, and anthropometric, hormonal, and metabolic
parameters, and HRQoL
Satiety or sweet cravings did not correlate with any parameters after the dietary intervention. At follow-up, satiety correlated inversely with GIP (rs=-0.450, p=0.041) and Social Functioning (rs=-0.433, p=0.044). At the same time, sweet cravings correlated with leptin (rs=0.458, p=0.037), weight (rs=0.426, p=0.048), BMI (rs=0.651, p=0.001), and waist circumference (rs=0.565, p=0.006). Furthermore, sweet cravings also correlated with vitality (rs=0.430, p=0.046) and less abdominal pain (rs=0.453, p=0.034). No other anthropometric parameters, nor fasting levels of hormonal or metabolic parameters correlated to the overall sensations of satiety and sweet cravings measured in VAS scales (data not shown).
The only anthropometric, hormonal or metabolic correlation with any VAS-IBS scale at baseline was the correlation between less symptoms of bloating and flatulence and BMI (rs=0.463, p=0.009) and C-peptide (rs=0.405, p=0.026), and between less constipation and BMI (rs=0.490, P=0.006). The improvements of anthropometric, hormonal or metabolic parameters during dietary intervention or at follow-up were not reflected by a corresponding improvements in symptoms or psychologic well-being (data not shown). The only correlation between zonulin and gastrointestinal symptoms was a weak inverse correlation between feces zonulin and nausea and vomiting at follow-up (rs =-0.445, p=0.033), indicating higher feces zonulin levels in patients with more nausea and vomiting.
The improvements in HRQoL preceded the improvements in gastrointestinal symptoms (Tables 3 and 4). Psychological well-being estimated by VAS-IBS correlated with Social Functioning and Mental Health (Table 6). There was no correlation between the participants scoring in VAS-IBS of abdominal pain and Bodily Pain in RAND-36 (rs=0.275, p=0.141). However, there were correlations between their and another eight had their insulin doses reduced.
Compliance and satisfaction
When answering the question about more, less or the same degree of satiety or sweet cravings at week 12, the majority of patients experienced more satiety (60%) and less sweet cravings (83%) compared with prior study start. The majority of patients at week 28, experienced the same degree of satiety and sweet cravings as at week 12. The dietary influence on sweet cravings was greater than on satiety (Table 2).
When scoring the overall degree of satiety on a VAS scale, the patients scored their satiety to 75 (67-82) at week 12 and to 69 (60-78) at week 28 (p=0.264). The overall sweet cravings was scored to 29 (21-38) and 41 (31-52) at the two time points, respectively, with a tendency of increased sweet cravings at week 28 (p=0.06).
Prior study start, most of the participants had irregular food habits. One of the major changes during the study was thus to keep regular meals. At the follow-up after 28 weeks, only 2-3 patients out of 23 were prepared to completely change their life style and fully adhere to the dietary regime for the future. Almost all of the participants wanted to mainly adhere to the dietary regime. Compared with previous study start, the majority had: 1) kept the breakfast recommended; 2) continued with more fruits and vegetables as snacks instead of cakes; and 3) tried to keep regular meals. Those who adhered to this regime had not regained the weight reduction (individual data not shown).
Gastrointestinal symptoms
At week 12, the mean scores for the VASs improved and were significantly better for diarrhea (p=0.022), bloating and flatulence (p=0.025), and psychological well-being (p=0.001) compared with baseline. At week 28, the mean scores for abdominal pain (p=0.049) and nausea and vomiting (p=0.028) were significantly better compared with baseline, and there were further improvements in the mean scores for diarrhea (p=0.002) and bloating and flatulence (p=0.003). The largest improvement during the study was observed in the bloating and flatulence scale (Table 3).
Health-related quality of life
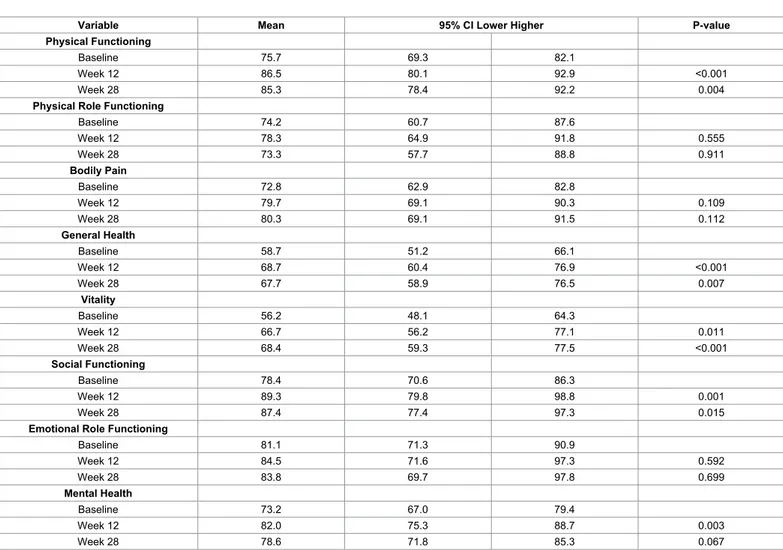
At week 12, the mean scores for the RAND-36 scale improved and were significantly higher for Physical Functioning (p<0.001), General Health (p<0.001), Vitality (p=0.011), Social Functioning (p=0.001), and Mental Health (p=0.003) after dietary intervention. The increase in the Vitality scale peaked at week 28 (p<0.001). Even though the other scale scores had declined at this point, the mean increase in Physical Functioning, General Health, and Social Functioning were still significantly improved relative to baseline (Table 4).
Anthropometric, hormonal and metabolic changes
Weight, BMI and waist circumference were decreased during
Satiety P- value Sweet cravings P-value
Same More Less Same More Less
Week 12 (n=30)
Vs. baseline 8 (27) 18 (60) 4 (13) 1 (3) 4 (13) 25 (83)
Week 28 (n=23)
Vs. baseline 13 (57) 8 (35) 2 (9) 8 (35) 1 (4) 14 (61)
Vs. week 12 17 (74) 3 (13) 3 (10) 0.239 16 (70) 4 (17) 3 (13) 0.002
The experience of satiety and sweet cravings at week 12 and week 28 in comparison with baseline and week 12 after 3 months of dietary intervention. N=30 at study start. Values are presented as number and percentage. Fisher´s exact test. P<0.05 was considered statistically significant.
Variable Mean 95% CI Lower Higher Mean change 95% CI Lower Higher P-value Pain Baseline 82.9 76.5 89.3 Week 12 88.2 81.4 95.0 5.3 -0.7 11.3 0.081 Week 28 89.3 82.2 96.3 6.4 0.0 12.7 0.049 Diarrhea Baseline 80.0 73.2 86.7 Week 12 87.8 80.3 95.2 7.8 1.1 14.5 0.022 Week 28 90.6 83.2 97.9 10.6 4.1 17.1 0.002 Constipation Baseline 87.1 81.4 92.9 Week 12 84.1 75.8 92.4 -3.0 -10.7 4.7 0.442 Week 28 87.9 81.4 94.5 0.8 -5.1 6.7 0.785
Bloating and flatulence
Baseline 70.7 61.9 79.6
Week 12 80.2 69.2 91.3 9.5 1.2 17.8 0.025
Week 28 82.3 71.8 92.8 11.6 4.0 19.1 0.003
Nausea and vomiting
Baseline 93.3 89.8 96.9 Week 12 94.8 90.7 98.8 1.4 -1.0 3.9 0.248 Week 28 96.0 92.0 100.3 2.7 0.3 5.1 0.028 Psychological well-being Baseline 76.6 69.9 83.3 Week 12 86.6 79.8 93.4 10.0 4.0 16.0 0.001 Week 28 84.1 75.6 92.6 7.5 -0.5 15.4 0.064
Influence on daily life
Baseline 80.6 72.0 89.2
Week 12 82.5 7.8 92.3 1.9 -6.9 10.8 0.664
Week 28 86.7 77.4 96.1 6.1 -2.2 14.5 0.149
The mean values and mean changes are given for pain, diarrhea, constipation, bloating, nausea, psychological well-being and intestinal symptoms influence on daily life at inclusion (baseline), 12 weeks after diet intervention, and 12 weeks after the end of diet intervention (week 28). These items were measured on a scale from 0-100, where 0 represents severe problems and 100 represents a complete lack of problems. The 95% confidence interval with higher and lower limits are shown. Linear mixed model. P-value<0.05 was considered statistically significant.
Table 3: Visual analog scale for irritable bowel syndrome (VAS) for evaluation of gastrointestinal symptoms. scoring of abdominal pain in VAS-IBS and Vitality (rs=0.476, p=0.008)
and General Health (rs=0.401, p=0.028) in RAND-36. Also the scoring for the items diarrhea (rs=0.412, p=0.024), and the patients perceived bowel symptoms influence on daily life (rs=0.418, p=0.021) in VAS-IBS, correlated to Vitality in RAND-36 (Table 6).
Discussion
In compliance with the present study results, we accepted the research hypotheses that a dietary modification may increase the satiety and reduce sweet cravings. Gastrointestinal symptoms correlated with psychological well-being and HRQoL, but the improvement in psychological parameters preceded improvement in gastrointestinal symptoms. On the other hand, we rejected the research hypothesis that changes in satiety, sweet cravings, and gastrointestinal symptoms correlated with changes in anthropometric, hormonal, and metabolic variables.
After an acute weight loss, the body react with increased appetite to regain weight, reflecting a continuing role for the gut-brain axis in regulation of food intake and maintenance of body weight [24]. It is therefore astonishing that satiety levels remained the same or stronger during the trial, when the subjects ingested a lower calorie intake than usual and lost in weight. Surprisingly, there was no correlation between feeling of satiety or sweet cravings in the present study and any appetite-regulating hormones such as CCK, ghrelin, GLP-1, insulin, leptin, and PYY (1, 2, 3, 4), indicating other underlying possible mechanisms of satiety. This is in line with that increased postprandial satiety after a
single Okinawan-based breakfast did not either correlates with any hormone levels [12].
The gastric volume is strongly correlated to the feeling of hunger and satiation since it is the degree of gastric distention which is the major determinant of satiation and satiety [7]. The Okinawan-based Nordic diet contained a great amount of fibers in the form of vegetables, legumes, and whole-grain products. This means greater food volume and increased gastric distention, which may explain the increased satiety in absence of elevated hormonal levels. Furthermore, the fiber-rich diet demands more chewing and constitutes a slower eating pattern with increased mastication. The sight of a greater food volume and mastication stimulate the cephalic phase responses [25]. Mastication also has a direct effect on satiety through histamine activation of para-ventricular nucleus and ventromedial hypothalamus [26]. Experimental trials in healthy volunteers have shown that food intake with increased mastication induces less feeling of hunger and desire to eat [27], and slower eating leads to increased satiety scoring [28]. In analogy, epidemiological studies show that fast eating is associated with increased BMI and insulin resistance [29,30].
The rate of gastric emptying is a further major determinant of postprandial satiety [7]. The delivery of luminal content to the intestine stimulate gut hormone secretion and these hormones stimulate directly at the level of the hypothalamic arcuate nucleus, or indirectly through afferent vagal neurons, at the area of postrema and the nucleus tractus solitaries [7]. There is a relatively high inter-individual variation in the
rate of gastric emptying, whereas the intra-individual variation is low when subjects are eating the same diet [31]. Several studies indicate that the addition of viscous soluble fibers to the meal [32], as well as fibers naturally present in food [33], reduces the gastric emptying rate and the glycemic response to a test meal. Delayed gastric emptying leads to a sustained gastric distention and a prolonged exposure of nutrients and energy to the intestinal lumen [7].
High protein intake induce the production of anorexigenic gut hormones, amino acids, and metabolites, which activates the arcuate nucleus and nucleus tracts solitaries in the brain, resulting in satiety, reduced food intake, and delayed gastric emptying [6]. Consequently, high protein intake often leads to weight reduction [6]. However, fat content, and not protein content, is the major determinant of gastric emptying rate [8,34]. The amount of energy intake was reduced after both lipid and protein intake. Furthermore, the eating-inhibitory effect of lipid was most likely mediated by gastrointestinal hormones and mechanisms, whereas other factors than gut hormones mediated the effects of protein [3,8]. The gastric emptying rate was not measured in the present study. Nevertheless, the food contained more fibers and greater volume than traditional food, as well as more fat and more protein, which most likely resulted in a delay in gastric emptying and activation of hypothalamic structures, and consequently, also an increased satiety.
In experimental trials, prior exposure to sucrose solutions increase sucrose preference by a positive feedback cycle [35]. Enteroendocrine cells in the gut harbor sweet taste receptors which are implicated in sweet taste preference. Several appetite regulatory peptides modulate taste sensitivity through these receptors [36]. The Okinawan-based Nordic diet contained almost no refrained sugar. Since different carbohydrate sources affect the central reward systems differently, the food composition could explain the development of less cravings for sweets [36], which was seen independently of the hormone profile. The concomitant increase of satiety along with less hunger for sweets, may efficiently contribute to sustained, lowered body weight. The sweet cravings was reduced during introduction of the diet, and this reduction persisted afterwards. Although the participants did not fully adhere to the new recommendations, most of them had kept regular meals, a healthy breakfast, and a great daily intake of fruits and vegetables. These simple habits seem to be of importance to maintain satiation and a low sweet cravings.
Since VAS-IBS and RAND-36 have different focus and the questions are not equivalent, it is not possible to validate VAS-IBS against RAND-36. However, it is possible to correlate the questions. There were correlations between the participants´scoring of their symptoms in VAS-IBS and HRQoL in RAND-36 in some points, which shows that physical and psychological factors influence vitality, general well-being, and daily life. This is also described in the literature for
Variable Mean 95% CI Lower Higher P-value
Physical Functioning
Baseline 75.7 69.3 82.1
Week 12 86.5 80.1 92.9 <0.001
Week 28 85.3 78.4 92.2 0.004
Physical Role Functioning
Baseline 74.2 60.7 87.6 Week 12 78.3 64.9 91.8 0.555 Week 28 73.3 57.7 88.8 0.911 Bodily Pain Baseline 72.8 62.9 82.8 Week 12 79.7 69.1 90.3 0.109 Week 28 80.3 69.1 91.5 0.112 General Health Baseline 58.7 51.2 66.1 Week 12 68.7 60.4 76.9 <0.001 Week 28 67.7 58.9 76.5 0.007 Vitality Baseline 56.2 48.1 64.3 Week 12 66.7 56.2 77.1 0.011 Week 28 68.4 59.3 77.5 <0.001 Social Functioning Baseline 78.4 70.6 86.3 Week 12 89.3 79.8 98.8 0.001 Week 28 87.4 77.4 97.3 0.015
Emotional Role Functioning
Baseline 81.1 71.3 90.9 Week 12 84.5 71.6 97.3 0.592 Week 28 83.8 69.7 97.8 0.699 Mental Health Baseline 73.2 67.0 79.4 Week 12 82.0 75.3 88.7 0.003 Week 28 78.6 71.8 85.3 0.067
The mean values and mean changes are given for eight health concepts at inclusion (baseline), 12 weeks after diet intervention, and 16 weeks after the end of diet intervention (week 28). The 95% confidence interval with higher and lower limits are shown. Linear mixed model. P-value<0.05 is considered statistically significant.
Variable Mean Lower Upper P-value fasting Glucose (mmol/L)
Baseline 9.71 8.54 10.87 Week 12 7.91 6.55 9.27 <0.001 Week 28 9.28 7.71 10.85 0.466 HbA1c (mmol/mol) Baseline 61.57 56.42 66.72 Week 12 49.20 44.02 54.38 <0.001 Week 28 54.36 48.83 59.90 0.002
C-peptide (nmol/L; serum)
Baseline 0.99 0.82 1.17 Week 12 0.88 0.70 1.05 0.015 Week 28 0.88 0.68 1.09 0.108 Zonulin (ng/ml; serum) Baseline 79.9 71.3 88.5 Week 12 92.9 83.5 102.3 0.019 Week 28 95.1 84.2 105.9 0.014 Zonulin (ng/ml; feces) Baseline 49.4 38.3 60.4 Week 12 92.3 71.3 113.2 <0.001 Week 28 53.5 40.4 66.6 0.572 Weight (kg) Baseline 89.8 84.5 95.1 Week 12 83.6 78.1 89.0 <0.001 Week 28 85.4 79.7 91.1 <0.001 BMI (kg/m2) Baseline 29.9 28.4 31.3 Week 12 27.8 26.3 29.4 <0.001 Week 28 28.4 26.8 30.0 <0.001 Waist circumference (cm) Baseline 107.3 103.4 111.2 Week 12 100.3 96.1 104.4 <0.001 Week 28 101.7 97.6 105.9 <0.001
BMI=Body Mass Index, Hba1c=Hemoglobin A1c. The mean values and 95% confidence interval with lower and upper and lower limits are presented for fasting plasma levels of glucose and blood levels of hba1c at inclusion (baseline), 12 weeks after diet intervention, and 16 weeks after the end of diet intervention (week 28). Linear mixed model. p-value<0.05 was considered statistically significant.
Table 5: Anthropometric and metabolic biomarkers.
Psychological well-being Abdominal pain Diarrhea Bowel symptoms influence on daily life
Vitality rs=0.476 p=0.008 rp=0.024s=0.412 rp=0.021s=0.418 General Health rs=0.401 p=0.028 Social Functioning rp=0.001s=0.438 Mental Health rs=0.436 p=0.018
There were no other correlations between items in Visual Analogue Scale for Irritable Bowel Syndrome (VAS-IBS) and RAND-36. Spearman´s rank correlation test. P<0.05 was considered statistically significant.
Table 6: Correlation between the participants scoring for items in VAS-IBS and RAND-36. patients with diabetes type 2 [37], who are known to have poor HRQoL
[38]. The improvement of gastrointestinal symptoms and HRQoL among the participants in the present study could not be explained by weight reduction, improved metabolic control or altered hormonal profile. Rather, the positive aspects of enrollment in a clinical trial and all the positive attention is accomplished with better psychological health [39]. Also central reward systems may be affected, not possible to estimate in peripheral blood samples [6]. The improved well-being at week 12 preceded the decreased gastrointestinal symptoms at week 28. This suggests that the diminished symptoms are due to a better psychological status rather than the food intervention per se. On the
other hand, most participants continued with a healthy breakfast, high intake of fruits and vegetables, and regular meals. These improved food habits may have led to less gastrointestinal symptoms over time.
One of the most remarkable changes for the participants in the present study was the introduction of breakfast and regular meals. There is a strong evidence for that intake of breakfast cereals and regular meals are associated with better well-being and metabolic control and less gastrointestinal symptoms [10,40]. By eating breakfast, important cereals are ingested, which are associated with overall healthier life style habits and lower mortality [41,42]. Thus, intake of breakfast and regular meals may per se, independent of dietary content, be of importance for
healthy habits and lower prevalence of gastrointestinal symptoms [10]. More and regular meals render diminished intervals between meals, which renders improved nutrition utilization [43].
A previous association study did not show any association between BMI and gastrointestinal symptoms in an overweight population [44]. In population-based studies, BMI was associated with abdominal pain, diarrhea, and vomiting in one study [45,46] but not in another [10]. In young students, a correlation between constipation-predominant IBS and BMI was found [47]. Only a few patients in the present cohort had any gastrointestinal complaints. Among those who had complaints, some had worsened trouble after introduction of the fiber-rich diet with increased constipation and bloating. Thus, the results are not comparable to epidemiological studies where obesity is associated with an unhealthy diet and low physical activity [45,46].
Zonulin has been introduced as a biomarker of increased intestinal permeability [13], and theoretically, is therefore an interesting molecule to measure in patients with gastrointestinal symptoms and diseases. However, in this and previous studies in health and type 2 diabetes, zonulin levels were not associated with gastrointestinal symptoms, but with metabolic factors such as weight, waist circumference, blood pressure, and glucose levels [14,48]. Thus, zonulin is rather a marker of metabolic diseases than of gastrointestinal diseases and symptoms [48]. One limitation of the present pilot study is that only fasting levels of hormonal and metabolic factors were measured, whereas the subjective estimation of satiety and sweet cravings reflected overall feeling during the day. The lack of assessment of satiety at inclusion may also be of importance. The limitation of the present study is the absence of control group. However, a previous breakfast study showed that a single breakfast composed of an Okinawan-based Nordic diet, rendered higher satiety compared with an ordinary composed meal [12]. Further, a similar study has not shown any changes in metabolic parameters over the observational time period in a control group [49].
In conclusion, an Okinawan-based Nordic diet with moderately low carbohydrate content and high fiber, fat, and protein contents renders an increased satiety and reduced sweet cravings, independently of anthropometric, hormonal, metabolic or psychological factors. Improved psychological well-being and HRQoL proceeds the reports of decreased gastrointestinal symptoms.
Acknowledgements
We want to acknowledge Igelosa Life Science AB, Lund, whose staff supplied and prepared the meals and the staff at the Internal Medicine Research Group, Skane University Hospital, Malmo, for performing the trials.
This study was supported by grants from Hans-Gabriel and Alice Trolle Wachtmeister´s Foundation for Medical Research, King Gustaf V:s and queen Victoria Free Maison´s Foundation, Dir Albert Pahlsson´s Foundation, Development Foundation of Region Skane, and Foundation of Skane University Hospital. ClinicalTrials.gov Identifier: NCT02405806.
References
1. Chu S, Schubert ML (2013) Gastric secretion. Curr Opinion 29: 636-641. 2. AL-Suhaimi EA, Shehzad A (2013) Leptin resistin and visfatin: the missing link
between endocrine metabolic disorders and immunity. Eur J Med Res 18: 12. 3. Feinle-Bisset C (2014) Modulation of hunger and satiety: hormones and diet.
Curr Opin Clin Nutr Metab Care 17: 458-464.
4. Hazell TJ, Islam H, Townsend LK, Schmale MS, Copeland JL (2016) Effects of exercise intensity on plasma concentrations of appetite-regulating hormones: Potential mechanisms. Appetite 98: 80-88.
5. Okami Y, Kato T, Nin G, Harada K, Aoi W, et al. (2011) Lifestyle and
psychological factors related to irritable bowel syndrome in nursing and medical school students. J Gastroenterol 46: 1403-1410.
6. Journel M, Chaumontet C, Darcel N, Fromentin G, Tomé D (2012) Brain responses to high-protein diets. Adv Nutr 3: 322-329.
7. Janssen P, Vanden Berghe P, Verschueren S, Lehmann A, Depoortere I, et al. (2011) Review article: the role of gastric motility in the control of food intake. Aliment Pharmacol Ther 33: 880-894.
8. Ryan AT, Luscombe-Marsh ND, Saies AA, Little TJ, Standfield S, et al. (2013) Effects of intraduodenal lipid and protein on gut motility and hormone release, glycemia, appetite and energy intake in lean men. Am J Clin Nutr 98: 300-311. 9. Molina-Infante J, Serra J, Fernandez-Banares F, Mearin F (2016) The low-FODMAP diet for irritable bowel syndrome: Lights and shadows. Gastroenterol Hepatol 39: 55-65.
10. Ohlsson B, Manjer J (2016) Physical inactivity during leisure time and irregular meals are associated with functional gastrointestinal complaints in middle-aged and elder subjects. Scand J Gastroenterol 51: 1299-1307.
11. Darwiche G, Hoglund P, Roth B, Larsson E, Sjoberg T, et al. (2016) An Okinawan-based Nordic diet improves anthropometry, metabolic control, and health-related quality of life in Scandinavian patients with type 2 diabetes: a pilot trial. Food Nutr Res 60: 32594.
12. Ohlsson B, Hoglund P, Roth B, Darwiche G (2009) Modification of a traditional breakfast leads to increased satiety along with attenuated plasma increments of glucose, C-peptide, insulin, and GIP in human. Nutr Res 36: 359-368. 13. Fasano A (2012) Intestinal permeability and its regulation by zonulin: diagnostic
and therapeutic implications. Ann N Y Acad Sci 1258: 25-33.
14. Ohlsson B, Roth B, Larsson E, Hoglund P (2017) Calprotectin in serum and zonulin in serum and feces are elevated after introduction of a diet with lower carbohydrate content and higher fiber, a fat and protein contents. Biomedical Reports 21: 19-23.
15. Willcox DC, Willcox BJ, Todoriki H, Suzuki M (2009) The Okinawan diet: health implications of a low-calorie, nutrient-dense, antioxidant-rich dietary pattern low in glycemic load. J Am Coll Nutr 21: 500S-516S.
16. Willcox DC, Scapagnini G, Willcox BJ (2014) Healthy aging diets other than the Mediterranean: a focus on the Okinawan diet. Mech Ageing Dev 62: 136-137.
17. Nordic Nutrition Recommendations (2012) Nordic nutritional recommendations to sonquer malnutrition. National Institution of nutrition 2: 15-19.
18. Parker BA, Sturm K, MacIntosh CG, Feinle C, Horowitz M, et al. (2004) Relation between food intake and visual analogue scale ratings of appetite and other sensations in healthy older and young subjects. Eur J Clin Nutr 58: 212-218. 19. Bengtsson M, Ohlsson B, Ulander K (2007) Development and psychometric
testing of the visual analogue scale for irritable bowel syndrome (VAS-IBS) BMC. Gastroenterology 7: 16.
20. Bengtsson M, Persson J, Sjolund K, Ohlsson B (2013) Further validation of the visual analogue scale for irritable bowel syndrome after use in clinical practice. Gastroenterol Nurs 36: 188-198.
21. WHO (1997) WHOQOL: measuring quality of life. Quality of life 12: 123. 22. Aalto A, Aro A, Teperi J (1999) RAND-36 as a measure of health-related quality
of life. Reliability, construct validity and reference values in the Finnish general population. National Research and Development Centre for Welfare and Health Helsinki 24: 12362.
23. Hays RD, Sherbourne CD, Mazel RM (1993) The RAND 36-item health survey 1.0. Health Econ 2: 217-227.
24. Lean ME, Malkova D (2016) Altered gut and adipose tissue hormones in overweight and obese individuals: cause or consequence? Int J Obes 40: 622-632.
25. Mattes RD (2000) Nutritional implications of the cephalic-phase salivary response. Appetite 34: 177-183.
26. Sakata T, Yoshimatsu H, Masaki T, Tsuda K (2003) Anti-obesity actions of mastication driven by histamine neurons in rats. Exp Biol Med 228: 1106-1110. 27. Zhu Y, Hsu WH, Hollis JH (2013) Increasing the number of masticatory cycles is associated with reduced appetite and altered postprandial plasma
concentrations of gut hormones, insulin and glucose. Br J Nutr 110: 384-390. 28. Kokkinos A, le Roux CW, Alexiadou K, Tentolouris N, Vincent RP, et al. (2010)
Eating slowly increases the postprandial response of the anorexigenic gut hormones, peptide YY and glucagon-like peptide-1. J Clin Endocrinol Metab 95: 333-337.
29. Otsuka R, Tamakoshi K, Yatsuya H, Wada K, Matsushita K, et al. (2008) Eating fast leads to insulin resistance: findings in middle-aged Japanese men and women. Prev Med 46:154-159.
30. Maruyama K, Sato S, Ohira T, Maeda K, Noda H, et al. (2008) The joint impact on being overweight of self-reported behaviours of eating quickly and eating until full: cross sectional survey. BMJ 337: a2002.
31. Collins PJ, Horowitz M, Cook DJ, Harding PE, Shearman DJ (1983) Gastric emptying in normal subjects: a reproducible technique using a single scintillation camera and computer system. Gut 24: 1117-1125.
32. Leclere CJ, Champ M, Boillot J, Guille G, Lecannu G, et al. (1994) Role of viscous guar gums in lowering the glycemic response after a solid meal. Am J Clin Nutr 59: 914-921.
33. Benini L, Castellani G, Brighenti F, Heaton KW, Brentegani MT, et al. (1995) Gastric emptying of a solid meal is accelerated by the removal of dietary fibre naturally present in food. Gut 36: 825-830.
34. Cecil JE, Francis J, Read NW (1999) Comparison of the effects of a high-fat and high-carbohydrate soup delivered orally and intragastrically on gastric emptying, appetite, and eating behaviour. Physiol Behav 67:299-306. 35. Sclafani A (2016) Oral, post-oral and genetic interactions in sweet appetite.
Physiol Behav 89: 525-530.
36. Ochoa M, Lallès JP, Malbert CH, Val-Laillet D (2015) Dietary sugars: their detection by the gut-brain axis and their peripheral and central effects in health and diseases. Eur J Nutr 54: 1-24.
37. Luscombe FA (2000) Health-related quality of life measurement in type 2 diabetes. Value Health 3 Suppl 1: 15-28.
38. Solli O, Stavem K, Kristiansen IS (2010) Health-related quality of life in diabetes: The associations of complications with EQ-5D scores. Health and Quality of Life Outcomes 8: 18.
39. Bengtsson M, Ohlsson B (2005) Psychological well-being and symptoms in women with chronic constipation treated with sodium picosulphate. Gastroenterol Nurs 28: 3-12.
40. Williams PG (2014) The benefits of breakfast cereal consumption: a systematic review of the evidence base. Adv Nutr 5: 636S-673S.
41. Egeberg R, Frederiksen K, Olsen A (2009) Intake of wholegrain products is associated with dietary, lifestyle, anthropometric and socio-economic factors in Denmark. Public Health Nutr 12: 1519-1530.
42. Johnsen NF, Frederiksen K, Christensen J (2015) Whole-grain products and whole-grain types are associated with lower all-cause and cause-specific mortality in the Scandinavian HELGA cohort. Br J Nutr 23: 1-16.
43. Smeets AJ, Westerterp-Plantenga MS (2008) Acute effects on metabolism and appetite profile of one meal difference in the lower range of meal frequency. Br J Nutr 99: 1316-1321.
44. Levy RL, Linde JA, Feld KA, Crowell MD, Jeffery RW (2005) The association of gastrointestinal symptoms with weight, diet, and exercise in weight-loss program participants. Clin Gastroenterol Hepatol 3: 992-996.
45. Delgado-Aros S, Camilleri M, Talley NJ, Fett S, Zinsmeister AR, et al. (2004) Obesity is associated with increased risk of gastrointestinal symptoms: a population-based study. Am J Gastroenterol 99: 1801-1806.
46. Talley NJ, Howell S, Poulton R (2004) Obesity and chronic gastrointestinal tract symptoms in young adults: a birth cohort study. Am J Gastroenterol 99: 1807-1814.
47. Kim YJ, Ban DJ (2005) Prevalence of irritable bowel syndrome, influence of lifestyle factors and bowel habits in Korean college students. Int J Nurs Stud 42: 247-254.
48.
Citation: Ohlsson B, Darwiche G, Roth B, Bengtsson M, Hoglund P (2017) High Fiber Fat and Protein Contents Lead to Increased Satiety Reduced Sweet Cravings and Decreased Gastrointestinal Symptoms Independently of Anthropometric Hormonal and Metabolic Factors. J Diabetes Metab 8: 733. doi: 10.4172/2155-6156.1000733
OMICS International: Open Access Publication Benefits & Features
Unique features:
• Increased global visibility of articles through worldwide distribution and indexing • Showcasing recent research output in a timely and updated manner • Special issues on the current trends of scientific research Special features:
• 700+ Open Access Journals • 50,000+ Editorial team • Rapid review process
• Quality and quick editorial, review and publication processing • Indexing at major indexing services
• Sharing Option: Social Networking Enabled
• Authors, Reviewers and Editors rewarded with online Scientific Credits • Better discount for your subsequent articles
Submit your manuscript at: http://www.omicsonline.org/submission
Ohlsson B, Orho-Melander M, Nilsson PM (2017) Higher levels of serum zonulin may rather be associated with increased risk of obesity and hyperlipidemia, than with gastrointestinal symptoms or disease manifestations. Int J Mol Sci 18: E582. 49. Adamsson V, Reumark A, Fredriksson B, Hammarstrom E,Vessby B, et al.(2011) Effects of a healthy Nordic diet cardiovascular risk factors in hypercholesterolaemic subjects: a randomized controlled trial (NORDIET). J Intern Med 269: 150-159.