1
An Industrial Case Study
PAPER WITHIN Production System
AUTHOR: Rakesh Raghavendra Devarakonda and Sumanth Ramachandrareddy JÖNKÖPING
PRODUCTION SYSTEM
WASTE REDUCTION
THROUGH VALUE STREAM
MAPPING.
2 management. The work is a part of the Master of Science program.
The authors take full responsibility for opinions, conclusions and findings presented.
Examiner: Kerstin Johansen.
Supervisor: Mahmood Reza Khabbazi
Scope: 30 credits (second cycle)
3
Abstract
The rapid rise in global population and market demands have mandated industries to introduce better and quality products to meet up their rushing needs. However, achiev-ing such goals need optimal production system and robust strategies. Explorachiev-ing in depth it can be visualized that most of the manufacturing set ups suffers losses or relatively lower benefits due to improper and high wastages. Hence it is very important for man-ufacturing industries to explore the techniques which help them to improve their pro-duction system. The key techniques from Lean Manufacturing (LM) such as Value Stream Mapping (VSM) and Ishikawa diagram were explored in this work for enhanc-ing production capacity, reducenhanc-ing rework, reducenhanc-ing wastages and arrivenhanc-ing to a well-defined optimal process flow which in turn help in achieving higher productivity. How-ever, the implementation of Lean and Value stream mapping depends on the production scale and has its own significance to different manufacturing setup. With that motive, in this thesis work the emphasis was made on exploring VSM technique for better pro-duction optimization in manufacturing sector.
Key Words: Manufacturing process, Lean Manufacturing, techniques of lean manu-facturing, Value stream mapping, VSM key challenges, wastage in manufacturing process, Material handling.
4
Contents
1
Introduction ... 6
1.1BACKGROUND ... 6
1.2PROBLEM DESCRIPTION ... 7
1.3PURPOSE AND RESEARCH QUESTIONS ... 7
1.4DELIMITATIONS... 8 1.5OUTLINE ... 8
2
Theoretical background ... 10
2.1MATERIAL HANDLING ... 10 2.2PERFORMANCE MEASUREMENT ... 12 2.3LEAN MANUFACTURING ... 132.4THE CONCEPTS OF WASTE IN LEAN MANUFACTURING ... 15
2.5VALUE STREAM MAPPING (VSM) ... 18
2.5.1 Advantages of Value Stream Mapping ... 19
2.5.2 Disadvantages of Value Stream Mapping ... 20
2.6ISHIKAWA DIAGRAM ... 20
2.7SUMMARY ... 21
3.METHOD AND IMPLEMENTATION ... 22
3.1RESEARCH DESIGN ... 22
3.1.1 Qualitative Research ... 22
3.1.2 Quantitative Research ... 23
3.2DATA COLLECTION ... 23
3.2.1 Primary Data Collection ... 23
3.2.2 Secondary Data Collection ... 24
3.3CASE STUDY ... 26
3.4DATA ANALYSIS ... 26
5
3.6SUMMARY ... 27
4.FINDINGS AND ANALYSIS ... 28
4.1COMPANY’S DESCRIPTION AND OPERATIONS ... 28
4.2AS-IS STATE ANALYSIS ... 28
4.3STUDY OF PROCESS FLOW ... 29
4.4WASTE IDENTIFICATION ... 34
4.5SUGGESTED IMPROVEMENTS ... 37
4.6IMPROVED STATE ANALYSIS ... 38
4.7SUMMARY ... 40
5. Discussion and conclusions ... 41
5.1DISCUSSION OF METHOD ... 41
5.2DISCUSSION OF FINDINGS ... 41
5.3CONCLUSIONS ... 44
6.
References ... 46
7.
Appendices ... 51
6
1
Introduction
For any research or study a well-defined structured approach and research matter dis-cussions play key role (Saunders, M, Lewis, P., Thornhill, A.., 2009). Introductory of a research helps audiences to understand research matter better and on a comprehensive way (Jenkins., 1995). Hence the structured discussion of research variables and its re-lated constructs often plays vital role in any thesis work. With this motive, in this chap-ter introduced research objective, problem description, purpose and research questions, delimitations and thesis outline.
1.1 Background
The rapid rise in global population and market demands have mandated industries to introduce better and quality products to meet up their rushing needs. Most of the man-ufacturing set ups suffers losses or relatively lower benefits due to improper and high wastages. (Harrison, A., Hoek, R. v. & Skipworth, H, 2014)
In the last few years manufacturing sector has undergone dynamic changes in the below area (Boamah, 2014)
• Wastages
• Improper material handling
• Inefficient supply chain management
Under such circumstances improving production mechanism is of the paramount sig-nificance. Numerous approaches such as Lean manufacturing (LM), Value stream map-ping (VSM) have been explored across industries to enhance production capacity and associated goals (Dues et al., 2013). In this relation, lean manufacturing concept can be of great significance. It can help reducing wastage generation, retaining high quality of products, competitive cost etc that as a result could help firms to achieve better gain (Rahman, A and Karim, A., 2013), such paradigm can be of great significance; how-ever, their implementation in different manufacturing units having diverse products-lines/types and production scales varies significantly. On the other hand, lean ap-proaches such as VSM has its own significances and efficiency to the different manu-facturing set up (Rother, M., & Shook, J., 2003). However, VSM has emerged as one of the best lean approaches towards productivity optimization (Rother, M., & Shook, J., 2003). With this motive, in this thesis the emphasis is made on exploring efficiency of VSM for production or manufacturing sector including optimal material handling, resource utilization, waste management and to enable a proper material handling ap-proach in unison with performance measurement. Implementing both these apap-proaches will help industries, especially manufacturing industries to ensure higher productivity, less wastage, better market acquisition.
A brief description of these processes of the manufacturing industry has been provided in the next chapter (Chapter-2).
7
1.2 Problem description
In produce to order production system, the production depends on the demands. In most of the manufacturing industries if the demand is high the products are produced in fully automated hard tooling section and if the demand is low the products are produced on the soft tooling/semi-automated/manual labour section. Also, during the production, the flow of materials begins from raw materials area to the finished goods area. However, the prime issue hindering was the efficiency of process flow, the amount of waste pro-duction in terms of materials, workforce and utilization of machines. Hence, consider-ing this as a significant problem here it has been aimed to optimize the production by reducing the waste incurred. In other word, the aim of the research conducted is to im-prove the production flow and material handling process by exploiting the VSM ap-proach and encourage the industries to outperform their competitors and demonstrate significant modifications in their classical approaches in order to raise the bar of effi-cient production. The production logistics in SMEs face severe issues once the produc-tion system is producing high volumes of products. To achieve the objective of re-search, the following problems have been identified to be accomplished optimally.
• Design and implement an optimal production flow process using the concept of lean manufacturing.
• Facilitate reduction in waste generation using the technique of VSM to enhance the productivity levels.
1.3 Purpose and research questions
The baseline of key challenges associated with any manufacturing industry is lack of optimal production flow which occurs due to numerous reasons such as excess produc-tion of waste materials, lack of proper management of resources and materials etc. These challenges cause the industries to incur loss and eventually shutdown. (George, B.; Dann, P.; Trimmer, B., 2003). Considering these challenges as a motivation and aiming at enabling a proper management system at the organisations by optimizing dif-ferent related constructs, in this research focus has been made on optimizing the pro-duction flow and streamlining the material handling process by implementing certain techniques in unison with value stream mapping, an approach for managing the pro-duction process in industries.
The purpose of conducting this study can be defined under certain specific objectives, which are given as follows:
• To explore efficiency of VSM in lean manufacturing processes for better pro-duction and waste management.
• To study VSM assisted lean manufacturing process for optimized production. • To implement VSM concept to identify root causes influencing manufacturing
productivity and losses and conceptualize and develop a production estimation for higher productivity and low loss.
Considering the purpose of conducting this study, some of the key research questions for which the current study intends to get suitable answers are given as follows:
8 RQ1. How can production logistics be improved for small or medium size en-terprise to support high volume production?
The above RQ1 can be achieved by analysing material flow in all stations, identify and eliminate the activities which were not needed and by provid-ing suggested changes in the existprovid-ing process.
RQ2. How can the suggested improvements help in better resource utilization and to increase production?
The above RQ2 can be achieved by analysing the As -Is state production processes, using techniques from lean manufacturing and effective mate-rial handling the process.
1.4 Delimitations
It is imperative to mention that this case study is being conducted for Veer-O-Metals, an India based company located in Bangalore and specially dealing in metal fabrication. The analysis of production planning and material flow at veer-o-metals is limited to PVS-980 frame and its production station. Hence, considering this as a motivation here it has been aimed to perform in-depth quantitative and qualitative assessment and suggested the required improve-ments only for PVS-980 frame.
1.5 Outline
A brief outline of the presented thesis work is as follows Chapter 1: Introduction
This chapter provides the details of the special significance on the need to con-duct the study. Further the research problem, its purposes, aim research ques-tions etc have been discussed. Additionally, delimitaques-tions and outline of the the-sis has been presented.
Chapter 2: Literature Survey
This chapter introduces the methodology opted for this study. This section con-sists of a literature review, case study and triangulation, where it specifies the details of the procedures necessary for collecting the required data to structure and solve the problem.
Chapter 3: Method and implementation
This chapter introduces the methodology opted for this study. This section con-sists of a literature review, case study and triangulation, where it specifies the details of the procedures necessary for collecting the required data to structure and solve the problem.
Chapter 4: Finding and data analysis
This chapter presents a brief description of the findings and data analysis of this study by exploiting the data gathered. It incorporates literature review, case
9 study and triangulation where it specifies the details of the procedures necessary for collecting the required data to structure and solve the problem.
Chapter 5: Discussion and Conclusion
In this chapter the research methods used, and the finding of this study have been discussed in context of existing literature. Additionally, a summary of the results obtained has also been provided.
10
2
Theoretical background
The primary focus of this chapter has been focused on discussing the processes and techniques associated with the manufacturing industries. Considering the overall re-search goal where it is intended to explore efficiency of VSM technique for lean man-ufacturing, understanding key constructs can be vital to make better contribution. In this section, the key variables such as different manufacturing processes, lean manufac-turing, VSM in lean manufacmanufac-turing, pertaining to the above stated terminologies were discussed.
2.1 Material Handling
Green, J. C., Lee, J. and Kozman, T. A., (2010) defined material handling as movement of materials and it includes many parameters such as utility, storage etc. Myers, F.E. and Stephens, M.P., (2000) stated that for the successful completion of the manufactur-ing process it is necessary to have material handlmanufactur-ing even though it does not add any value during production. Material handling helps by making production flow possible, as it activates elements that are in static such as raw materials, equipment, human re-sources. Products and layout(Stock, J. R., Lambert, D. M, 2001; Chopra, S. and Meindl, P, 2001).
According to Childe, (2003), resources at manufacturing facilities must be dealt with efficiently in order to support operations and achieve high success rates. Undeniably, one of the important parameters for effective resource utility is planning and design. If the material handling system is well designed, it will help the manufactures to increase their productivity, product quality and minimize the manufacturing cost. Without a well-designed material handling system manufacturing process might experience stern delays on delivering the end product, production time may increase, damages on the product can be encountered and internal material movement cost may be increased which in-turn increases manufacturing cost (Hassan, 2010).
As per Asef-Vaziri, A., and Laporte, G (2005) a significant part of manufacturing cost is associated with material handling. The most crucial material handling decisions are planning and designing of patterns that are related to material handling and flow. Lo-annou, (2002) supported by saying that a significantly important parameter of a pro-duction system is a material handling system and its design of material flow. Flinch-baugh (2005) reported that when lean manufacturing is enforced to material handling, it must enclose all the tools that are related to lean manufacturing and must exhibit a complete view of lean manufacturing and not a part of lean manufacturing. Addition-ally, the top management must also consider all the key concepts and techniques irre-spective of lean implementation before launching the system for material handling (Cutcher-Gershenfeld., 2002).
11 The key steps to implement lean manufacturing and ensure a better material handling system are given below (Harris, C., and Harris, R., 2006):
• Develop a plan for every station • Delivery roots must be designed • Pull signals implementation and • Continuous improvement
Regardless of its importance, it has been asserted that material handling is treated su-perficially by many companies and therefore it is inevitable to enhance internal material handling process. To achieve it is vital to consider both human and technical factors which in turn increase production performance (Chakravorty, 2009). The process of material handling is predominantly employed in order to improve customer service, lessen deliver time and reduce overall handling costs allied with manufacturing, distri-bution and transportation. Considering these aspects, it can be affirmed that while plan-ning the design of a material handling system it is of paramount significance to assure that all the equipment and processes including manual, automated and semi-automated work together as an integrated system. Predominantly, there should be considered 10 principles of material handling while designing a system so as to ensure it robustness, simplicity and efficiency towards the respective industry it is designed for. These prin-cipals include (Nzuve, 2018)
• Planning: This factor emphasizes on defining the needs and establishes the fact that the performance objectives should be strategic. It also sig-nifies that while planning the system suggestions or discussions with different stakeholders such as consultants, suppliers, end users etc should be incorporated.
• Standardization: This principle refers that all the material handling equipment, approaches etc should be in accordance with the standards and must be able to perform different tasks under different operating conditions.
• Work: This principle emphasizes on reducing the complexities of the process by mitigating unnecessary movements in order to enhance the productivity.
• Ergonomics: It explains that the working conditions and work should be in accordance with the potential of workers, should be helpful for them in avoiding the iterative and tedious labour and should be focused on their safety.
• Unit load: This principal emphasizes the use of a unit load such as pal-lets, container etc since they require comparatively less effort.
• Space utilization: This principle of the material handling focuses on efficient utilization of space. It explains that there should be a proper utilization of the space in order to avoid any issues related to scarcity of space.
• System: It emphasizes on following a systematic approach for the movement and storage of material and also it should be applied to all the processes.
12 • Environment: As can be understood from the term environment, this aspect focuses on using environment friendly materials and incorporat-ing safe or non-hazardous practices.
• Automation: This principle of the material handling signifies that in or-der to achieve higher efficiency, productivity etc the technologies de-ployed should be automated.
• Life cycle cost: This principle explains that for all equipment specified for the system, an analysis of life cycle costs should be conducted.
2.2 Performance Measurement
Performance measurement is an integrated term where performance refers to the out-comes derived from products, processes that enables evaluating and comparing on the basis of the standards, aims, results obtained previously etc. On the other hand, meas-urement refers to the numeric data that quantifies input, output and other parameters associated with products and the overall organization.
The performance measurement approach is followed by almost all the companies so as to gauge the overall performance of their organization. To maintain market demand, it is important for the company to consider performance related to production. Andersen, (1999) defined performance measurement as a process that continuously measures the production activity by identifying defects and implementing improvements regularly. Performance measurements has been a very important aspect at manufacturing firms since the 1960s and in recent years many aspects such as self-assessment, benchmark-ing, ISO 9000, balanced scorecard, workflow control, etc have become popular in the field to evaluate production performance (Denkena, B.; Apitz, R.; Liedtke, C.,2006).
Performance measurement is known as one of the challenging areas in manufacturing company because it is essential for the modern-day companies to maintain their cus-tomer satisfaction (Denkena, B.; Apitz, R.; and Liedtke, C.,2006). On the other hand, Zairi, (2000) argues that performance measurement can not only be used for customer satisfaction but also for long-term improvements. Performance measure has become an important parameter to specify the efficiency or effectiveness of the process (Neely, A., Gregory, M., and Platts, K., 1995). It has become a significant part of production and management. It is noteworthy that manufacturing companies feel immense pressure to improve their production performance in order to stay competitive in the market (Hvolby, H.H and Thorstenson, A.,(2000)).
Among these approaches benchmarking is most popularly exploited by the manufac-turing firms to measure their production performance (Denkena, B.; Apitz, R.; and Liedtke, C.,2006). Benchmarking can be defined as the search for best practices that will be helpful to increase companies’ performance. Many companies regard bench-marking as a significant parameter to assess their production performance to maintain
13 their competitiveness in the market. The core concepts of benchmarking are enumerated as follows:
• Comparison of one’s own benchmarking performance level, process, practice, etc with business partner’s performance level.
• Learning from partners and implementing improvements in your own organization.
• With the help of benchmarking the main objective of the companies, i.e. improvement is attained (Talluri ., 2002).
Hence, performance measurement must be considered while evaluating the production process as it helps us to measure the performance of the production facility at a manu-facturing firm. Lean manumanu-facturing also helps the industries to maintain their produc-tion performance.
2.3 Lean Manufacturing
Lean manufacturing has been an interest for many organisations to optimize their pro-duction (Dues et al., 2013). The major aspects of lean are waste repro-duction and increase in productivity (Anand et al, 2008). Lean manufacturing and its concept were derived from Toyota Production System (TPS) with the primary aim of eliminating waste, the non-value adding products from the customers’ point of view (Rahman, A and Karim, A., 2013).
Womack, J. P., Jones, D. T., and Ross, D. (2003) stated that lean manufacturing demon-strates the relationship between value adding products and waste (Non-value adding products). They also added that the main agenda of lean manufacturing is to increase value adding when compared to non-value adding activities and reduce waste. The au-thors defined lean as a process of manufacturing products in quantities that are needed by customers. Hence the production must be done from the customer’s point of view (Lian, Y. -H., and Van Landeghem, H. (2003)).
Lean manufacturing is one of the important parameters that must be considered in a company because it mainly focuses on continuous improvements in their production process. Hence, long-term strategies and short-term strategies, as well as goals, can be planned and implemented using lean manufacturing techniques. Nevertheless, many organizations incorporate preliminary strategies from lean manufacturing and provide a complete roadmap for the production (Green, J. C., Lee, J. and Kozman, T. A., 2010). Noticeably, often top management does not provide adequate time and resources to sustain lean manufacturing (Biddle., 2006). Denkena, B.; Apitz, R.; and Liedtke, C., (2014) stated that in manufacturing industries the primary aim is to achieve higher productivity and cost reduction in order to stay competitive in the market. Appropriate management of material flow impacts the manufacturing costs (Christopher., 2011) and contrary to this improper management may lead to cost increment and a decrease in productivity eventually resulting in waste production (Hassan, 2010).
Ohno, (1988) defined waste as a product produced due to needless or unnecessary movement or improper management of raw materials and hence needs to be eliminated.
14 Waste can also occur due to reasons such as inventory storage, overproduction, trans-porting, waiting, over processing, unnecessary movements and production of defective parts or products. Aiming at waste reduction, industries should lower their inventories and optimize the process of material handling. Keyser, R. S., and Sawhney, R. S., (2013) stated that the primary focus of lean manufacturing is to use the scarce resource effectively and to minimize all types of waste and other non-value adding operations in a manufacturing firm.
As already discussed in previous sections, in manufacturing material handling and waste management are the key factors that requires critical attention to achieve better productivity and product’s success. Typically, waste is defined as an unavoidable bi-product occurred during the manufacturing process and therefor establishing a better control over the production process or in other words bringing reduction in waste can help achieving higher quality, success and financial savings (USEPA, 2011). Reducing waste during the production process helps companies to gain benefits in terms of re-duced operation and waste removal cost and it is regarded as a challenging task for manufacturing industries (USEPA, 2011).
To enable optimal waste management, different approaches have been implemented so far, amongst which lean manufacturing Pullin., (2000) stated that lean manufacturing helps to get through the root cause of waste production on the basis of following prin-ciples:
• No waste is witnessed when the process becomes perfect
This means that when every step in a process is fully efficient and the amount of waste produced is less.
• Customer focused sales
It signifies that ultimately the customers are the ones who decide the value that they are willing to pay. Hence, the analysis begins from the customers’ point of view.
• Creating value for the process
Before the product reaches its final stage, it undergoes various stages such as design production, marketing, processing and delivery. To achieve higher productivity and gain, it is must to ensure value with all aforesaid stages.
• Waste creation decreases the value
Waste signifies certain unwanted and insignificant factor that reduces eventual product quality. Furthermore, it affects overall cost of the product thus making it difficult to compete in current market condition. The created value gets decreased by the amount of waste generated during the production process, and therefore it becomes inevitable to reduce wastes in manufacturing process. This as a result could help firm achieving higher productivity, low cost of production, better quality and perception across market. A snippet of the waste reduction measure or process is given in Figure 2.1.
15
Check and Measure
Results Search for Causes
Identify Waste
Implement Continuous improvement
Figure 2.1. Waste elimination process (Rahman, A and Karim, A., 2013) Observing Figure 2.1, waste elimination is a continuous and cyclic process which commences with the identification of the waste followed by analysing the root cause, implementing improvements in the product and finally ending at checking the work progress in unison with providing feedback for further improvements (Rahman, A and Karim, A., 2013).
2.4 The concepts of waste in Lean manufacturing
When the elements of waste exist, all they do is increase costs and add zero value to the manufacturing process (George, B.; Dann, P.; Trimmer, B., 2003). The fun-damental waste is to be Identified as overproduction (Liker et al., 2004 and Ohno, T., 1988). Producing more than the customer desires by any operation in the man-ufacturing process necessarily leads to a build-up of inventory somewhere down stream: the material is just sitting around waiting to be processed in the next op-eration.
The concept of lean provides tools and methods that are used to evaluate produc-tion and eliminate waste generaproduc-tion continuously. There are three major types of wastes identified, namely muri, mura and Muda (Rahman, A and Karim, A., 2013). They are described as follows:
• Muri means overburden. It is focused on the work that must be avoided through design. This means that because of poor organization unreasonable work that is given to machines and employees must be viewed seriously dur-ing the design phase (Rahman, A and Karim, A., 2013)
• Mura refers to unevenness. It primarily focuses on the implementation of work design and ensures smooth flow at scheduling work process with re-spect to maintaining quantity and quality (Rahman, A and Karim, A., 2013.
16 • Muda refers to non- value adding work. This type of waste is concerned with
all the unwanted activities that are exposed when working in progress on the shop floor and deals with them instantly (Rahman, A and Karim, A., 2013). Muda is further classified into nine types of waste (Voehl, F., Harrington, J., Mignosa, C., and Charron, R., 2014 and Harrison, Harrison, A., Hoek, R. v. and Skipworth, H, 2014). Though primarily it was classified with eight wastes, but the ninth waste was considered based on the belief system on the behavioural aspects of an employee. A brief description of each of these wastes is given as follows:
i. Overproduction:
The products that are produced without any need result overproduction, eventu-ally causing high inventories storage. The common cause of overproduction is just-in-case mind-set, improper scheduling, irregular workloads, and exploitation of automation (Voehl, F., Harrington, J., Mignosa, C., and Charron, R., 2014 and Harrison, Harrison, A., Hoek, R. v. and Skipworth, H 2014).
Figure 2.2 Overproduction (Voehl et al., 2014) ii. Excessive inventory:
Excess inventory refers to storing up inventory with materials that are more than required. It usually results due to the process that do not function properly i.e. improper market forecast, defective manufacture of complex products, improper scheduling, unequal workloads, worst quality or improper shipping of raw mate-rials from the suppliers (Voehl et al., 2014., Harrison, Harrison, A., Hoek, R. v. and Skipworth, H, 2014).
iii. Defects:
The occurrence of defective products is a common issue during production or after de-livering the products to the customer. Defective products are something that are not
17 built properly and are hence rejected by the customer. The reason for the cause of de-fects is lack in understanding customers’ point of view, inexperience in purchasing quality raw materials or lack of experience in transportation of raw materials from the suppliers, employees working with insufficient knowledge, improper design and maintenance of products etc. (Voehl, F., Harrington, J., Mignosa, C., and Charron, R., 2014 and Harrison, A., Hoek, R. v., and Skipworth, H, 2014).
iv. Over processing:
Processing a defective product several times or repetition of a process that does not add any value to end product is termed as over processing. The main cause of over pro-cessing is updating products but not the process, miscommunication, not fully under-standing customers’ point of view, employees getting more than required information from top management, making product copies that are more than required, Just-in-case mindset etc. (Voehl, F., Harrington, J., Mignosa, C., and Charron, R., 2014) and Harri-son, A., Hoek, R. v. and Skipworth, H, 2014).
v. Waiting:
The time period between the completion of one process and beginning of another is called waiting period. The processes that are considered to be waiting are the machine process, anticipating for the materials process to be finished. Waiting period can be due to numerous reasons such as slow shipping of raw materials, improper workload sched-ule, low maintenance, defective equipment, unplanned facility layout, unnecessary use of automation etc (Voehl, F., Harrington, J., Mignosa, C., and Charron, R., 2014 and Harrison, A., Hoek, R. v., and Skipworth, H., 2014).
vi. Motion:
Motion can be defined as unnecessary movements that do not add any value to the process. There are many reasons for motion such as employees not following the systematic way of production, inconsistent working methods, improper man-agement of information system, not providing the right information at the right station, unfavorable facility layout used for production etc. (Voehl, F., Harring-ton, J., Mignosa, C., and Charron, R., 2014 and Harrison, A., Hoek, R. v., and Skipworth, H, 2014).
vii. Transportation:
Transportation must be less in order to achieve a very less non-value process. Predominantly, a higher rate of transportation is observed due to inefficient buy-ing techniques, big sized batch production, large storage area, limited understand-ing of process flow etc. (Voehl, F., Harrunderstand-ington, J., Mignosa, C., and Charron, R., 2014., Harrison Harrison, A., Hoek, R. v. and Skipworth, H, 2014).
18 There are many firms that still follow the concept of personal management. This may be due to lack of firm in utilizing creative and innovative skills of an em-ployee. The main reason of occurrence of personal management is old style of thinking, business politics and works culture, lack of provision of training for low-level employees etc. (Voehl, F., Harrington, J., Mignosa, C., and Charron, R., 2014 and Harrison, A., Hoek, R. v. and Skipworth, H., 2014).
ix. Employee Behavior:
This waste occurs as a result of unwanted human interactions. It is present in almost every organization and is the root cause of all other eight wastes. This waste is divided into two types, employee and people waste. Employee waste refers to the waste that can be controlled by the employee by identifying how the work must be done, will the work add any value to the process etc while people waste occurs between two employees (Voehl, F., Harrington, J., Mignosa, C., and Charron, R., 2014 and Harrison, A., Hoek, R. v. and Skipworth, H, 2014).
Summarily, it can be stated that waste management at a production firm is a chal-lenging task. Hence, tools such as VSM help the industries to identify waste gen-eration. VSM is a well -known method that can be used to identify waste. Value stream is a tool that is used to map the process from the customer’s view. It results in a Improved state map that demonstrates the changes that are necessary to be considered while designing a new layout or a production process (Rother, M., and Shook, J., 2005). The main objective of VSM is to eliminate waste, meet customer demands and maintain customer satisfaction (Womack, J. P., Jones, D. T., and Ross, D.2003).
2.5 Value Stream Mapping (VSM)
VSM is a technique from lean manufacturing that is used to assess the information and material flow to bring the products to a customer (Rother et al., 2003). It is one of the most persuasive lean manufacturing tools which help the manufactur-ing firms to visualize and figure out the materials and process flow through the value stream (Lacerd A. P, Xambre A.R,and Alvelos H.M, 2016).
VSM gives a universal view of the production facility and helps in the identification and minimization of waste, eventually bringing reduction in costs related to production, increase in response time and production of better-quality products (Rother, M., and Shook, J., 2003). VSM helps to map the flow of infor-mation and materials in a manufacturing firm and hence can be regarded as the collection of all the flows (Rother, M., and Shook, J. 1999). VSM helps to generate a common ground with regards to manufacturing facility hence, helping the ad-ministrators to take favourable decisions on waste elimination (McDonald, T., Van Aken, E. M., and Rentes, A. F., 2002).
19 Teichgräber, U. K., and Bucourt, M. d. (2012) reported that nowadays it is im-portant for the organizations to map their production process using VSM because it helps them to reduce their expenses on raw materials and stay competitive in the market. Abdulmaleka, F. A., and Rajgopal, J. (2006) suggested that VSM must include the material flow, information flow and revenue that are related to production because it gives a holistic view of the production facility and helps the organization to take an appropriate decision with respect to waste management. Similarly, Chiarini., (2013) defined the intention of VSM as recognizing the pro-cess and other activities in order to demonstrate the difference between value add-ing and non-value addadd-ing activity in a manufacturadd-ing firm. VSM development is done two steps (Abdulmaleka, F. A., and Rajgopal, J., 2007 and Rahman, A and Karim, A., 2013). They are as follows:
• AS-IS state development:
The present working condition of the production process at a manufacturing firm is understood at this stage. This can be done by going through the current process and facilitating analysis and waste identification.
• Improved state development:
After removing flaws in the production process, an image of the improved pro-duction system can be visualized at this stage. The Improved map can be created by posing a set of questions related to effectiveness and technical aspects of the manufacturing system. With the help of a Improved map, existing production sys-tem can be modified or rebuilt.
2.5.1 Advantages of Value Stream Mapping
VSM is a powerful tool that helps the organization to assess their productivity. Rother, M., and Shook, J. (2009) stated that when a product is produced, the com-pany has value stream. VSM can be done with the exact same way as the facility and may alter the stream according to the analysis and results. Predominantly, the advantages of VSM can be stated as follows:
• VSM helps the management to find the defects because lean manufac-turing showcases the eight wastes and paves proper vision for improve-ments (Singh, B et al.,2010).
• Differentiating value adding and non-value adding in an organization is considered to be merit because it helps the organization to improve their value stream performance (Rother, M., and Shook, J., 2009). AR, R., and al-Ashraf, M. (2012) stated that implementation of value stream is advantageous in terms of decreasing lead time and inventory storage while featuring a remarkable increase in productivity.
20 2.5.2 Disadvantages of Value Stream Mapping
Even though, VSM is a powerful tool to assess the production process it is having its own limitations. They are described as follows:
• VSM is an important tool to implement lean manufacturing at a produc-tion firm but its only key concept is a pull system. The evaluaproduc-tion and analysis of one system at a manufacturing firm cannot be directly taken to another system at a different manufacturing firm but the evaluation and results can only be adopted with some modification (Bertolini, M., Braglia, M., Romagnoli, G., and Zammori, F., 2013).
• VSM gives only a holistic view of the production facility which helps the management to identify the flaws and defects at each station, but it fails to give an in-depth analysis at each station.
2.6 Ishikawa Diagram
Ishikawa diagram is popularly known as a Fish bone diagram. It is defined as the diagram that is traced backwards from the problem area. This diagram is helpful to identify the main cause of the problem and maintaining the quality of each department. A Fish-bone diagram is drawn according to following steps (Laws., 2016 and Rahman, A and Karim, A., 2013):
• Problem identification
• Identification of sub-classes in a problem when reviewed under process flow
• Identification of details on the problem noted
• Record the cause of the problem in the form of a diagram.
21 Project Not Completed on Time Machinery Human Resource
Material Method Money
Section Manager failed to update CPA Technicians cut Corners Excessive Downtime Equipment Failure Not to specification Unexpected Interactions Section Manager failed to update CPA
Delays in releasing cash
Effect
Figure 2.3: An example of Ishikawa diagram (Law., 2016)
2.7 Summary
This section primarily discussed some of the key theoretical aspects of the man-ufacturing processes, key challenges, different wastages in manman-ufacturing pro-cess, lean manufacturing, VSM and its significances to reduce wastages etc. Ob-serving overall discussion, it can be found that amongst the different lean manu-facturing processes, VSM does have decisive role to enhance overall manufactur-ing process and can be effective to enhance production or manufacturmanufactur-ing. With this motive, in this dissertation VSM has been assessed for its efficacy to achieve higher productivity, optimal wastage management and material handling. In ad-dition, focus is made on identifying key factors causing wastages in typical man-ufacturing set up so that it could be eased to accomplish eventual production goal.
22
3. Method and implementation
This chapter deals with the method and implementation that are used to carry out the research or in other words methods that are used to carry out research of the research conducted. Research methodologies is one of the vital sections for the As-is study that represents overall research and study pattern to be incorporated or implemented for ac-complishing overall research objective. This Study adopts both qualitative and quanti-tative methods in identifying the problem statement, literature review, collection and analysis of data and discussion of the results. Undeniably, to explore these factors ex-ploring both available literatures as well as first hand data, also called primary (re-sponse) data is must. Both qualitative and quantitative research methods were used (Porter and Coggin 1995). The qualitative method has been proposed because it can enable answering to the questions of why, how and in what way. Meanwhile, quantita-tive approach is also having great significance to assess various key aspects of intended research work and is equally important as quantitative research. As already stated, this study encompasses a mixed research paradigm that uses both qualitative as well as quantitative research methods.
3.1 Research design
A well oriented and proper outlined research design is of paramount significance for any research work since it helps to answer research questions by designing a systematic approach with a suitable procedure (Saunders, M, Lewis, P., Thornhill, A.., 2009). The research design starts with the decision on the research and its type. Predominantly, there are two types of research explanatory and descriptive.
The explanatory study deals with the review of existing research in the form of literature and aims to justify the problem statement. On the other hand, descriptive statistics de-pends upon a careful and in-depth analysis of the present topic. It imperative to mention that the As-Is study deals with the implementation of lean manufacturing in order to reduce waste generation and to increase output. Additionally, the research aims to de-rive consolations from the existing theory hence, it can be termed as a deductive ap-proach (Williamson.k, 2002).
As stated, the As-is study includes qualitative as well as quantitative approaches and therefore the overall research approach considers descriptive and evaluative or analyti-cal research paradigm to perform intended study.
3.1.1 Qualitative Research
Qualitative research is basically important for achieving specific target information which helps the researcher to stay on top from the huge amount of data that were col-lected for analysis. Also, parameters such as behavioural facts, values, perceptions, opinions and varied significant social contexts of certain targeted populations can be analysed with the help of qualitative research (Williamson.k, 2002).
The study design consists of data collection and research questions that are adjusted according to what has been learnt. Unlike quantitative research investigation, which is
23 based upon seeking answers to questions, systematic use of predefined set of procedures to answer the questions, collecting evidence, producing findings etc.
3.1.2 Quantitative Research
Airasian, Peter and L. R. Gay. (2000) defined quantitative research as the process of data gathering especially the numerical data to characterize, predict and control region of interest (ROI) or the process of interest. In a simple way, Creswell (1994) defined quantitative method as
“The process of assessing or investigating a social or human problem, on the basis of certain defined and testing approach containing research variables, estimated with numbers and assessed with statistical procedures, so as to estimate whether the predic-tive generalizations of the theory hold true or not”
3.2 Data Collection
To meet the objective of the study both primary and secondary data have been collected. The two methods adopted for data collection are positivistic and interpretative. The positivistic approach follows theories testing that is formulated using data deduction which is generated from experimental setup (Saunders, M, Lewis, P., Thornhill, A.., 2009.).
The study has been carried out with a metal fabrication company. Veer-o-metals through purposive stratified random sampling method. The company is Indian based, located in Bengaluru and specialized in sheet metal fabrication. In this research an at-tempt has been made to apply VSM on the key product of the company, PVS- 980 frame. A brief of the data collection process and sources based on data nature is dis-cussed as follows.
3.2.1 Primary Data Collection
In this research work the primary data has been collected through an approach known as triangulation.
Triangulation
Though in the previous sections, a brief description of the different processes applied for performing the research have been discussed, but there is a special term, triangula-tion used in the research work. According to Bauwens., (2010) the term triangulatriangula-tion means use of more than one method to test and confirm the variance of an experiment. Triangulation refers to the process of verification of findings by showcasing the inde-pendent measure of mutual agreement (Miles and Huberman et al, 1994).
Predominantly, there are four types of triangulation (Bauwens., 2010). A brief descrip-tion of the different types of trianguladescrip-tion has been presented in table below.
24 Type of Triangulation Description
Data source Triangulation This means that data were collected from diverse types of the source or various places and analysed
Method Triangulation It implies the use of diverse methods such as observation, interviews and pre-rec-orded documents were considered and evaluated.
Researcher Triangulation It signifies that in the study more than one researcher such as our guide at the firm and people from R&D department as in-volved and different views about an ex-isting problem are collected.
Theory Triangulation It signifies that various theories were considered while addressing the problem.
The As-Is study consists of the data that was collected through observation, interviews and pre-recorded documents and detailed assessments. Based on the assessment the suggestions were given for improvements. Triangulation has been considered signifi-cant for the research because it emphasizes on analysis of documents, interviews and observations and provides a basis to assess findings and check for mutual agreement (Bauwens., 2010).
The advantages of method triangulation are that the observation provides the holistic view of interviews and helps to understand the context of the result with the help of document analysis. Triangulation also helps to understand the similarities and the dif-ferences that are observed during interviews and formal daily talking (Bauwens., 2010). This data collection technique was used to address research question 2.
3.2.2 Secondary Data Collection
In the presented research paradigm, both primary and secondary data have been con-sidered, where the primary data has been obtained by performing extensive review of the literature discussing the need of lean manufacturing, challenges encountered by lean manufacturing, VSM and its significance for lean manufacturing etc. Being a mixed research paradigm, it involves data from both the primary sources such as literatures, articles, magazines, catalogues, journals, newspapers etc. Similarly, to enable quantita-tive research need, the responses from company management officials are also inevita-ble to perform respective perception towards lean manufacturing and techniques such as value stream mapping. Various available resources on internet have also been taken into consideration to perform survey and knowledge retrieval about various strategies required to promote lean manufacturing in manufacturing companies in order to en-hance their productivity.
The literature review is inevitable for planning a properly-oriented research design. This method was chosen because the process of reading articles will help us to understand
25 the current status and will also help to relate to present research, to find gaps. The re-searchers can develop and connect with their own ideas (Galvan, J. L., 2006).
In this phase of study, the predominant emphasis was made on assessing or exploring the key theoretical aspects of the manufacturing processes, key challenges, different wastages in manufacturing process, lean manufacturing, techniques of lean manufac-turing, VSM and its significances to lessen wastages etc. This phase revealed that among the different lean manufacturing process, VSM can have vital role to augment overall manufacturing process and can be effective to enhance production or manufac-turing.
Table 1 – literature review hits
key theoretical aspects Number of Hits
manufacturing processes 779,103
lean manufacturing 176,946
techniques of lean manufacturing 142,634
VSM 60,363
VSM Key Challenges 2,0950
Wastages in manufacturing process 76,900
Material handling 538,527
26
3.3 Case Study
In the previous sections a clear description of the methodologies used for data collec-tion, paradigms etc followed have been presented. Thus, in this section of the chapter a brief introduction of the case studied for this research has been presented.
The research work time line was planned from January 2019 to May 2019. As planned in early stages all the required documents were gathered to assess the production flow and later the required contacts were established within the company to get the clear picture about their production process. After getting the clear view of the production facility the As-Is state VSM was drawn for the further assessment. The material flow was checked and tracked at the stations and the improvements were suggested based on the analysis.
The production facility of the work station at Veer-O-Metals consists of different work-stations such as laser cutting, plunging, tapping, bending, welding and final assembly. The current material handling process and production flow was identified. The activi-ties such as value adding and the non-value adding were identified using customer com-plaint sheets. VSM was conducted on a PVS-980 Frame that was being manufactured for their clients. The stand has 3 major parts, each being manufactured separately. The plan was discussed with the production in charge and drafted before data collection because inappropriate planning might provide misleading or confusing results.
The observations were made at each station before collecting data because it is very important to have a holistic view of production process before drafting a plan. To get the detailed assessment of the companies’ production process it was essential to observe the process flow of the material at each station. The observations at each station were noted for Improved state analysis. Cohen.L, Manion. L, Morrison. K., (2000) asserted that interviews help to exchange views with two or more people hence the questions were designed based on the problem identified and the interviews were conducted with the management responsible for production as well as with the personnel at each station to know about the production process and the work culture in detail.
3.4 Data Analysis
Cohen.L, Manion. L, and Morrison. K., (2000) stated that it is important for the re-searcher to consider the proper techniques for data analysis. The author also specified that before starting the analysis it is important for the researcher to draft a plan. The analysis of data involves organizing, reasoning, and explaining the data which was col-lected during the observations. Further, noticing the pattern flow will help the research-ers to undresearch-erstand the As-Is state of research. Hence, the observation was made at each station of research. Hence, the observation was made at each station before transcribing while a detailed transcription was made after the observation. Additionally, the inter-views were carried out at each station and the data was collected for analysis purpose. Pre-recorded documents were also considered for performing analysis.
27
3.5 Reliability and Validity
The validity of any study can be defined as “the degree to which an interpretation pre-cisely denoted the social events while reliability is defined as “the degree of con-sistency with which instances are assigned to the same category by different observers or by the same observer on different occasions” (Hammersley et al. 2016).
Hence considering the reliability and validity, it becomes imperative to mention that Cohen.L, Manion. L, and Morrison. K., (2000) defined triangulation as a method that is used to assess various aspects in a problem. Triangulation helps to deeply understand the problem that has occurred by analysing it from more than one point of view. Hence, triangulation shows high content validity. The content validity branches out for relia-bility (Cohen.L, Manion. L, and Morrison. K., 2000).
The advantage of using triangulation is that it gives multiple approaches to a problem identified. Further, the confidence of researcher is increased when various aspects of methods give same results. Issues related validity and reliability was thoroughly con-sidered during the questionnaire phase and the questions were framed accordingly dur-ing the study.
3.6 Summary
In this chapter discussion of the various methodologies and associated constructs were discussed. Various approaches such as research design, data collection methods, and the nature of data, triangulation etc. and their implementation to accomplish overall research objectives were briefed.
28
4. Findings and analysis
The focus of this chapter is to discuss in detail the AS-IS state and Expected Improved state analysis and the problems that are identified during material handling and value stream mapping for PVS 980 Welded Frame at Veer-O-Metals.
4.1 Company’s Description and operations
Veer-O-Metals manufactures PVS 980 Welded Frame for one of their clients. When the client rolled out their requirement in their vendor pool, Veer-O-Metals evaluated the requirement and submitted their quote. Finally, the client has identified Veer-O-Metals as their vendor to outsource their product in the global market.
Initially, Veer-O-Metals company was operating to produce a prototype which was pri-marily examined for its quality. Achieving successful quality check, the pilot produc-tion was accepted by the client and Veer-O-Metals initiated the producproduc-tion process. Before beginning the actual production process, the company listed all the material re-quired for production and raised the purchase request. The purchase orders will be placed among the suppliers as soon as the purchase request is received. The supplier delivers raw materials in accordance with the order. At Veer-O-Metals, the quality of the raw materials was checked in the departments, called GRN and SQA to ensure that the raw materials meet the required standards. In case of unsatisfactory quality, the raw materials will be sent back to the suppliers. After performing quality check process, the raw materials are moved to stock.
Production order is an internal document within the organization exhibiting details about how the work will be carried out, the numbers of personnel and the employee who is responsible at each station. The production will be carried out based on the pro-duction order and the raw materials from the storage area will be moved based on the requirements mentioned in the production order. The production is monitored by the management of the organization. After the production, the products are inspected for defects. In case of no defects the products are shifted to finished goods area and stored over there until they are dispatched to clients. After the inspection, the invoice is gen-erated for logistic purpose and is delivered to the desired client location.
4.2 As-Is state Analysis
VSM was carried out at Veer-O-Metals on their core product called PVS-980 Frame. The material handling process has been carried on the raw materials right from storage area where it was stored till the finished goods area where the final products after pro-duction are kept. There are multiple stations between storage area and finished goods area. they are as follows:
• Laser Cutting • Plunging
• Tapping (Threading) • Bending
29 • Final assembly
Sequence of interviews and observations were carried out at Veer-O-Metals to under-stand the process involved in producing the final assembly of PVS-980 frame. During the interviews and observations, it was found that every day at least one frame (PVS-980) was being assembled and shipped to the clients. The assembly of the frame was initiated based on the clients’ demand.
The frame was assembled using its sub-parts (roof, base and pillars) that are produced in advance and stored in the assembly storage area before assembly station. It was also observed that the sub-parts were enough to sustain for the period of ten days and on every seventh day the storage area was re-filled with sub-parts. There was an existence of 3 days of gap ensuring the supply of sub-parts to the assembly station. Even though some delays occurred between the stations or production schedule with respect to other stations, the production at the assembly station never stopped. This As-Is state working was designed by the company’s research and development department.
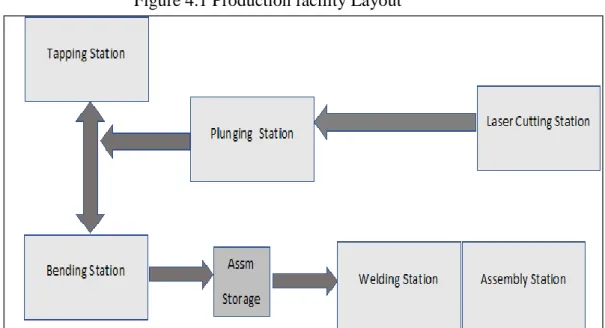
Figure 4.1 Production facility Layout
Figure 4.1 represents the diagram of a production layout that indicates the material flow from laser cutting station to the final assembly station. The original layout map cannot be used for external purposes as per company’s rules and regulations. Hence, a diagram like a layout was drawn to increase the understandability for the readers.
4.3 Study of Process Flow
As depicted in the production layout chart there are numerous stations performing dif-ferent tasks in a manufacturing industry. A snippet of these stations and the task per-formed is provided below.
30 This is a highly automated station and a CNC program was written and installed in the machine at this station. The raw materials are placed on a bed and CNC machine cuts the materials with high precision in required shapes/sizes as per the customer’s require-ment. This process was fully outsourced in order to maintain quality. This station sup-plies the raw materials to other station whenever the basis of demand.
• Plunging station
This station is a semi-automated station. It receives materials from laser cutting station for plunging operation. The materials were brought to this station in a movable stand and are stored at desired place before plunging operation. The purpose of the machine at this station is to punch holes on the profiles (different sized raw materials). This station consists of two personnel (operator and helper) and station in charge, helper and operator were working on the project and the station in charge checks the work in pro-gress. The materials were brought to this station based on the production order.
Figure 4.2 Plunging operation
At first, the required profile was searched among other profiles and the time taken for this search operation was 1.50 min per profile. Prior to the beginning of plunging oper-ation, the helper and the operator search for the required raw materials in a pile of raw materials. Once the profiles were found, the helper assists the operator in fixing the profiles to the machine and the machine operator punches holes based on the drawing issued. During the operation, there are different types of plunges made on the profile using different tools such as M5 and M6. The time taken to change the tools is 30 sec-onds. Employees at this station are not multi skilled, rather they are highly skilled at doing only one operation at a time. The total production time to make the required number of holes on per profile is 161.5 seconds.
31 This station is also semi-automated station. After plunging operation, the materials were moved to this station with the help of movable stand and stored at the desired places. At this station the task was to perform threading operation at the plunged areas was performed. This station also employs helper and operator and the station-in-charge. While the helper and operator are responsible for finishing the work, the station in charge monitors the work in progress. The operator’s job is to make threading at the plunged areas while the helper’s job is to assist the operator in terms of material han-dling and tool changing. The required profiles are searched in a pile of profiles before the operation starts and the average time taken to sort the materials is 2.30 min per profile. The materials are tapped in the plunged areas with the desired tool based on the drawings and the time required to change the tools (M5 and M6) is 1 minute. The total production time required per profile at this station is 220.15 seconds
Figure 4.3 Tapping operation
• Bending operation
The purpose of this station is to give actual shape to raw materials by bending them to the required shapes. The tapped materials are brought to this station and bent to actual shapes such as roof, pillars and base. A helper and an operator employed at this station are responsible for bending operation and station in charge is responsible for progress of work. Initially, the required die is setup for the operation and the time required is 40 minutes. The required materials are sorted from the pile of profiles and placed on the machine for the required bend. Average time taken to set up this operation is 1.50 minutes per profile. Before the actual production starts the accuracy of the bending machine is checked with trail profiles and the bend accuracy is checked by trial and error method using instruments such as Vernier calliper and Bevel protractor. The time required to perform this action was 710 seconds per profile. The total production time taken in this station was approximately 745 seconds.
32 Figure 4.4 Bending Operation
• Assembly storage area
This station is a prime storage area. At this station, the parts that are needed inclusive of all sub-parts were produced well in advance and were stored and utilized as per the need. The management ensures that this section is always filled and supplies the raw material profiles based on the requirement. As mentioned above, the sub-parts were produced for every 10 days and stored in this section. At this station, it was difficult to track the levels of the stock for top management hence they asked the shop floor em-ployee to check with the stock levels and release orders for production
• Welding station and Final assembly
At this station, the final assembly is witnessed. The raw materials from assembly stor-age section are transported here. Three stands were assembled separately and later welded (refer diagram 4.5) as one single stand and shipped to the customer. The process employs a total of eight helpers, operators etc. At the welding station, the welding used to join the profiles are Mig-brazing. It is considered suitable because of the utility of the finished products and because it holds the profiles intact. The average time taken to bring the raw materials from the assembly storage area to the welding station was noted to be 80 sec and for the operation is 50 sec. The frame is made to rotate in the required direction without any help from the machines and the time consumed is 272 sec. The total production time taken in this station was approximately 416.68 seconds.
33 In Final assembly station, three stands are made separately and then assembled as one before shipping. The required profiles are taken up from the assembly storage area and are assembled with the fixtures and rivets. The average time taken for this action is 160sec. For, every fixture and rivets the employee fetches from the table which is placed at a distance from the process and the time taken for the movement is 110sec. The assembly stage is the final stage where all the sub parts take up their final structure and the frame is ready for shipment. The total production time taken in this station was 29182 seconds.
Figure 4.5 Final assembly and welding station
The VSM was drawn from the observations that were made at each station for As- Is state analysis for the sub-part pillar was plotted based on the observations at each sta-tion. The takt-time is computed for one product per shift.
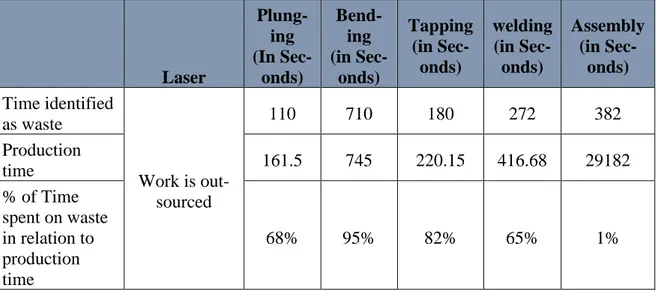
Table 4.1 Time spent on material handling in relation and production time per profile
Laser Plung-ing (In Sec-onds) Bend-ing (in Sec-onds) Tapping (in Sec-onds) welding (in Sec-onds) Assembly (in Sec-onds) Time identified as waste Work is out-sourced 110 710 180 272 382 Production time 161.5 745 220.15 416.68 29182 % of Time spent on waste in relation to production time 68% 95% 82% 65% 1%
34 Figure 4.6 As-Is state analysis Value Stream Mapping
The figure 4.6 represents the As-Is state of the production process, the order was re-ceived from the customer through electronic communication and the production con-trol plans the weekly schedule and dispatched to each station to perform production operation. From the above map the As-Is cycle efficiency was observed as 19%.
4.4 Waste Identification
The raw materials were mixed at almost every station. However, the reason for the materials mix up was identified with the help of the fishbone diagram shown below.
35 Figure 4.6 Fishbone diagram
The above Figure 4.6 was plotted to identify the root cause for lag in production at stations, it was identified that the root for the problem was in system due to unstructured management where the materials were mixed up. The above diagram helped in getting a holistic view of the production facility and the root causes for Lag. The analysis was done at each station and it was observed that plunging, bending and tapping stations received mixed profiles. Operators at this station spent lot of time to find and segregate profiles before each operation. The questions were asked at the target stations to iden-tify where exactly the materials were mixed but the answers given by the operators were not satisfactory. Hence, the fishbone diagram and root cause analysis were performed to identify the allied problems. The analysis was carried out all the stations and it was concluded that when the company received profiles from suppliers the operators checked and counted the raw material profiles and it was identified that materials were mixed up during the count.
A brief description of the waste identification problems occurring at each station is pre-sented below.
• Laser station
At Laser station generally, the materials have to be cut at the laminated side, but in few instances, materials were cut on the opposite direction hence operator was confused and made plunging in the wrong direction which resulted in waste accumulation.
• Bending station
36 o After completion of bending operation, it was observed that the raw
ma-terial profiles have shown bends at non-desirable places which were be-cause punching die has become old and worn out. This eventually resulted in rework.
o Some raw materials profiles were chosen for trial bend and to check their accu-racy the operators used Vernier calliper and bevel protractors. Since there was only one Vernier calliper and bevel protractors available at station, so the oper-ators had to wait for their turn, hence waiting time of 250 seconds was witnessed here.
• Tapping station
Similarly, at the tapping station also two types of waste have been witnessed, time and rework.
o Materials were brought here to make threads at plunged areas. Certain raw ma-terials profiles consisted burrs from laser cutting. To remove burrs workers had to invest extra time rather spending effective time on tapping operation which led to wastage of time.
o Some completed and delivered materials also came back for some kind of re-work and that too without any prior schedules which significantly delayed the main schedule activities.
• Assembly storage area
At Assembly storage area, the materials were brought and stored before welding and assembly. Since there was no tracking system available for stock maintenance, it led to huge difficulty in identifying shortage of products. Hence, top management had faced difficulties in identifying raw material profiles which were in shortage and need to be produced immediately. Hence a visual management system was developed in order to help the management to view the scarce products.
• Welding station
Primarily, there were three major issues observed at the welding station. They are wit-nessing brazing cracks, re-work and lack of safety.
o Since the roof gap consists of 0.05mm thickness and the gap was not enough for brazing purposes, there were observed brazing cracks on the roof of the product. The operator used stool which had very little space to stand and caused the fear of falling. This is also one of the reasons why welding cracks were observed.
o After laser cutting operation the materials were not cleaned properly which resulted in extra laser burrs and caused blow holes on a welded strip leading to the crack in a weld joint. Hence, the operator invested his time in removing the laser burrs lead-ing to the wastage in terms of time. In addition, durlead-ing weldlead-ing entire stand is tilted