J
Ö N K Ö P I N GI
N T E R N A T I O N A LB
U S I N E S SS
C H O O LJÖNKÖPI NG UNIV ER SITY
Short sale restrictions
The Swedish perspective
Bachelor Thesis within Finance Authors: Andersson, William
Bodestedt, Fredrik Hjortsjö, Carl Tutor: Österlund, Urban
Authors’ Acknowledgements
Authors’ Acknowledgements
Authors’ Acknowledgements
Authors’ Acknowledgements
We, the authors, would like to show our appreciation of the aid and assistance we have gotten from our tutor Urban Österlund and statistics professor Thomas Holgersson.
We would also like to thank our respondents Linda Hedvall and the anonymous investor for their valuable insights.
Finally, we would like to mention our opponents for their feedback during the seminars.
... ... ...
Bachelor Thesis within Business Administration
Title: Short sale restrictions – The Swedish perspective
Authors: Andersson, William
Bodestedt, Fredrik Hjortsjö, Carl
Tutor: Österlund, Urban
Date: December, 2008
Subject terms: Short selling, Regulation, Sweden
Abstract
Background: In times of financial crisis short selling is often quickly blamed for
price volatility and media broadcasts pleads for prohibitions and restrictions. Extensive research, however, cannot find any empirical evidence that shorting is affecting markets negatively; often it is the other way around. Sweden has been relatively liberal when it comes to shorting restrictions and even though share lending has increased since the start of the year, no actions have been taken by the Swedish Financial Supervisory Board.
Problem: Is there a correlation between the number of shorted shares and the
change in overall and individual stock price? What actions have been taken by countries in Europe, Asia and the United States regarding short selling during the fall of 2008 and what is SFSB’s attitude towards the subject? Are there any benefits for the Swedish financial market from shorting regulations?
Purpose: With background of other countries’ actions, the purpose of this
report is to investigate why, if at all, short sale regulations should be introduced on the Swedish financial market.
Method: The analysis have been drawn from four cornerstones; previous
research, actions of other countries’, a statistical analysis and interview findings. We have examined and compiled different strategies for restricting short sales around the world as well as conducted a cross-correlation analysis to investigate if share price is related to stock loan. Furthermore we have interviewed a professional investor and a middle manager at the Swedish Financial Supervisory Board to obtain experts’ views on the subject.
Conclusion: Based on our findings we do not advocate short sale regulations to
be introduced on the Swedish financial market. Neither does our analysis indicate that the market performance is significantly affected by shorting, nor does restrictions work as intended which we have seen in other countries during the fall of 2008.
Definitions
In this paper some concepts and technical language, which are specific for finance and short selling, will be used. In order to assist the reader a number of concepts and technical lingo, which are not defined in the text or could be useful to get minor knowledge of before arriving at the in-text explanation, will be defined as to their meaning in our context.
Asymmetric information: A situation in which one party has more or superior
information compared to another (Peirson, Brown, Easton, Howard, & Pinder, 2006).
Bear Raid: The illegal practice of attempting to push the price of a stock
down by taking large short positions and spreading unfavorable rumors about the target firm (Hirt & Block, 2006).
Bid-ask spread: The difference between ask and bid price on for instance a
share (Hirt & Block, 2006).
FIT: The Financial Instrument’s Trade act, the main law
regulating short sales in Sweden (1991:980).
Naked Short Sale: Selling a stock short, without first borrowing the shares or
ensuring that the shares can be borrowed as is done in a conventional short sale (Hirt & Block, 2006).
Short Sale: Short selling is used primarily as a hedging tool to make
profits from a drop in share value. When investor A borrows an amount of stock from investor B, with interest, and then sells them to the market. When the time comes to return the stock to B investor A acquires the stock of the market, hopefully at a lower rate than he sold them, and returns it to B (Hirt & Block, 2006). Short sale is also known as e.g. shorting, going short, short selling, taking a short position etc.
Speculation: In this thesis, speculation will be defined as buying securities
at high risk with the sole intention of making a direct profit from the transaction, i.e. not to reduce portfolio risk or to take advantage of arbitrage opportunities.
Up-Tick Rule A rule in the US market which existed for over 70 years
which states that shorting is only possible on stocks which has increased in price since its last trade or if remained constant, has increased since the last trade when the price changed. An explanation follows.
Up-tick rule (SEC: Short Sales; Proposed Rule, 2003)
The first execution at 47.04 is higher than the previous trading price 47, which is called a plus tick. The following transaction at 47.04 is at the same trading price and is then called a zero-plus tick. According to the Up-tick rule short sales can be executed at 47.04 or above since the trading price ticked up or at least traded at the same price. On the two following executions the Up-tick rule prevents short selling the stock since the price went down from 47.04 to 47 (SEC: Short Sales; Proposed Rule, 2003).
Supervisory Authorities
Belgium: Commissie voor het Bank-, Financie- en Assurantiewezen
(CBFA).
China: Securities Regulatory Commission (SRC).
Greece: Hellenic Capital Market Commission (HCMC).
Hong Kong: Securities and Futures Commission (SFC).
Spain: Comision Nacional del Mercado de Valores (CNMV).
Sweden: The Swedish Financial Supervisory Board (SFSB).
UK: Financial Services Authority (FSA).
Table of Contents
1
Introduction ... 1
1.1 Background... 1
1.1.1 History of short selling regulations in Sweden ... 2
1.2 Problem ... 3 1.3 Purpose ... 4 1.4 Delimitations ... 4
2
Method ... 5
2.1 Research approach ... 5 2.2 Research method ... 62.3 Sample and limitations ... 6
2.4 Data collection ... 7
2.5 Data analysis ... 8
2.6 Reliability and validity ... 9
2.7 Interview ... 10
3
Theoretical framework ... 12
3.1 Efficient market hypothesis ... 12
3.2 The concept of short selling ... 13
3.2.1 Motives behind short selling ... 13
3.2.2 Expected returns and risks ... 14
3.3 Regulations in foreign countries ... 15
3.3.1 European Union ... 15
3.3.2 The United States ... 17
3.3.3 Asia ... 18
3.4 Previous research ... 19
4
Empirical findings and analysis ... 22
4.1 Statistical analysis ... 22
4.2 Hedge fund’s perspective ... 26
4.1 The Financial Supervisory Board ... 28
4.2 Further analysis ... 29
5
Conclusion ... 33
5.1 Critique ... 33
5.2 Future Research ... 34
6
References ... 35
Appendix 1 - E-mail interview questions ... 38
Appendix 2 - Cross-correlation ... 40
1
Introduction
______________________________________________________________________
In this section we present the background of our chosen subject together with a problem discussion. We also familiarize the reader with a brief history of short selling regulations in Sweden and finally, we present the purpose which will specify the investigated problems in this research.
______________________________________________________________________
1.1 Background
When this paper is written, the economic crisis resulting from the US mortgage situation is in full effect. More and more countries around the world are temporarily prohibiting or introducing restrictions against short selling. Sweden is, however, still an open market for short sellers. Concerns have been voiced that this situation will attract foreign actors, further destabilizing the Swedish market and there have been discussions about implementing restrictions similar to those in e.g. the US and UK (Neurath, 2008). At the helm of restriction demands is Swedbank, one of the major commercial banks in Sweden, whose stock has been lent at record levels during September 2008. They claim that short selling is currently used to manufacture abnormal market trends. Chairman Carl Eric Stålberg even goes as far as to demand a ban of short selling of financial firms until the end of the year (Svensson, 2008).
To the contrary there are objections to restrictions, financial actors who state that short selling stabilize the market and restrictions or prohibitions are useless. When the United States and the United Kingdom banned short selling in banking and financial shares, Bengt Rydén, President of the Seventh AP Fund and previously head of the Stockholm Stock Exchange and Mats Qviberg, a well known profile and actor in the Swedish financial sector, considered this as a measure that was both futile and wrong. Rydén claimed that short selling does not necessarily mean increased volatility, which is a common argument from opponents of short selling, but instead helps to stabilize the market, something Qviberg agrees with (Lejland, 2008). Richard Forslid (2008), professor in Economics at Stockholm University, wrote on Ekonomistas that short selling fulfils an important role in a normally functioning market. He argue, however, that due to the current financial crisis, short selling constraints should be implemented on financial shares as a result of the plunge in share price and because short sellers can create a crisis of confidence.
The term short selling has been in use since the mid 19th century even though the concept
has been around for much longer. Chancellor (2001) writes that short sellers have been blamed for driving stock prices down during the great Wall Street crash of 1929, and the events after 9/11 2001. Even during the Asian currency crisis of 1997, short sellers were blamed of being a part of the destruction of the “Asian Miracle” as Bris, Goetzmann and Zhu (2003) describes it.
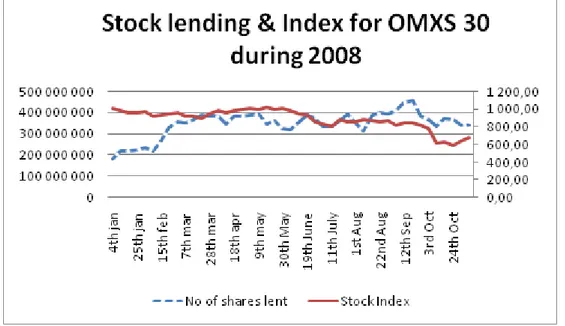
As can be seen in figure 1-1 below, our compiled data (retrieved from OMX Nordic) shows the number of shares lent has increased during 2008, from 182 million in the beginning of the year to over 340 million on November 7, peaking on September 19 with over 450 million lent shares. Most of the lent shares have been used for shorting purposes. How this has affected, if at all, the overall market and individual stock performances have been heavily debated and will be part of our research.
Figure 1-1 (adjusted for Ericsson fusion excluding data for Nokia and Eniro)
1.1.1 History of short selling regulations in Sweden
The short sale regulatory framework in Sweden has changed throughout the years. In 1991 the prohibition of selling short, which had been in effect since 1979, was revoked (Ek & Petersson, 1994). The law Fondkommissionslagen (1979:748) together with 1979:750 was replaced by a new law called Lagen om Handel med Finansiella Instrument, LHF (1991:980); the financial instrument’s trade act (FIT). The underlying reasons of the prohibition were that Stockholm’s stock and fund exchange was regarded as too small and had only a limited supply of stocks and funds. Furthermore, short selling was considered to be highly
0 50 000 000 100 000 000 150 000 000 200 000 000 250 000 000 300 000 000 350 000 000 400 000 000 450 000 000 500 000 000 4 th j a n 1 st f e b 2 9 th f e b 2 8 th m a r 2 5 th a p r 2 3 rd m a y 1 9 th J u n e 1 8 th J u ly 1 5 th A u g 1 2 th S e p 1 0 th O ct 7 th N o v
Number of shares lent OMXS30 2008
Number of shares lent 2008
with knowledge of a particular market situation had an advantage compared to less informed actors. However, views changed and when FIT was implemented, reintroducing shorting, speculation was considered to occur in trading with all securities, e.g. options, derivatives and warrants. To have knowledge and be informed of a market situation was not viewed as being specific for short selling; it was now considered a general matter. There were also arguments stating that if short selling was permitted, the market would become more efficient as opportunities to sell short contribute to higher liquidity and, secondly, if more actors can express their opinions of price at a certain point the price setting will be closer to its true value (Holmquist, 1994).
The authority overseeing the financial instruments market is the Swedish Financial Supervisory Board, SFSB. They are continuously collecting data on the amount of stocks borrowed, and since 1993 institutes trading with securities should report the quantities of stocks borrowed and lent (Ek & Petersson, 1994). Consequently, SFSB is always informed about the amount of stocks borrowed.
1.2 Problem
One of the problems with short selling is that speculators at times use it to illegally manipulate the market. As explained earlier, short sellers earn profit if the price of the borrowed stock declines. The incentive to drive the market down increases, since heavy shorting gives sell signals to investors with long positions, leading to a negative spiral and loss of trust in the share. Therefore, short sellers are often blamed for driving a stock down. A part of such situations assumes a relationship between shorting and stock prices. Thus, is there a correlation between the number of shorted shares and the change in overall and individual
stock price?
In Sweden, as well as in other countries, financial authorities are supervising domestic companies and the stock market in order to maintain stability and equality. It is up to respective financial authority to introduce proper measurements in order to accomplish their objectives. In 2008 a great deal of countries have faced a common problem, a financial crisis where short selling is a hot topic accused of making financial markets unstable and unequal. What actions have been taken by countries in Europe, Asia and the United
States regarding short selling during the fall of 2008?
There are executives and experts who claim that short selling drives the market down and should, in times of uncertainty and high volatility, be forbidden. For example, Michael D.
McKenzie of RMIT University believes that the market displays greater volatility following a period of short selling and that asymmetric response to returns appears to be exaggerated by short selling (Vaknin, 2007). Conversely there are also those who advocate short selling to be allowed since it contributes to market efficiency and higher liquidity. This side of the issue is presented, among others, by professor in finance and economics Charles E Merrill from the Stern School of Business at New York University who claims that if short selling is not allowed the market will be prevented of efficiency; short selling restrictions would magnify volatility and crisis could be escalated. If it is disallowed to sell short the market cannot discount the true sentiment (Vaknin, 2007). How do Swedish professionals such as Hedge
Fund managers and the SFSB look at short selling and shorting restrictions?
Short selling has been blamed of affecting many countries’ financial markets negatively, pressuring restriction discussions. There have been great deals of research, primarily American, on the subject although Swedish research is scarce. We are, thus, taking on a Swedish perspective in this report. Are there any benefits for the Swedish financial market from
shorting regulations?
1.3 Purpose
With background of other countries’ actions, the purpose of this report is to investigate why, if at all, short sale regulations should be introduced on the Swedish financial market.
1.4 Delimitations
In this thesis, the authors have limited the Swedish financial market to only focus on Large Cap companies listed on OMXS 30. Furthermore, information regarding other countries’ actions has been narrowed down to major economies in Europe, Asia and the United States. Regarding the conducted interviews, the Swedish Financial Supervisory Board and a representative from a major Swedish hedge fund are included. The authors consider this delimitation valid even though more interviews would have been preferred. The statistical observations span the first 45 weeks of 2008.
2
Method
______________________________________________________________________
In this section research approach and method are presented and justified. We describe how the sample has been chosen, how the literature has been obtained and how our quantitative data has been tested. Further, we discuss the reliability and validity of our research.
______________________________________________________________________
2008 is a year reflected by a worldwide financial crisis where short selling has been a hot topic in many countries around the world. Countries have had different strategies of implementing restrictions to short selling even though they are in a similar situation. We have therefore investigated short selling restrictions in Europe, Asia and the United States. With such a basis we have been able to evaluate if the Swedish Financial Supervisory Board (SFSB) should take similar measures as a step in bringing harmony to Swedish investors and stock market. Two e-mail interviews, one with a representative of a Swedish hedge fund and the other with Head of Surveillance, Linda Hedvall at SFSB, have also been conducted to give us further insights and perspectives. Furthermore, we have performed statistical tests to evaluate if there is a correlation between the amount of shares lent and share price since discussions whether increased short selling activity leads to downfalls in share prices has been frequently debated in media during the autumn.
The combination of the findings from our quantitative study and interviews, together with regulatory findings in other countries and previous literature has enabled us to conduct our analysis. Said method has not lead to a statistically secured conclusion. It has, however, given us a clear indication of what ought to be the case.
2.1 Research approach
The two main research approaches are the inductive and the deductive approach (Saunders et al, 2007). These should not be treated as mutually exclusive since one can use a combination of the two, also known as abduction. In the deductive approach the researcher develop a theory and hypotheses and design a research strategy to test the hypotheses, while in the inductive approach the researcher tries to get a deep understanding of the research context. Not many theses are purely inductive or deductive, neither is ours. The quantitative part of our study has a deductive approach where we have tested the hypothesis that there is a correlation between stock loan and prices. We have, however, followed more of an inductive approach when conducting our interviews and
studied regulations in major economies around the world. Since both methods have been used, an abductive research method is most accurate for this paper.
2.2 Research method
A study can have a qualitative or a quantitative research method depending on the nature of the chosen topic. Furthermore, it is not unusual that the study requires a mix of the two. In a quantitative method, the researcher collects and classifies data from a large sample to construct statistical models in an attempt to explain what is observed (Saunders et al, 2007). As part of our study, we used a quantitative research method to examine whether a correlation between the two variables, change in stock lending and change in stock price, exists. This part of the study told us if increased short selling activity contributes to falling stock prices.
The purpose of this report is, however, to investigate if short sales regulations should be implemented in Sweden and in order to fulfil this purpose, a qualitative method has also been used. The aim of a qualitative research method is to complete a detailed description of an area of interest, and the researcher can then use a smaller sample where he or she studies the sample in greater depth (Saunders et al, 2007). Besides the interviews we have also tried to accurately describe what constraints the United States and countries in Europe and Asia have put forth on short selling recently and historically. This gave us an indication and better understanding of alternative ways to address the alleged problem of short selling, and helped us when drawing conclusions from a Swedish perspective. Furthermore, previous research has been closely scrutinized and used to evaluate empirical evidence of consequences of shorting restrictions.
2.3 Sample and limitations
The sample for our quantitative study is companies listed on OMXS30, OMX Stockholm 30. This is an index consisting of Stockholm listed stocks with the highest trade turnover. OMXS30 is a commonly cited index by e.g. financial newspaper and is considered to be quite representative for the Stockholm stock exchange. Therefore, we consider it a suitable sample.
Swedish companies are organized in three market cap segments, Large Cap, Mid Cap and Small Cap depending on their market capitalization. The Large Cap segment consists of companies with a market value of at least €1 billion. Mid Cap range from €150 million to
1€ billion and Small Cap is companies with a market value less than €150 million (OMX, 2008).
OMXS30 consists of 28 companies from the Large Cap segment, for which both stock prices and information regarding stock loan could be obtained from OMX. For the two companies listed on Mid Cap and Small Cap, Eniro and Nokia Oyi respectively, information about stock loan could not be retrieved, and for that reason, these companies are excluded in our study. The companies in our research are presented in table 2-1 below.
Table 2-1 Sample companies
The intention of including interviews as part of our report was to establish an objective view of short selling from different actors in the Swedish financial market. Therefore, we wanted to interview both investors using short selling as a tool to hedge their portfolios against risks, companies whose stocks have been shorted to a large extent, as well as SFSB. Unfortunately, due to the current market situation, all potential interviewees except one investor, working for a large hedge fund in Sweden, and SFSB declined our invitations, either by referring to company policy or lack of time. The interviewees we have are, however, in our opinion highly reliable and have contributed to the result of this thesis.
2.4 Data collection
For this thesis, secondary data has been collected in various ways. First of all, we have collected secondary data on previous short selling research, secondly, the observations for our statistical quantitative analysis and, finally, data regarding short selling restrictions around the world.
There are several important studies within the field trying to explain the overall stock and market effects of regulations. Such studies have been collected mainly through Google Scholar and JSTOR Business. Business Source Premier (BSP) and ABI/Inform have also been of use. Google scholar was chosen as it searches a multitude of databases, can be easily accessed and has a user-friendly interface. JSTOR Business, ABI and BSP are narrower and contain more specific data.
Our search strategy has been to initially focus on broad articles and papers that are key works within the area of short selling. From our findings we dug deeper, e.g. by the use of their references and found more niche information. Key words to be used are such as “short
sale”; “short selling”; “stock/share lending”; “hedge funds”; “hedging”; +”regulations”; +”Sweden”; +”history” and we have used the Swedish translations as well.
Stock loan and share price data of our chosen sample was collected from OMX Nordic Exchange’s homepage. Stock loan information is compiled once a week and we have manually collected the data for the companies of interest, spanning the first 45 weeks of 2008, giving us observations of N=44. All such data presented in this thesis have been adjusted for fusions, splits and new share issues. It is notable, for instance, that Ericsson had a stock fusion on the 2nd of June which had a significant impact on total shares lent in
the market as it decreased the amount with more than 150 million shares. Share price data was collected in a similar way and have been adjusted for fusions, splits and new share issues.
We have also gathered information of current regulations in Sweden and other European countries from the SFSB and the Committee of European Securities Regulators (CESR). The SFSB and CESR are the supervising authorities and as such one can be assured of accurate information when retrieving data directly from them. Further information from the US and large Asian markets, including China and Japan, has been collected from relevant financial authorities as well.
2.5 Data analysis
We have chosen to test the hypothesis that there is a correlation between the change in the amount of shares lent and the change in share price by doing a cross-correlation analysis at different lags. A cross-correlation analysis is more reliable than an ordinary Pearson correlation analysis since we are working with time series. The reason why we have to test
the change, Y
X
∆
∆ of the variables, stock loan and share price, is because the variation of stock prices is infinity. As the stock market moves at a “random walk” the variance is defined as infinity, i.e. there is no upper or lower bound on share price changes. To test time series, such as share prices over time, we need to test the cross-correlation of Y
X
∆ ∆ (T. Holgersson, personal communication, 2008-11-13).
Due to market inefficiency it takes some time for the market to adjust to new information and therefore we have chosen to study the cross-correlation coefficient, Rt, at lags from t-4
to t+4 weeks. This gives us the lagged correlation coefficient four weeks before and four
weeks after the actual observation date. The zero lag correlation coefficient is the same as if we had conducted a Pearson-correlation test.
The correlation coefficient can have a value from -1 to 1, where Rt = 0 implies that there is no correlation between the two variables. If the correlation coefficient is positive, share price tend to increase when the amount of lent shares increase, assuming that share price is the dependent variable and decrease when number of lent shares decrease. The opposite applies if the correlation coefficient is negative. If R were to be -1 or 1, share loan would be the only factor affecting the share price (Aczel & Sounderpandian, 2006). This would, however, not be realistic since there are many factors affecting the share price.
The coefficient of determination, R2, gives information about the goodness of fit of the model andcan have a value between 0 and 1, where a high value indicates that much of the dependent variable can be explained by the independent variable. Assuming that share price is the dependent variable and that R2 = 0.5. In this case 50 percent of the change in share price can be explained by the change in the amount of shares lent. Since our sample is small, we are however using the adjusted R2. R2 can sometimes be upward biased,
especially when using small samples, which is corrected by the adjusted R2. The
interpretation of the two R2 values are however the same (Aczel & Sounderpandian, 2006).
2.6 Reliability and validity
Since the secondary data for our quantitative research have been collected from OMX, we find no reason to question the quality of the data. One of the threats to validity in our research is, however, the lack of data concerning stock loan from foreign investors. OMX Stockholm only collects data on stock loan from domestic owners, which means that
shares lent by foreign investors are not included in the statistics. Also, even though the shares lent are primarily used for selling short, they can be used for other purposes as well. According to Ek & Petersson (1994) 85 percent of the lent shares are used for arbitrage, hedging and speculation, while the remaining 15 percent are used to take advantage of the vote right embedded in the share and to cover delivery delay.
The time it takes for an investor to loan a share to actually sell it on the market can be lagged but this aspect should be eliminated since we account for a time lag from t-4 to t+4
weeks in the analysis.
A threat to reliability is the number of observations in our research. For each of the 28 companies in our sample, data of stock loan and share price has been collected for one day a week for the first 45 weeks in 2008. Our results would probably have been more reliable if data was collected for a longer period of time, but due to the fact that we had to gather the data manually, a time consuming process, we had to limit the data for a shorter period of time.
For the interview, a qualitative research method was used and for that reason, this part of the study is less structured with less need to generalize compared to the quantitative section, hence lower validity. Subject biases are a real threat to reliability due to the absence of respondents representing companies whose shares have been shorted to a great extent. Also, we cannot know that responses from the interview participants are accurate, without bias and/or respondents’ honest opinion. Moreover, when this paper is written, we are in the midst of a financial crisis and therefore we will not know how this may have affected the answers. Furthermore, we have tried to subdue any observer bias as the aim is to be as objective as possible. Observer error is met through close collaboration to ensure that similar methods have been used by all authors.
2.7 Interview
The original intention with the interviews were to get several face-to-face discussions with representatives from firms which have suffered of heavy shorting on the one hand, professional investors on the other and SFSB in the middle. We had planned for interviews of approximately 45 minutes to deeply penetrate the subject. Due, in part at least, to the ongoing crisis it turned out to be harder to realize than expected. The commercial banks did not want to leave any statements, while hedge fund managers were too busy at the time or were restricted by company policy. Even SFSB, who have reputation to aid students in
their requests, could not find time for a full length interview, although they were willing to answer our questions through e-mail. Subsequently we were left with merely two respondents who were willing to answer our inquiries by e-mail, Linda Hedvall representing SFSB and a hedge fund manager who requested to be anonymous. It was this situation which led us to add a statistical analysis, which were not intended originally. With such an inadequate response we felt, for the sake of the reliability of the report, that it needed more empirical findings in order to lead us to more accurate conclusions. We want to point out, however, that even if response was low, the information we did receive are from dependable sources and are of commendable quality.
For the interviews we chose to use open questions (Bryman & Bell, 2008, Sounders et al. 2007) since we wanted the respondents to answer in their own terms. The questions were designed individually for each respondent and therefore, different questions were asked to the interviewees. Our theoretical framework was used as a base when creating the questions even though a few questions arose after participating in discussion forums online i.e. DI.se. Since the original idea was to perform full length interviews, we had to restrict the number of questions, both because the respondents had limited amount of time to answer and because we wanted the answers to be as detailed as possible. The questions (Appendix 1) were sent to the respondents together with a description of the purpose of this report. Both our interviewees are highly knowledgeable within the topic and therefore, we did not find it necessary to describe the background to each question.
3
Theoretical framework
______________________________________________________________________
In this section we present the theoretical base that has been used for our empirical study. The efficient market hypothesis is introduced since speculating in stock movements would be useless in an efficient market and short sale is explained in detail. Further, actions by other countries are presented and finally, previous research is discussed and constitutes the foundation of our empirical study as it has aided us in constructing interview questions and interpreting participants’ answers.
______________________________________________________________________
3.1 Efficient market hypothesis
In the 1970’s the efficient market hypothesis was a widely accepted belief within finance, assuming that the market price of securities fully reflected all information available. According to the hypothesis, market prices would reflect new information instantaneous and unbiased (Peirson et al, 2006). Under those assumptions it would be impossible for an investor to consistently beat the market. Neither fundamental analysis, which is the analysis of financial information, nor the study of past stock prices to predict future stock prices, also known as technical analysis, would be useful as an investor would not be able to harvest returns greater than those that could be achieved by holding a random portfolio with the same risk (Malkiel, 2003). Malkiel wrote in his influential book, “A Random Walk
Down Wall Street” in 1970, that a chimpanzee throwing darts at the Wall Street Journal
could select a portfolio generating the same return as professional investors. Under the assumptions of a perfect efficient market this would be true, however, stock prices do not reflect new information instantaneous and unbiased and therefore the market is not efficient (Hirt & Block 2006).
Fama (1970) suggested three forms of efficient market hypothesis. In its weakest form, all past market prices and data are reflected in securities prices and therefore, technical analysis is useless. The semi-strong form assumes that all public information is reflected in the security prices, making fundamental analysis of no use. In its strongest form even private information would be fully reflected in security prices.
The stock market efficiency has been measured in several studies, e.g. Basu (1977) and much of the conclusions drawn have pointed on semi strong market efficiency.
3.2 The concept of short selling
Selling short is a financial tool investors can use to create a return even if the value of a single stock is declining or when the stock market has a downward trend. In finance one distinguishes between going long and going short, where going long refers to an investor who buys stocks, believing that the price of the stock will increase in the future. On the other hand, when an investor goes short, he foresees a decline in the share price.
We will provide an example of how to conduct a short sale.
Step 1 - Investor A, borrows 10 000 stocks in company X. His broker will lend him the
stocks.
Step 2 - He immediately sells the stocks for 10 SEK each, receiving 100 000 SEK less
commission fees.
Step 3 – A week later, the share price has decreased to 9 SEK and investor A wants to close
the short by buying back the same amount of shares, also known as covering.
Step 4 – He pays 90 000 SEK plus commission and return the shares to the broker making
a profit of 10 000 less the commission fees. Usually the broker also charges an interest fee for lending the shares.
There is normally not an agreed time of the closure of the short sale. The short seller can therefore return the shares when he thinks it is appropriate.
3.2.1 Motives behind short selling
Ek and Petersson (1994) describe three strategic incentives behind short selling. (1) Arbitrage; the investor uses short selling to benefit from market inefficiency arising from mispricing of stocks and other financial instruments, (2) hedging; the investor uses short selling to reduce or cancel out risk in other investments and (3) speculation; as the name refers to, this is a purely speculative strategy. The investor does not have the risk-free return, arbitrage, or insurance, hedge, but in return the yield can be relatively high. This is, however, a highly risky activity and only a small proportion of short selling is used for this purpose.
Another motive for going short is described by Averil, Morse and Stice (1990) and is referred to as “shorting against the box”. This concept implies short selling securities the investor already own. Holding a short and long position simultaneously results in a neutral
against the box is to delay taxes. If an investor makes a large profit during e.g. the first three quarters of a year and then speculates that the market will decline during the fourth quarter and the following year it can be assumed that he would like to sell off his shares. If the investor shorts against the box, he can wait until next financial year before he collects parts of the gain, which can put him in a lower tax bracket in the current year without risking that the shares will decrease in value.
3.2.2 Expected returns and risks
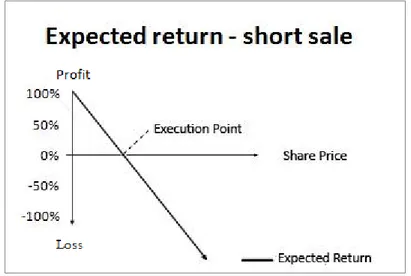
The expected return from a short sale can never be greater than 100 percent under the assumption that the price of the shorted security has fallen to zero. This is, however, not likely to happen although financial markets can in periods of disturbance be highly volatile, causing stocks to fluctuate to a great extent as we have seen during the fall of 2008. Short selling is, on the other hand, a risky business since there is no limit of the investor’s potential losses. There is no theoretical end to how high prices can go, above statements are illustrated in figure 3-1. If the price of a security increases rapidly, short sellers may be forced to cover their positions. If many short sellers buy back their shares at the same time, the price of the stock can be pushed higher than normal making it devastating for the investor, also known as short squeeze (D'Avolio, 2002). Also, looking from a historical perspective, stock prices tend to increase over time which indicates that, ceteris paribus, holding a short position involves more risk than holding a long position.
3.3 Regulations in foreign countries
In this part of the theoretical framework, we have investigated how different countries around the world have treated regulations regarding short sales, historically as well as present. Just as most legislative systems, the legal framework around shorting changes continuously. In turbulent times, such as when this report is written, restrictions are implemented and removed almost weekly. This guide will present the situation as of the end of October 2008.
The majority of the discussion is from a Swedish perspective, founded on the market situation in Sweden. Regardless of what country in the world, a topic like short selling will be evaluated from a home ground perspective. All countries have their own financial regulatory authority which purpose is to oversee the financial system. In Sweden, the Swedish Financial Supervisory Board (SFSB) is supervising companies and stock market in order to maintain stability.
3.3.1 European Union
Restrictions State of Alert No Actions
Austria Italy Finland Sweden Bulgaria Lithuania
Belgium Luxemburg Czech Republic Malta
Denmark Netherlands Cyprus Poland
France Norway* Estonia Rumania
Germany Portugal Hungary Slovakia
Greece Spain Latvia Slovenia
Iceland* U.K
Ireland Russia*
Table 3-1 Actions in Europe (* Non-EU countries) (Jakobson, Ü-R. 2008)
As seen in table 3-1, there are 27 countries in the European Union. We have placed each country in one of three possible categories; Restrictions, State of Alert and No restrictions. An independent organ within the European Union which is of economic importance is the CESR, the Committee of European Securities Regulators. The role of CESR is to improve the coordination among individual countries securities regulators. Furthermore, CESR implements measures of EU directives in the field of securities and also manages the implementation of legislation in member countries (Measurements recently adopted by CESR members on short-selling, 2008).
Short sales ban
Germany, Italy, the UK and France are considered as economies of importance in the European Union. These countries, as well as the neighbouring giant, Russia, have all taken strict actions regarding short selling. On September 22, 2008 these countries made announcements stating their action, banning short selling. For example, Italy wished to avoid frequent speculations while the UK tried to reduce the volatility in order to prevent a negative spiral of an already decreasing stock market. The time range of the prohibition differed, Italy had the ban lasting until the end of October while short selling in Germany and France will be forbidden until the end of the year (Measurements recently adopted by CESR members on short-selling, 2008).
Disclosure and notification of short sale transactions
Other countries within the European Union have implemented short sale restrictions, although their actions are not so drastic as to prohibit. Spain, Belgium, Greece and the Netherlands have imposed requirements of stricter accounting for and disclosure of shorting (Measurements recently adopted by CESR members on short-selling, 2008). Spanish Comision Nacional del Mercado de Valores (CNMV) found it necessary to strengthen the public information on short positions. To achieve this CNMV now require persons who hold short positions over shares listed on Annex 1 (Spanish Banks & Financial stock index) to disclose any short position exceeding 0.25% of the listed stock’s total value. Such positions must be disclosed to CNMV and to the public, at the latest, the day after issue. The Netherlands and Belgium has the same rules, with the exception that the 0.25% rule applies to all shares. CBFA’s (the Belgian FSB) aims with their actions are to maintain a consistent regulatory framework among the financial markets and to avoid abusive arbitrage (Measurements recently adopted by CESR members on short-selling, 2008).
In Greece the Hellenic Capital Market Commission (HCMC) is the corresponding regulatory authority. Their measurements aims to protect the smooth function of the market in Greece and the core of their actions are similar to those in Spain and Belgium. Since September 22 and lasting over a period of three months, actors on the Athens Exchange must flag short sales as such when executing the relevant sale order. This must be done on a daily basis with a notification of total amount of short sales by share and the total number of shares by issuer that have been lent. Furthermore, a person that has a short
immediately notify the HCMC (Measurements recently adopted by CESR members on short-selling, 2008).
In addition to the Financial Services Authority’s (FSA) ban of short selling financial stocks in the UK, the FSA has issued a requirement for disclosure of all net short positions over 0.25% of the ordinary share capital of such companies the following work day. The requirement will last until January 16, 2009 (Measurements recently adopted by CESR members on short-selling, 2008).
3.3.2 The United States
It is not only in Europe that short selling has been accused of escalating market downturns, discussions have been similar in the US. On September 19, 2008 The Securities and Exchange Commission (SEC) banned short selling of 799 financial companies. The action was introduced with immediate effect and remained in effect until October 2, 2008. The SEC took this course of action in an attempt to restore equilibrium to the market. During normal market conditions they view shorting as a contributor to price efficiency and liquidity. Considering recent market events, however, short sales speculations might have facilitated a negative spiral and the SEC suspected that short selling was related to price declines in stocks of financial companies unrelated to true price valuation (SEC halts short selling of financial stocks to protect investors and markets, 2008)
The up-tick rule
A more permanent action was the Up-tick rule which were adopted during the aftermath of the great depression in 1934 (SEC, 2008). The rule has remained fundamentally unchanged since the adoption although there have been modifications in later years. The rule was introduced in a time when the financial crisis in the US was enormous, banks were going bankrupt and there was no confidence in the stock market at all. The Up-tick rule was adopted to restrict short selling in a declining market in order to avoid an out of control negative spiral (Young, 2008).
The SEC wanted to achieve three objectives by implementing the Up-tick rule; (1) to allow relatively unrestricted short selling in a developing market, (2) to eliminate the use of short selling as a tool for driving the market down, and (3) to prevent short sellers from accelerating a declining market by exhausting all bids at one price level, causing lower prices to be established by long sellers (SEC halts short selling of financial stocks to protect investors and markets, 2008).
Presently the up-tick is actually a former financial regulation since the rule was eliminated by SEC on July 6, 2007 (Young, 2008). They decided that short sales could be done regardless if the previous execution price of the trade was an up-tick or down-tick.
3.3.3 Asia
China and Japan are major economies which have faced a similar financial crisis in 2008 as the western countries, even though their approach to the alleged threat of short selling differs.
China
China’s Securities Regulatory Commission (SRC) has chosen a different way to turn the negative trend and stimulate the activity on the Chinese market. Contrary to measurements in the US, UK and other European countries, China has plans of approving short selling among financial companies instead of prohibiting it. Shorting has been strictly forbidden in China until now, although a pilot programme allowing short selling in 80 securities companies may be launched in December this year. The aim of the programme is to boost trading volume and investors’ confidence in order to restructure the Chinese share trading system (Freshfields, 2008). In other words, China’s aims are similar to western countries’ desires. However, the means of reaching the objects are, in many, cases the opposite.
Hong Kong
The global stock market crisis includes Hong Kong although the Securities and Futures Commission’s (SFC) regulations have remained at status quo. The regulations of short selling include the up-tick rule, although there are only a number of 504 securities that can be short-sold (Freshfields, 2008). Furthermore, Hong Kong’s Securities and Futures Ordinance require short sellers to confirm every sale on the securities that are permitted to be short sold. The only change that has been noted was when the SFC on September 26, 2008 decided to double penalties for failed settlement of shorting transactions (Freshfields, 2008).
Japan
In order to prevent the stock market from collapsing and strengthen investors’ confidence the Financial Services Agency (FSA) has acted to strengthen the restrictions on short selling of stocks. The following are the regulatory framework in Japan and it concerns all stocks listed on the Nikkei Stock market, and they have been extracted from the FSA press release from October 14, 2008. First of all, traders are required to notify and inform
whether the transactions they perform are short selling or not. Secondly, an up-tick requirement prohibiting short sales while prices are declining on the stock exchange exists. Finally, FSA requires traders to disclose information regarding short selling on a daily basis, earlier the requirements applied on a monthly basis (FSA strengthen restrictions on short selling, 2008).
3.4 Previous research
An often cited article is Edward M. Miller’s Risk, Uncertainty, and Divergence of Opinion from 1977, which is one of the early works on short selling. In the article Miller writes that short sales increase supply of the shorted stock. It does so in the same manner a bank creates money supply. A saver expects to be able to withdraw money from the bank at anytime, he or she do, however, not expect the bank to keep all its borrowed funds in the vault. Banks use a margin, just as a stock broker does with short positions. In general, a lender of a stock is not aware that his shares have been lent. The number of outstanding short shares is equal to the increased supply of that stock. Furthermore, an increase in supply implies a decrease in price, i.e. short sales lessen stock price. As a consequence, the price of a stock will be influenced by the presence of adverse opinions as it works as a red flag, increasing the number of pessimistic investors who, in turn, tend to go short and thus decrease the likelihood of a stock to reach high values.
Boehme, Danielsen and Sorescu (2005) finds that a stock suffering from heavy shorting constraints together with substantial differences in investors’ opinions, which are Miller’s (1977) two conditions for overvaluation, tends to have a price higher than its true value. However, they conclude that both conditions are necessary as companies with only one of the two do not seem to be overvalued, i.e. on its own, shorting restrictions will not lead to overvaluation.
Woolridge and Dickinson (1994) have analyzed the overall market data on companies traded on the New York Stock Exchange, the American Stock Exchange and Over the Counter markets during 1986-1991. According to their study, short sellers cannot be blamed for pushing the market down. Neither was there a difference between the three markets. They show that shorters do not earn abnormally high or low returns at the expense of other investors and that short selling increases during months of positive stock return and vice versa in negative months. In other words, shorting increases liquidity in up-going markets and shorting decreases in down markets.
Diamond and Verrechia (1987) could in their study not reject the hypothesis that short selling restrictions prohibits investors with negative information about a company to speculate in a decline in the stock price, resulting in reduced speed of price adjustment to private information. When constraints on short sales are applied, informed traders who do not own shares in the company cannot speculate in a stock decline, and thus, prices take longer to adjust to private information and have a relatively large impact on prices when it is revealed for the public, particularly bad news. This hypothesis was later confirmed, among others, by Reed (2007). In his study, quarterly earnings announcements were used as information events. These were considered private information until they were revealed to the public.
Furthermore, Diamond and Verrechia (1987) conclude that short selling contributes to price efficiency. While investors taking a long position assume that a security is undervalued and that the price will increase in the future, an investor who takes on a short position assumes the opposite. For a market to be efficient, both these views must be reflected in the price of a security. If restrictions of short selling are applied, the market will not be informed of the investors speculating in a decrease in security prices from such trades. Miller (1977) argued in a similar way; restricting pessimistic traders from short selling while optimistic traders are not restricted from buying leads to information asymmetry, hence inefficient price setting due to biased stock prices.
Bris et al. (2003) and Charoenrook and Daouk (2005) have in their studies analyzed if short sale restrictions can reduce the effect of price declines and consequently increased market stability. Bris et al. (2003) concluded that in markets where short selling is prohibited or not used, individual stock returns displayed significantly less negative skewness. However, they found signs that short sales restrictions do not lessen declines in the overall market performance as regulators tend to believe. Charoenrook and Daouk (2005) showed evidence from their sample of 111 countries that short sales improved the market quality leading to less movement in the aggregated market returns and greater liquidity. Their study showed no evidence that short sale restrictions would affect the probability of a market crash.
Charles M. Jones (2002) confirms that imposing a short sale restriction, in this case the uptick rule of 1938, will increase market prices as pessimists are left out to a greater extent. Confirming Diamond and Verrechia (1987), Jones (2002) finds that implementing
that contrary to previous research, the up-tick rule led to a considerable increase in liquidity together with a smaller bid-ask spread. As the up-tick rule was not a general ban it lead to subtle changes and investors adapted to the new conditions in a way that led to these surprising consequences. It is, furthermore, small stocks that are affected most, no matter if the particular restriction increases or decreases liquidity. Jones (2002) cannot give a conclusive explanation as to why.
4
Empirical findings and analysis
______________________________________________________________________
In this section the empirical findings are presented together with our analysis. Some analysis is embedded with empirical findings while a more extensive analysis follows thereafter.
______________________________________________________________________
4.1 Statistical analysis
Much of the previous research conducted treats the effects of short selling restrictions. In this study we have, however, taken a different approach, testing if a relationship between shorting and share price exists. As written earlier in the thesis, data concerning short selling was not to be found and therefore stock loan has been used as a proxy.
Figure 4-1 below shows how stock lending and the index for the investigated shares have changed during the first 45 weeks of 2008. The left hand side of the Y-axis represents number of shares lent while the right hand side represents the index OMXS30.
Figure 4-1. Stock lending and OMXS30
In statistical analysis, the research often state a hypothesis, H1, followed by another
plausible hypothesis, also known as the null hypothesis, H0. Since many countries have
implemented short selling restrictions lately and the value of companies listed on OMXS30 has decreased, while the number of lent shares has increased, our hypothesis is as follows: H1: Changes in stock price are influenced by changes in stock lending
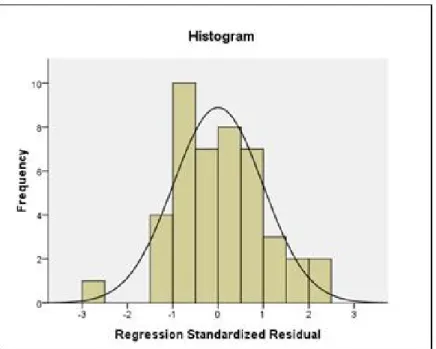
Two tests were conducted using the statistical tool SPSS and a compilation of the results for all individual shares, as well as the overall market are presented in Appendix 2 and 3. The two tests of interest were cross-correlation analysis and simple regression analysis. Since financial data was to be tested, we first had to adjust our raw data to measure the change over time. This was done in SPSS, by conducting a time series analysis. We also had to make sure that the data was normally distributed due to relatively few observation points. The histogram (figure 4-2) below shows the distribution of data concerning the overall market, although similar distribution was found for the individual shares. As can be seen in the histogram, we have a fairly normally distributed sample, enough to conduct a simple linear regression.
Figure 4-2. Normal distribution OMXS30
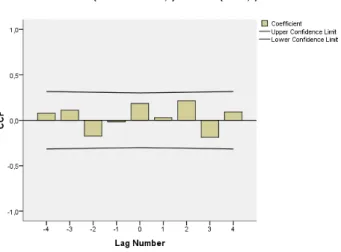
For the overall market (OMXS30), we find that there is a slightly positive correlation for the lags t-4, t-3, t-0, t+2 and t+4, while a negative correlation can be found for lags t-2, t-1 and t+2.
The correlation is, however, not strong enough to confirm that a relationship occurs since neither of the bars exceeds the upper or lower confidence limit as can be seen in figure 4-3. Also, the irregularity of the correlations coefficients indicates that the correlation for different lags seems to be random rather than explained by the model. Furthermore, the positive correlation coefficients that can be found for the majority of the lags would also indicate that when stock lending increase, share price moves in the same direction and vise versa.
Figure 4-3. Cross-correlation OMXS30
Since opponents of short selling claim that this type of activity drive share prices down, we performed a simple linear regression to analyse such a statement using share price as the dependent variable. This test advised us whether to confirm or reject the null hypothesis. The information from the regression model concerns the overall market and told us the strenght of the relationship between the two variables, share price and stock loan. Tests have also been perfomed on individual stocks and a general discussion of these results are presented later in this chapter.
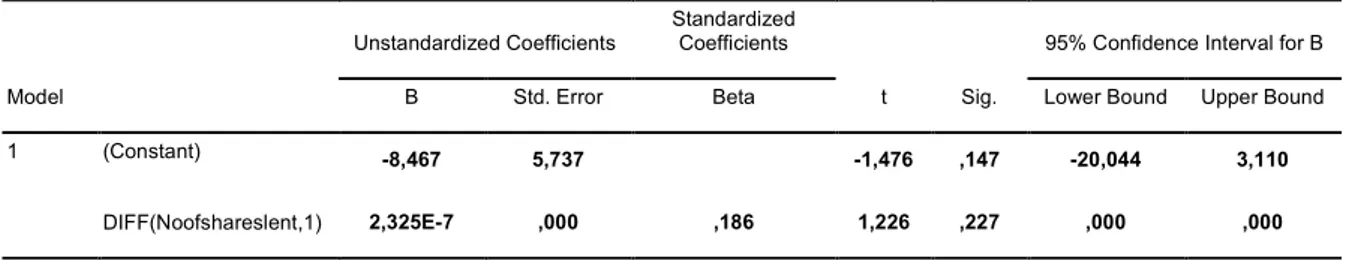
Table 4-1. Model Summary
Model Summary
Model R R Square Adjusted R Square
Std. Error of the Estimate
1 ,186a ,035 ,012 37,77811
a. Predictors: (Constant), DIFF(Noofshareslent,1)
From the model summary (table 4-1) we find that R is equal to the cross correlation coefficient for t0, with the only different that R always has a positive number, regardless if
the variables are positively or negatively correlated. In this case, R=correlation coefficient=0.186. R2 and adjusted R2 gives information of the goodness of fit of the model and as explained in the theoretical part, adjusted R2 is a better measurement due to the
small sample size. Since the adjusted R2 is 0.012, only 1.2% of the variation in share price can be explained by the independent variable stock loan. Our regression model is for this
reason inadequate at explaining the variances in share prices, hence variables other than stock loan are a more satisfactory in explaining share price movements.
To be able to accept or reject the null hypothesis we have to look at the p-value which can be found in table 4-2 below. Assuming a 95 percent confidence interval, we reject H0 if P ≤ 0.05. A P-value lower than 0.05 means that the relationship is reliable and can be used for prediction. For the overall market, the P-value is as high as 0.227 which means that the null hypothesis is true; changes in stock prices are not influenced by changes in stock lending.
Table 2-2 Statistical coefficients
Coefficientsa Model Unstandardized Coefficients Standardized Coefficients t Sig.
95% Confidence Interval for B B Std. Error Beta Lower Bound Upper Bound 1 (Constant) -8,467 5,737 -1,476 ,147 -20,044 3,110
DIFF(Noofshareslent,1) 2,325E-7 ,000 ,186 1,226 ,227 ,000 ,000
a. Dependent Variable: DIFF(Index,1)
Even though the market index has decreased during the investigated period, both the cross-correlation analysis and the simple linear regression model indicate that these changes cannot be explained by stock lending. We can from this result assume that hedge funds and investors using short selling as part of their investment strategies do not affect the overall market performance.
When looking at the correlation coefficients (Appendix 2) for the individual shares, all of the coefficients show similar irregularity as the overall market. Therefore we have to conclude that neither of the shares have a correlation strong enough to statistically secure that a relationship between the variables exists, even if the correlation coefficient for a limited number of shares have a value that slightly surpasses the upper or lower confidence limit for certain lags.
The simple linear regression analysis for the individual shares leads to similar reasoning. Neither of the shares have a P-value (Appendix 3) lower than 0.05 and we can therefore not reject the null hypothesis in any of the cases.
The discussion in Swedish media has mainly concerned a temporary ban of short selling in financial shares and when looking from an international perspective most of restrictions
Bank, SEB A, Svenska Handelsbanken A and Swedbank A are all classified as financial shares. Investor B and Nordea bank have P-values of 0.060 and 0.063 respectively which is close to 0.05-level for a 95 percent confidence interval. From the adjusted R2 values we
find that 6 percent of the change in share value of Investor B can be explained by changes in share loan while the same percentage for Nordea Bank is 5.8. This is considerably higher than for all of the other shares. However, since both 0.060 and 0.063 > 0.05, we cannot reject the null hypothesis. The relationship can just as well be explained by random errors. The irregularity of correlation coefficients for these shares helps us strengthen this conclusion. Also, neither of the other financial shares tends to show a similar relation and therefore, drawing conclusion that financial share are greater affected by shorting activity would be both futile and wrong.
4.2 Hedge fund’s perspective
We have conducted an interview with a hedge fund trader who, for company policy issues, has opted to remain anonymous. We do, however, insure that the person is working for a major Swedish hedge fund and has extensive knowledge within our topic. The interviewee will henceforth be referred to as John Doe. Note that John Doe stress that the following are his personal views as a trader and are not to be equalled to the hedge fund industry (J. Doe, personal communication, 2008-11-14).
According to John Doe (personal communication, 2008-11-14), the essential operation of hedge funds is to buy firms which they believe to be fundamentally undervalued while at the same time short firms appearing to be fundamentally overvalued. In that sense they do not use shorting for speculative purposes. Furthermore, he feels that the word speculation has been distorted to some extent in these situations. Hedge funds may use shorting in ways that could be labelled as speculation, the significant difference being that hedgers use strict risk management methods whereas speculation in the common sense involves high risk taking. The interviewee’s statements strengthen the picture of hedge funds as rational firms. Hedging, Ek and Petersson’s (1994) second incentive for shorting, is not a danger to the market, even shorting opponents such as Richard Forslid (2008) often point out that rational trade using short sales is healthy for the market.
When confronted with the second question regarding how a shorting ban similar to the ones in the US and several other countries would affect his business our interviewee says the questions should be turned around; what effects is one striving after by implementing a
short sales ban? The answer being to decrease systemic risk on the financial market, which has not been realized according to John Doe (personal communication, 2008-11-14). Reformulating the question as our interviewee gave us a new dimension to the restriction perspective of short selling. Decreasing the risk connected with the entire market has not been achieved in the countries we have observed which all banned short selling. In the long term the interviewee states that shorting has a stabilizing effect on share prices and systemic risk as conducting short sales will decrease the risk of asset bubbles (J. Doe, personal communication, 2008-11-14). If an investor sees an asset as overpriced without having options to express his opinions by using tools like short selling the authors believe it is a reasonable assumption that such a situation might contribute to the emergence of asset bubbles.
The effect of the US prohibition of 2008 was that long-short equity funds had to remove not only their short positions, but also their long positions as a result of how they are constructed according to John Doe. What subsequently happened after the ban was that the market rose during a few days to subsequently hit new lows as the long positions were removed in unison with market believes of truly poor profit prospect of financial companies. In the event of a permanent shorting prohibition, John Doe sees a real risk that long-short equity funds would have to go out of business which would significantly decrease liquidity in the market (J. Doe, personal communication, 2008-11-14). John Doe’s answer hints at the possibility that a shorting ban might be introduced in order to silence angry voices or to get the market to rice a few points short-term instead of seeking equilibrium for the market, as were the reason stated by SEC. Furthermore, an introduction of an up-tick rule in Sweden would be met with marginally negative attitudes according to our interviewee. He feels that there was a reason that SEC removed the rule, which were that it had no significant effect (J. Doe, personal communication, 2008-11-14). The authors find it interesting that the rule, which were successfully introduced to prevent bear raids during the great depression, was removed only a year before the temporary ban came into effect to prevent manipulation of financial shares. Charles M. Jones (2002) even found that the up-tick rule increases liquidity and decrease bid-ask spread. The prohibition might not have been necessary had the up-tick still been in effect. P. Chapman (2008) writes in an article that SEC is considering a reintroduction of the up-tick which appears to be a relatively sound move as the up-tick seems to be one of the few, if not the only, restrictions that actually has some benefits.