Dworshak Dam-Storage Optimization: Improving power Generation
with Historic and Climate Change Hydrology
Jeremy Giovando1 and Andre Dozier2
Department of Civil and Environmental Engineering, Colorado State University
Abstract. As U.S. energy consumption continues to increase and construction of new infrastructure is costly and becoming more difficult, therefore new methods must be evaluated in order to
maximize energy production from current infrastructure. Dynamic programming (DP) has proven to be useful in updating operational policies for improved power generation while still meeting other operational constraints. In this analysis, a generalized dynamic programming model, CSUDP, was utilized to evaluate energy production due to monthly operations at Dworshak Dam in north central Idaho. Based on both historic and climate change hydrologic input data the results of the DP modeling indicates that energy production can be increased up to 10 percent from the observed generation while still meeting other project purposes. In addition, operations at Dworshak Dam were evaluated with expanded generation capacity. Modeling with expanded generation capacity showed a substantial increase in energy production and predicted a beneficial balancing of
particular climate varying streamflow predictions. Even though benefits of dynamic programming have been shown to improve power generation from current infrastructure at minimal cost, actual operations may not change for years or at all because doing so will require a paradigm shift for many reservoir managers.
1. Introduction
Demands for the energy in the United States will continue to increase as growth in population continues based on projections by the U.S. Energy Information Administration. The two obvious methods for responding to energy consumption needs are new energy producing infrastructure and increasing the energy output from current sources. Since new energy sources often take many years and a lot of money to develop, a relatively
inexpensive and short-term solution is to use current infrastructure to serve increasing demands by either uprating current power capacity or finding new operational methods that allow for increased energy production. Since uprating of power facilities is generally expensive too, the most cost effect solution is modifying the current operational policies to maximize generation. One of the methods that can be used to maximize generation is optimization of operations. One highly effective optimization technique, commonly referred to as dynamic programming (DP) was developed in the late 1970s by Richard Bellman.
Hydropower is the largest renewable energy source in the U.S. One of the largest hydropower systems in the US is located in the Columbia River Basin and generates about 60-70% of the total electrical energy produced in the region. Installed capacity of the Federal Columbia River Power System (FCRPS) is approximately 22,000 MW, while the total capacity is even more if considering private, public utility districts, Canadian and
1jgiovando@hotmail.com 2hambre@engr.colostate.edu
168
other hydropower facilities (FCRPS Agencies, 2001). However due to the complexity of establishing a DP model for the entire FCRPS, a single project was chosen to demonstrate the potential benefit of using DP to modifying operational policies for hydroelectric projects in the region.
In this case study, Dworshak Dam in north central Idaho is evaluated using DP. Optimized operational policies are compared with current methods to determine a net benefit. Dworshak Dam is a multipurpose project, satisfying energy demands as well as flow augmentation for anadromous species and reservoir recreation. Operations today are more constrained than the original planners envisioned due to anadromous endangered species. Therefore, to sustain and improve the energy production benefits by this facility, reservoir management tools called Decision Support Systems are needed to help managers optimize operations.
2. Project Objective
The goal of this analysis is to use dynamic programming (DP) to infer optimal storage targets for maximum energy production in view of historic and climate change hydrology while still satisfying flood control and critical storage targets as well as flow augmentation for endangered species. A second goal was to evaluate the benefit to energy generation given expanded power capacity at Dworshak Dam.
3. Basin Information
3.1 Clearwater River
The Clearwater River at Spalding, Idaho has a total drainage area of approximately 9,570 square miles. It is located in north central Idaho and is a major tributary to the Snake River, which is a principal branch of the Columbia River (Figure 1). Elevations in the Clearwater River Basin range from about 750 to 9,000 feet msl, with a median
elevation of 4,500 feet msl. Principal streams within the Clearwater River Basin generally flow in a westerly direction. The North Fork of the Clearwater River joins the main stem of the Clearwater downstream of Orofino and enters the Snake River near Lewiston, Idaho. This location is considered a significant flood control point for the operations of Dworshak Dam to reduce flood impacts at Lewiston and through the Lower Snake River.
3.2 Dworshak Dam
Dworshak Dam is located at river mile 1.9 on the North Fork Clearwater River and its headwaters drain an area of approximately 2,440 mi2. This makes the North Fork one of the largest tributary basins to the Clearwater River.
Dworshak Dam is a straight concrete-gravity structure which has a maximum structural height of 717 feet, a hydraulic height of 632 feet, and a crest length of 3,287 feet. Design capacity of the two spillway gates at full pool elevation 1,600 feet is 157,000 cubic feet per second (cfs) at the full-open position (USACE, 1986). The combined spillway and outlet capacities at maximum design pool meet the requirement for passing the regulated probable maximum flood of 220,000 cfs. Regulating outlet or river outlet capacity at maximum design pool (1,605 feet) is 40,000 cfs. There are currently 3 units installed at Dworshak Dam with a total nameplate capacity of 400 MW, which includes two 90-MW
generating units and one 220-MW generating unit with three additional expansion bays. The other pertinent elevation and storage data is shown in Figure 2 below.
Figure 1. Columbia River Basin
170
4. Methodology
Improving power generation from Dworshak dam consisted of setting up DP
optimization using generalized DP software called CSUDP, calibrating the optimization model using historical data and perfect forecasts, running the optimization model for all datasets (historical and climate change), and implicitly inferring optimal storage policies based on April through July inflow for each month and climate change scenario. Analyzing extra generation capacity consisted of running each scenario through the optimization model with an expanded generation capacity at Dworshak Dam.
4.1 Dynamic Programming Model Description
CSUDP v2.44 was developed at Colorado State University, and was a useful tool in setting up the DP optimization model. The model was set up to solve a single dimension optimization problem based on a monthly timestep. The inverse state dynamics equation was used. Therefore the release precision was set small (0.001) since this would not impact computation time. Splicing was used with the analysis, the initial increment was 25 kaf and the final increment was set to 1 kaf precision. A summary of the model parameters is listed below.
4.2 Assumptions
The primary assumption for this model was the reservoir targets specified in the 2008 Federal Columbia River System Biological Opinion (NOAA, 2008) would have to be met. Flexibility from the current rule curves was allowed, specifically the variable rule curve to determine flood control elevation from January through April. If targets specified in the biological opinion were to be changed, biological constraints, objectives, or models would have to be directly included in the optimization study.
Monthly data was used because of the practical application of these results. Elevation targets for the reservoir are generally determined on a month-to-month basis during the January through April forecast season. Therefore, in order to provide reservoir managers with a tool to set elevation targets, at least a monthly timestep was necessary. Daily data is available for the all the datasets if a shorter time increment, for example bi-weekly, would be useful to reservoir managers.
Another assumption with this analysis is that the expanded generation would be limited to the capacity with another 220-MW unit. This is primarily because the cost of
installation is nearly the same for units with a small generation capacity; therefore, the increased benefits with the large unit would be the best benefit-to-cost ratio. Although the nameplate capacity is 220-MW the maximum generation for this type of unit configuration is approximately 250-MW. General Properties DP Method Maximize/Additive State Dimension/stages 1/12
State Equation Inverted/Deterministic Solution Options Backward
Running Properties
Initial Value Min Value Max Value Splicing (Initial/Final) 25/1
Storage (xin) [kaf] 2400 1452 3569 Release (ucon) [kcfs] 1 0 225000
A final significant assumption in this analysis is that inflow between April and July can be precisely forecasted (“perfect forecasting”). Assuming perfect forecasts allows
optimization over a year given a certain quantity of inflow. Forecasting is a valid
assumption within snowmelt driven basins because snow depth and snow-covered area, in contrast with future rainfall amount, are more readily measureable and correlated with runoff. Forecasting techniques and improvisations are a separate analysis, but could also significantly improve generating capabilities at Dworshak.
4.3 Data Acquisition
There were three principle sets of data that were analyzed. First the historical data was obtained from the US Army Corps of Engineers Dataquery website (Dataquery, 2010). The website has daily data available which we then combined into monthly volumes of 1,000 acre-feet (kaf) for CSUDP input. From the database an inflow dataset for Dworshak Dam was compiled for the period 1975-2009. A longer historic dataset
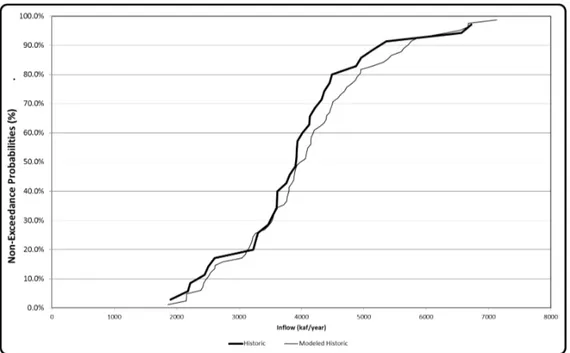
(“Historic-extended dataset”) that has inflows pre-dating the project was also used. The period of this dataset is 1928-2009 and was provided by the Corps of Engineer-Walla Walla District. To illustrate the differences in the datasets, a cumulative density function (CDF) plot is shown in Figure 3 for the Historic and Historic-extended datasets.
A snowmelt-runoff model developed by CSU generated the second dataset, which represented the hydrologic changes that might occur in the North Fork Clearwater River Basin given various mean annual temperature changes. The range of mean annual
temperature change is -5 oC to +5 oC. For each mean annual temperature, an ensemble of 50 tracks each with 32 years of inflow data were produced by the snowmelt-runoff model. As an example of the differences in the model outputs, average monthly hydrographs are displayed in Figure 4.
The final hydrologic dataset was produced by the Variable Infiltration Capacity Model (VIC) at the University of Washington. VIC data used several general circulation model (GCM) outputs3 for temperature and precipitation to produce various hydrologic flow sequences. Although there were about 10 other downscaled GCMs that were used by the VIC model to predict inflows, only one was selected for this optimization analysis.
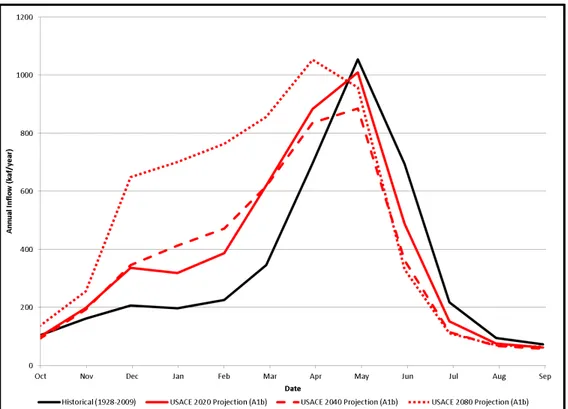
Additionally, there were two carbon emissions scenarios that used GCM output to produce potential varying streamflows: “A1b” and “B1.” The A1b scenario considers a large increase in carbon emissions, while the B1 scenario assumes carbon emissions are curtailed over the next century (CIG, 2010). Predicted average monthly inflow
hydrographs for each USACE scenario projected to 2020, 2040, and 2080 are depicted in Figure 5 and Figure 6 below.
Expected annual distribution of inflows is displayed in additional figures in the Appendix for each selected climate change scenario. Interestingly, the overall trend for USACE data is for inflows to increase, but for CSU data to decrease (with increasing temperature).
3 The USACE data used in this project are streamflow output from one downscaled GCM. USACE is currently evaluating about 10 other downscaled GCMs.
172
Figure 3. Dworshak Reservoir Annual Inflow Based on Historical Hydrology including Extended Dataset (1928-2009)
Figure 5. Dworshak Reservoir Average Inflow Hydrograph using USACE A1b Climate Change Predictions
Figure 6. Dworshak Reservoir Average Inflow Hydrograph using USACE B1 Climate Change Predictions
174 4.4 Current Rule Curves
The US Army Corps of Engineers operates Dworshak Dam for flood control in winter and early spring based on storage rule curves derived from volumetric April through July inflow forecasts. Figure 7 below shows the combined annual rule curve which guides the monthly storage operations of the project.
The winter and early spring operations are based on the variable rule curve. The monthly targets derived from these curves are a function of the water supply forecast. In the early 1990s the variable portion of this curve was modified slightly to include two flood control objectives. Figure 8 is the local flood control curve which provides flood protection primarily for Lewiston, ID. Figure 9 was developed to coordinate flood control for the reservoir system in the entire Columbia River Basin. In calibrated the DP model, current local flood control rule curves were used, since Dworshak is the only reservoir in the system being modeled.
The current procedure for setting storage targets is to use a single statistical forecast value for the seasonal water supply at the beginning of each month starting in January. For the optimization of storage rules, though, perfect forecasts were used so that optimal policies are based on a certain amount of inflow. Evaluation of forecasting technique and accuracy should be a separate analysis, although results of this study show that improved forecasting techniques will significantly improve energy generation.
Figure 7. Dworshak Dam Annual Rule Curve
Figure 7: Dworshak Dam Annual Rule Curve
Figure 8: Dworshak Dam Local Flood Control variable rule curve
Only 3 Targets were used during optimization
Figure 8. Dworshak Dam Local Flood Control variable rule curve
176
5. Model Results
Output data from CSUDP for each input year was placed into inflow classes based on the April through July volume. Increments of inflow classes were 200 kaf, however the overall range of inflow classes varied between the historic and the climate change output data. As an example the historic data was separated into inflow classes ranging from 1400 to 4800 kaf, but the CSU climate change dataset with a mean temperature shift of positive five degrees Celsius had inflow classes ranging from 400 to 1800 kaf.
A graphical user interface (GUI) was set up within Microsoft Excel for quick display of final results as well as for running more climate change scenarios. The GUI was temporarily copied to a location on the T drive:
T:\projects\coarkriver\csudpfiles\Dworshak_GUI_v10-CCRuns.xlsm. 5.1 Historic Hydrology (current generation capacity)
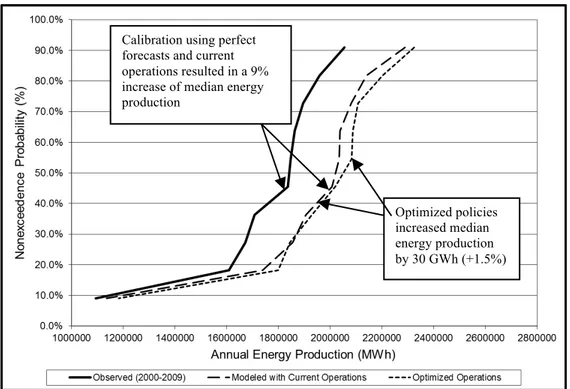
Calibration of the historic data in CSUDP was difficult since those operations were based on management decisions from forecasted data, and the CSUDP model used perfect forecasts. Calibrating the CSUDP model consisted of running a historic inflow dataset (1975 to 2009) through CSUDP with storage targets set each month using current local flood control rule curves. Since perfect forecasts were used in calibration, the modeled generation is about 9% (178 GWh) greater the observed energy production, which shows that evaluating improved forecasting techniques will significantly benefit power
production. An analysis was performed to show the benefits when optimizing operations over the historical set of inflows. Such optimization was accomplished by keeping only the essential storage targets throughout the year and allowing CSUDP flexibility from current operations during all other months.
5.1.1 Storage
Storage rules were implicitly defined using correlation between current storage and optimal next period storage. Figure 10 displays comparison between current policies and optimized policies for the 2800 kaf inflow class and the month of February. Trendlines theoretically represent optimal next period storage given a particular initial storage for the period and inflow forecast. Inflow classes signify expected inflow volumes from April to July.
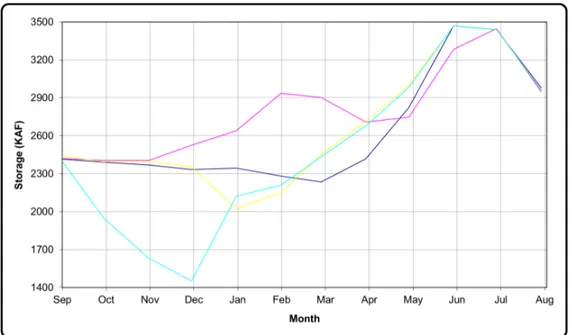
Optimized storage values for all years with inflows in the 2800 kaf inflow class are shown in Figure 11. Optimized storage values indicate releasing less water during the winter to increase storage resulting in higher releases, and consequently power production, during the spring and summer, while still meeting the refill target at the end of June.
5.1.2 Generation & Releases
Even though the historic operations could not be calibrated well, optimization of Dworshak operations showed a measurable increase in overall generation from calibrated model results. Optimized operations improved median annual energy production by 30 GWh (a 1.5% increase) compared to energy generation output from the calibrated CSUDP model, as seen in Figure 12. When drought conditions exist the optimized generation converges to be approximately equal to the observed generation due to minimal storage flexibility. In contrast, the increase in generation for inflows above the 80 percent non-exceedance is significant when compared to the observed. Higher inflows allow more flexibility in operations to optimize generation while meeting other conflicting constraints.
Figure 10. Comparison of the historic inflow using the current rule curves vs. fully optimized in CSUDP
Figure 11. Average Monthly storage for 2800 kaf inflow class
Figure 10: Comparison of the historic inflow using the current rule curves vs. fully optimized in CSUDP
Figure 11: Average Monthly storage for 2800 kaf inflow class Current policy
Giovando and Dozier
178
Figure 12. Annual Energy Production Distribution with Historic Hydrology 5.2 Climate Change Hydrology (current generation capacity)
Determining how water management policies will need to be modified for any future change in hydrology is difficult. Using a generalized optimization program like CSUDP demonstrates how power benefits can still be optimized even in significantly different hydrologic flow regimes. Projected inflow datasets from CSU and USACE showed the sensitivity of streamflow to climate change, which are then used to determine potential impacts on optimal power generation.
5.2.1 Storage
Optimal policies are derived from a linear fit of initial storage plotted against optimal final storage as shown in Figure 13. There were a total of 4 out of 90 years in the USACE A1b inflow file, which were in the 2800 kaf inflow class. Average optimal monthly
storage volumes are plotted in Figure 14. Variability of optimal operational rules is largely dependent on the correlated months as well as in the inflow class. Similar plots for the CSU +02 data are shown in Figure 15 and Figure 16 for the same inflow class. Figure 17, Figure 18, and Figure 19 display average optimal monthly storage targets based on all CSU climate change datasets and select USACE climate change projections (A1b and B1) for 2020, 2040, and 2080.
optimization of Dworshak operations showed a measurable increase in overall generation from calibrated model results. Optimized operations improved median annual energy production by 30 GWh (a 1.5% increase) compared to energy generation output from the calibrated CSUDP model, as seen in Figure 12. When drought conditions exist the optimized generation converges to be approximately equal to the observed generation due to minimal storage flexibility. In contrast, the increase in generation for inflows above the 80 percent non-exceedance is significant when compared to the observed. Higher inflows allow more flexibility in operations to optimize generation while meeting other conflicting constraints.
Figure 12: Annual Energy Production Distribution with Historic Hydrology Calibration using perfect
forecasts and current operations resulted in a 9% increase of median energy production
Optimized policies increased median energy production by 30 GWh (+1.5%)
Figure 13. Storage Relationship for USACE 2040 (A1b) Projection and 2800 kaf Inflow Class
Figure 14. Optimized Monthly Storage Volumes for USACE 2040 (A1b) Projection and 2800 kaf Inflow Class
180
Figure 15. Storage Relationship for CSU +2 Degrees Celsius Projection and 2800 kaf Inflow Class
Figure 16. Optimized Monthly Storage Volumes for CSU +2 Degrees Celsius Projection and 2800 kaf Inflow Class
Figure 17. Optimized Average Monthly Storage Volumes for all CSU Climate Change Scenarios
Figure 18. Optimized Average Monthly Storage Volumes for the USACE A1b Climate Change Scenario
Figure 17: Optimized Average Monthly Storage Volumes for all CSU Climate Change Scenarios
Figure 18: Optimized Average Monthly Storage Volumes for the USACE A1b Climate Change Scenario Minimum Pool (1450 kaf)
Minimum Pool (1450 kaf)
Figure 17: Optimized Average Monthly Storage Volumes for all CSU Climate Change Scenarios
Figure 18: Optimized Average Monthly Storage Volumes for the USACE A1b Climate Change Scenario Minimum Pool (1450 kaf)
182
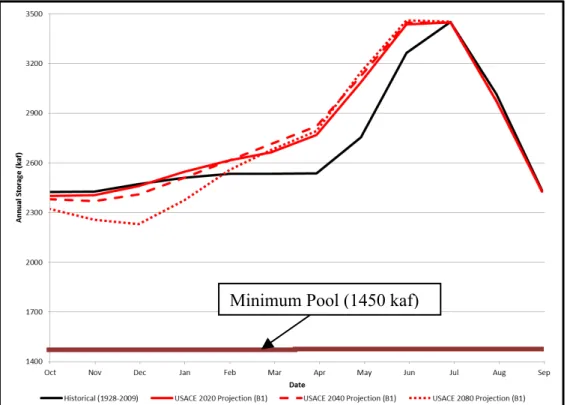
Figure 19. Optimized Average Monthly Storage Volumes for the USACE B1 Climate Change Scenario
5.2.2 Generation & Releases
Figure 20 shows the monthly distribution of energy production based on select climate change scenarios. Most GCMs estimate an increase of 2 degrees Celsius by 2040; therefore, the +2 oC CSU climate change dataset is compared to the USACE 2040 projection of the A1b scenario. Optimized release distributions are bimodal in that they are generally grouped at the lower and upper discharge range for the current unit configuration at
Dworshak Dam. In contrast, historic release have much more discharge between the upper and lower ranges.
Figure 21, Figure 22, Figure 23, Figure 24, Figure 25, and Figure 26 all display optimal energy production with either an annual distribution or an average monthly production. The CSU data indicates total annual generation will likely decrease with an increase in mean annual temperature, but an increase with a decrease in mean annual temperature, until a tipping point. So, for CSUs +5 oC scenario, even though there is more annual inflow there is generally less energy production because the inflows come right at the time of reservoir drafting, causing excess water to be routed through the spillway. USACE scenarios predict that energy production will increase by 2040 and 2080 due to climate change because inflows come at greater magnitudes earlier in the spring.
Figure 19: Optimized Average Monthly Storage Volumes for the USACE B1 Climate Change Scenario J.6.6&O%*%1"+5'*&P&?%$%",%,&
Figure 20 shows the monthly distribution of energy production based on select climate change scenarios. Most GCMs estimate an increase of 2 degrees
Celsius by 2040; therefore, the +2 oC CSU climate change dataset is compared to
the USACE 2040 projection of the A1b scenario. Optimized release distributions are bimodal in that they are generally grouped at the lower and upper discharge range for the current unit configuration at Dworshak Dam. In contrast, historic release have much more discharge between the upper and lower ranges.
Figure 21, Figure 22, Figure 23, Figure 24, Figure 25, and Figure 26 all display optimal energy production with either an annual distribution or an average monthly production. The CSU data indicates total annual generation will likely decrease with an increase in mean annual temperature, but an increase with a
decrease in mean annual temperature, until a tipping point. So, for CSUs +5 oC
scenario, even though there is more annual inflow there is generally less energy production because the inflows come right at the time of reservoir drafting,
causing excess water to be routed through the spillway. USACE scenarios predict that energy production will increase by 2040 and 2080 due to climate change because inflows come at greater magnitudes earlier in the spring.
Figure 20. Monthly Energy Production Distribution Based on CSU +2 Deg. Celsius and USACE 2040 A1b Climate Change Projections
184
Figure 22. Average Monthly Energy Production Based on CSU Climate Varying Scenarios
Figure 24. Average Monthly Energy Production Based on USACE A1b Climate Varying Scenario
186
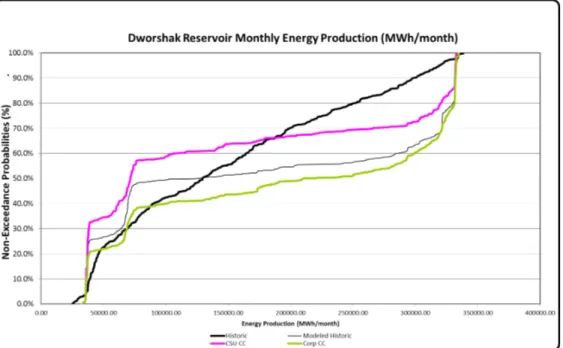
Figure 26. Average Monthly Energy Production Based on USACE B1 Climate Varying Scenario
Figure 27. Annual Energy Distribution with Historic Hydrology and an Extra Large Turbine Unit 26 Giovando & Dozier
1 & 2 Civil and Environmental Engineering
Colorado State University Fort Collins, CO 80523-1372
jgiovando@hotmail.com1& hambre@engr.colostate.edu 2
J.;&K5,+'154&KF21'$'EF&L%QG"*2%2&E%*%1"+5'*&4"G"45+FM&
Benefits of expanding powerplant capacity at Dworshak were quantified by optimizing operations with an additional 220-MW unit. Results indicated that median annual energy production, as compared to historically modeled generation without additional generation capacity, could be increased by at least 47 GWh as shown in Figure 27. Optimized policies with expanded generation showed an increase of 115 GWh. An increase in energy production is obviously larger during wetter years and nominal during droughts as discussed in Section 5.1.
Figure 27: Annual Energy Distribution with Historic Hydrology and an Extra Large Turbine Unit Modeling current operations
with the extra turbine unit increased median energy production by 47 GWh (+2.3%)
Optimized policies with the extra turbine unit increased median energy production by 115 GWh (+5.7%)
187
5.3 Historic Hydrology (expanded generation capacity)
Benefits of expanding powerplant capacity at Dworshak were quantified by optimizing operations with an additional 220-MW unit. Results indicated that median annual energy production, as compared to historically modeled generation without additional generation capacity, could be increased by at least 47 GWh as shown in Figure 27. Optimized
policies with expanded generation showed an increase of 115 GWh. An increase in energy production is obviously larger during wetter years and nominal during droughts as
discussed in Section 5.1.
5.3 Climate Change Hydrology (expanded generation capacity)
Expanded generation capacity was analyzed for benefits that it provides due to climate change. During high flow months, expanded generation significantly increases power capacity and generation as shown in Figure 28. Therefore, additional generation capacity would be extremely useful for peaking power demands. Also, expanded generation capacity was shown to provides a significant increase in annual energy production as shown in Figure 29, Figure 30, and Figure 31 for both historical and climate change hydrology. However, Figure 29 illustrates that, for many of the realistic CSU climate change scenarios – ones modeled using an increasing mean temperature, increased generation capacity would not be utilized since annual inflow volume is significantly less than historic. Only in high runoff years would expanded generation be used. Therefore the overall impact of the additional unit would be minimal for higher temperature scenarios if CSU predictions are accurate.
Figure 28. Monthly Energy Production Distribution Based on CSU +2 Deg. Celsius and USACE 2040 A1b Climate Change Projections with Extra Generating Capacity
28 Giovando & Dozier
1 & 2 Civil and Environmental Engineering
Colorado State University
Figure 28: Monthly Energy Production Distribution Based on CSU +2 Deg. Celsius and USACE 2040 A1b Climate Change Projections with Extra Generating Capacity
An increase of 220 GWh (+67%) during high production months
188
Figure 29. Annual Energy Production Distribution Based on CSU Climate Varying Scenarios
Figure 30. Annual Energy Production Distribution Based on USACE A1b Climate Varying Scenario Figure 29: Annual Energy Production Distribution Based on CSU Climate Varying Scenarios
An increase of 128 GWh (+6%) in median annual energy production
Figure 31. Annual Energy Production Distribution Based on USACE B1 Climate Varying Scenario
6. Discussion and Conclusions
Optimization of operations at Dworshak dam has shown to significantly improve potential annual energy production while still meeting other criteria including flood control and endangered species flow augmentation. It would be interesting to run the CSUDP model on a bi-weekly timestep to determine if further increases to energy production are possible. Benefits of expanding power capacity at Dworshak could be large if flows continue to remain as large as historical flows or follow the pattern that USACE projected. The primary issue, therefore, becomes the accuracy in climate change predictions, since both CSU and USACE datasets were quite different.
Further model development is required to provide a real-time decision support system, but the model is currently set up to optimize operations for any given number of flow sequences at a monthly scale. Due to the relative limited use of DP in the current
operational methods and unfamiliarity with optimization techniques, supplemental analysis to quantify risks of extreme storm events will likely be required before rule curves will be modified.
Additionally, implicit relationships of optimal policies were not well correlated when divided only into inflow classes. In order to improve interpolation of optimal policies, either regimes need to include more information such as previous inflow, or more sophisticated interpolation approaches need to be assessed, such as Artificial Neural Networks. Also, optimal policies can be determined explicitly using Explicit Stochastic Dynamic Programming or Q-learning which may prove to be a more beneficial analysis.
Future studies in the entire FCRPS would be useful in order to determine how to conjunctively maximize energy generation through integrated control of all major
190
reservoirs in the basins. The potential change in generation would be much greater when considering the installed power capacity of major projects in the FCRPS.
References
Climate Impacts Group (CIG), University of Washington, 2010, http://www.hydro.washington.edu/2860/ Dataquery Database, US Army Corps of Engineers, 2010,
http://www.nwd-wc.usace.army.mil/perl/dataquery.pl
FCRPS Biological Opinion, NOAA, May 2008 https://pcts.nmfs.noaa.gov/pls/pcts-pub/pcts_upload.summary_list_biop?p_id=27149
The Columbia River System Inside Story; Agencies of FEDERAL COLUMBIA RIVER POWER SYSTEM (FCRPS), April 2001
U.S. Energy Information Administration, http://www.eia.doe.gov/
Water Control Manual-Dworshak Dam, US Army Corps of Engineers, 1986
Columbia River Basin, U.S. Army Corps of Engineers (USACE), Northwestern Division, 2003,
Appendix – Additional Figures
Figure 32. Dworshak Reservoir Annual Inflow Distribution based on CSU Climate Change Scenarios
Figure 33. Dworshak Reservoir Annual Inflow Distribution based on USACE A1b Climate Change Scenario
192