JHEP12(2018)010
Published for SISSA by SpringerReceived: October 12, 2018 Revised: November 15, 2018 Accepted: November 20, 2018 Published: December 3, 2018
Measurement of the Zγ → ν ¯
νγ production cross
section in pp collisions at
√
s = 13 TeV with the
ATLAS detector and limits on anomalous triple
gauge-boson couplings
The ATLAS collaboration
E-mail:
atlas.publications@cern.ch
Abstract: The production of Z bosons in association with a high-energy photon (Zγ
production) is studied in the neutrino decay channel of the Z boson using pp collisions at
√
s = 13 TeV. The analysis uses a data sample with an integrated luminosity of 36.1 fb
−1collected by the ATLAS detector at the LHC in 2015 and 2016. Candidate Zγ events with
invisible decays of the Z boson are selected by requiring significant transverse momentum
(p
T) of the dineutrino system in conjunction with a single isolated photon with large
transverse energy (E
T). The rate of Zγ production is measured as a function of photon
E
T, dineutrino system p
Tand jet multiplicity. Evidence of anomalous triple gauge-boson
couplings is sought in Zγ production with photon E
Tgreater than 600 GeV. No excess
is observed relative to the Standard Model expectation, and upper limits are set on the
strength of ZZγ and Zγγ couplings.
Keywords: Hadron-Hadron scattering (experiments)
JHEP12(2018)010
Contents
1
Introduction
1
2
ATLAS detector and data samples
3
2.1
ATLAS detector and experimental data set
3
2.2
Simulation of signal and backgrounds
4
3
Selection of Z(ν ¯
ν)γ events
4
3.1
Object selection
5
3.2
Signal region definition
6
4
Background estimation
7
5
Integrated and differential cross sections
10
5.1
Description of the cross-section measurements
10
5.2
Systematic uncertainties
11
5.3
Integrated extended fiducial cross section
12
5.4
Standard Model calculations
14
5.5
Differential extended fiducial cross section
15
6
Limits on triple gauge-boson couplings
16
7
Conclusion
20
The ATLAS collaboration
25
1
Introduction
The production of a Z boson in association with a photon in proton-proton (pp) collisions
has been studied at the Large Hadron Collider (LHC) since the beginning of its operation
in 2010 [
1
–
5
]. These studies have been used to test the electroweak sector of the Standard
Model (SM) and to search for new physics effects, such as potential couplings of Z bosons
to photons. Previous publications from experiments at LEP [
6
–
10
] and the Tevatron [
11
–
13
] have shown no evidence for anomalous properties of neutral gauge bosons at the LHC.
The set of data from the second period of the LHC operation provides the opportunity for
more accurate measurements of the diboson production rate in pp collisions, and facilitates
higher-precision tests of triple gauge-boson couplings (TGCs).
This paper presents a measurement of Zγ production with the Z boson decaying
into neutrinos. The analysis uses 36.1 fb
−1of pp collision data collected with the ATLAS
JHEP12(2018)010
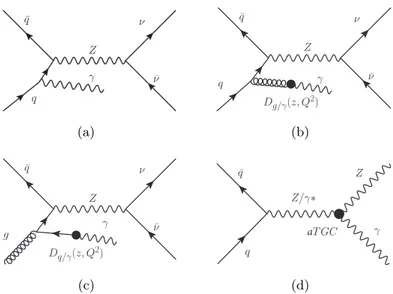
(a) q ¯ q Z γ ν ¯ ν Dg/γ(z, Q2) (b) g ¯ q Z γ ν ¯ ν Dq/γ(z, Q2) (c) q ¯ q Z/γ∗ aT GC γ Z (d)Figure 1. Feynman diagrams of Z(ν ¯ν)γ production: (a) initial-state photon radiation (ISR); (b,c) contributions from the Z + q(g) processes in which a photon emerges from the fragmentation of a quark or a gluon; and (d) an aTGC vertex.
detector
1at the LHC, operating at a centre-of-mass energy of 13 TeV. The measurements
are made both with no restriction on the system recoiling against the Zγ pair (inclusive
events) and by requiring that no jets with
|η| < 4.5 and p
T> 50 GeV (exclusive events)
are present in addition to the Zγ pair.
The ν ¯
νγ final state in the SM can be produced by a Z boson decaying into neutrinos
in association with photon emission from initial-state quarks or from quark/gluon
frag-mentation. These processes are illustrated by the leading-order Feynman diagrams shown
in figures
1
(a)–(c). An example of an anomalous triple gauge-boson coupling (aTGC) of
Z bosons and photons is shown in figure
1
(d). Such couplings are forbidden at tree level
in the SM but can arise in theories that extend the SM [
14
,
15
].
A study of the Z(ν ¯
ν)γ process has several advantages over processes with Z decay into
hadrons or charged leptons. The channel with hadrons in the final state is contaminated
by a large multijet background. A higher Z boson branching ratio into neutrinos relative
to that into charged leptons provides an opportunity to study the Zγ production in a more
energetic (higher E
Tγ) region, where the sensitivity of this process to bosonic couplings is
higher [
5
,
16
]. In addition, the neutrino channel is sensitive to anomalous neutrino dipole
moments, although a higher integrated luminosity than that available to this study would
be required to significantly improve upon LEP results [
17
,
18
].
The measurements of the rate and kinematic properties of the Zγ production from
this study are compared with SM predictions obtained from two higher-order perturbative
1
ATLAS uses a right-handed coordinate system with its origin at the nominal interaction point (IP) in the centre of the detector and the z-axis along the beam pipe. The x-axis points from the IP to the centre of the LHC ring, and the y-axis points upward. Cylindrical coordinates (r, φ) are used in the transverse plane, φ being the azimuthal angle around the z-axis. The pseudorapidity is defined in terms of the polar angle θ as η = − ln tan(θ/2). The angular distance is measured in units of ∆R ≡p(∆η)2+ (∆φ)2.
JHEP12(2018)010
parton-level calculations at next-to-leading order (NLO) and next-to-next-to-leading order
(NNLO) in the strong coupling constant α
S, as well as with a parton shower Monte Carlo
(MC) simulation. The measured Zγ production cross section at high values of photon E
Tis used to search for aTGCs (ZZγ and Zγγ). For these searches an exclusive selection is
used, providing higher sensitivity to the anomalous couplings due to further background
suppression.
2
ATLAS detector and data samples
2.1
ATLAS detector and experimental data set
The ATLAS detector at the LHC is described in detail in ref. [
19
]. A short overview is
presented here, with an emphasis on the subdetectors needed for a precision measurement
of the Z(ν ¯
ν)γ final state. The ATLAS detector covers nearly the entire solid angle
sur-rounding the collision point. Its major components are an inner tracking detector (ID)
surrounded by a thin superconducting solenoid providing a 2 T axial magnetic field,
elec-tromagnetic (ECAL) and hadron (HCAL) calorimeters, and a muon spectrometer (MS).
The ID is composed of three subsystems. Two detectors cover the pseudorapidity range
|η| < 2.5: the silicon pixel detector and the silicon microstrip tracker (SCT). The outermost
system of the ID, with an acceptance of
|η| < 2.0, is composed of a transition radiation
tracker (TRT). The TRT provides identification information for electrons by the detection
of transition radiation. The MS is composed of three large superconducting air-core toroid
magnets, a system of three stations of chambers for tracking measurements, with high
precision in the range
|η| < 2.7, and a muon trigger system covering the range |η| < 2.4.
The ECAL is composed of alternating layers of passive lead absorber interspersed with
active liquid-argon gaps. It covers the range of
|η| < 3.2 and plays a crucial role in photon
identification. For
|η| < 2.5 the calorimeter has three longitudinal layers in shower depth,
with the first layer having the highest granularity in the η coordinate, and the second layer
collecting most of the electromagnetic shower energy for high-p
Tobjects. A thin presampler
layer precedes the ECAL over the range
|η| < 1.8, and is used to correct for the energy lost
by EM particles upstream of the calorimeter. The HCAL, surrounding the ECAL, is based
on two different technologies, with scintillator tiles or liquid-argon as the active medium,
and with either steel, copper, or tungsten as the absorber material. Photons are identified
as narrow, isolated showers in the ECAL with no penetration into the HCAL. The fine
segmentation of the ATLAS calorimeter system allows an efficient separation of jets from
isolated prompt photons.
Collision events are selected using a hardware-based first-level trigger and a
software-based high-level trigger.
The resulting recorded event rate from LHC pp collisions at
√
s = 13 TeV during the data-taking period in 2015 and 2016 was approximately 1 kHz [
20
].
After applying criteria to ensure good ATLAS detector operation, the total integrated
luminosity useful for data analysis is 36.1 fb
−1. The uncertainty in the combined 2015+2016
integrated luminosity is 2.1%. It is derived, following a methodology similar to that detailed
in ref. [
21
], and using the LUCID-2 detector for the baseline luminosity measurements [
22
],
from calibration of the luminosity scale using x–y beam-separation scans.
JHEP12(2018)010
2.2
Simulation of signal and backgrounds
Simulated signal and background events were produced with various Monte Carlo event
gen-erators, processed through a full ATLAS detector simulation [
23
] using Geant4 [
24
], and
then reconstructed with the same procedure used for data. Additional pp interactions
(pile-up), in the same and neighbouring bunch crossings, were overlaid on the hard-scattering
process in the MC simulation. The MC events were then reweighted to reproduce the
distribution of the number of interactions per bunch crossing observed in data.
For the signal modeling Sherpa 2.2.2 [
25
] with the NNPDF3.0 NNLO PDF set [
26
]
is used as the baseline event generator.
The signal sample was generated with up to
three additional state partons at leading order (LO) and up to one additional
final-state parton at next-to-leading order (NLO). Alternative signal samples, the first
gen-erated using Sherpa 2.1.1 with the CT10 PDF set [
27
] and the second generated using
MG5 aMC@NLO 2.3.3 [
28
] with the NNPDF3.0 NLO PDF set and interfaced to the
Pythia 8.212 [
29
] parton shower model, are considered for studies of systematic
uncer-tainties. Signal samples with non-zero anomalous triple gauge-boson couplings were also
generated using Sherpa 2.1.1 with the CT10 PDF set. The values of coupling constants
used in the generation are chosen to be equal to the expected limits obtained in a previous
ATLAS study [
5
].
Background events containing Z bosons with associated jets were simulated using
Sherpa 2.1.1 with the CT10 PDF set, while background events containing W bosons with
associated jets were simulated using Sherpa 2.2.0 with the NNPDF3.0 NNLO PDF set.
For both of these processes the matrix elements were calculated for up to two partons
at NLO and four partons at LO. Background events containing a photon with associated
jets were simulated using Sherpa 2.1.1 with the CT10 PDF set. Matrix elements were
calculated with up to four partons at LO. Background events containing a lepton pair
and a photon with associated jets were simulated using Sherpa 2.2.2 with the NNPDF3.0
NNLO PDF set. Matrix elements including all diagrams with three electroweak couplings
were calculated for up to one parton at NLO and up to three partons at LO.
3
Selection of Z(ν ¯
ν)γ events
The event selection criteria are chosen to provide precise cross-section measurements of
Z(ν ¯
ν)γ production and good sensitivity to anomalous gauge-boson couplings between
pho-tons and Z bosons. The selection is optimized for obtaining a high signal efficiency together
with good background rejection.
Events are required to have been recorded with stable beam conditions and with all
relevant detector subsystems operational. Event candidates in both data and MC
simula-tion are selected using the lowest-E
Tunprescaled single-photon trigger: this requires the
presence of at least one cluster of energy deposition in the ECAL with transverse energy
E
Tlarger than 140 GeV, satisfying the loose identification criteria described in ref. [
30
].
JHEP12(2018)010
3.1
Object selection
Photon candidates are reconstructed [
31
] from ECAL energy clusters with
|η| < 2.37 and
E
T> 150 GeV.
They are classified either as converted (candidates with a matching
reconstructed conversion vertex or a matching track consistent with having originated
from a photon conversion) or as unconverted (all other candidates). Both kinds of photon
candidates are used in the analysis. Electron candidates are reconstructed [
32
] from ECAL
energy clusters with
|η| < 2.47 that are associated with a reconstructed track in the ID with
transverse momentum p
T> 7 GeV. The ECAL cluster of the electron/photon candidate
must lie outside the transition region between the barrel and endcap (1.37 <
|η| < 1.52).
Muon candidates are reconstructed from tracks in the MS that have been matched to a
corresponding track in the inner detector, and are referred to as “combined muons”. The
combined track is required to have p
T> 7 GeV and
|η| < 2.7.
The shower shapes produced in the ECAL are used to identify photons and electrons.
Photons are required to pass all the requirements on shower shape variables which
cor-respond to the tight photon identification criteria [
30
]. The tight photon identification
efficiency ranges from 88% (96%) to 92% (98%) for unconverted (converted) photons with
p
T> 100 GeV. A sample of “preselected” photons, used for the calculation of missing
transverse momentum, are required to satisfy the less restrictive loose identification
crite-ria of ref. [
30
]. Electron candidates are required to satisfy loose [
32
] electron identification
criteria, whose efficiency is greater than 84%. Muon candidates are required to satisfy
tight identification criteria as described in ref. [
33
], with efficiency greater than 90% for
combined muons used in the selection.
Electron and muon candidates are required to originate from the primary vertex
2by demanding that the significance of the transverse impact parameter, defined as the
absolute value of the track’s transverse impact parameter, d
0, measured relative to the beam
trajectory, divided by its uncertainty, σ
d0, satisfy
|d
0|/σ
d0< 3 for muons and
|d
0|/σ
d0< 5
for electrons. The difference z
0between the value of the z coordinate of the point on the
track at which d
0is defined, and the longitudinal position of the primary vertex, is required
to satisfy
|z
0· sin(θ)| < 0.5 mm for both the muons and electrons.
Photon, electron and muon candidates are required to be isolated from other
parti-cles. The following criteria are used for photons: the total transverse energy in ECAL
energy clusters within ∆R = 0.4 of the photon candidate is required to be less than
2.45 GeV + 0.022
· E
Tγ, and the scalar sum of the transverse momenta of the tracks located
within a distance ∆R = 0.2 of the photon candidate is required to be less than 0.05
· p
γT.
For preselected photons, isolation criteria are not applied. For muons and electrons, the
isolation requirement is based on track information and is tuned to have an efficiency of at
least 99% [
33
].
Jets are reconstructed from topological clusters in the calorimeter [
34
] using the anti-k
talgorithm [
35
] with a radius parameter of R = 0.4. Events with jets arising from detector
noise or other non-collision sources are discarded [
36
]. A multivariate combination of
track-2
Each primary vertex candidate is reconstructed from at least two associated tracks with pT> 0.4 GeV.
The primary vertex is selected among the primary vertex candidates as the one with the highest sum of the squared transverse momenta of its associated tracks.
JHEP12(2018)010
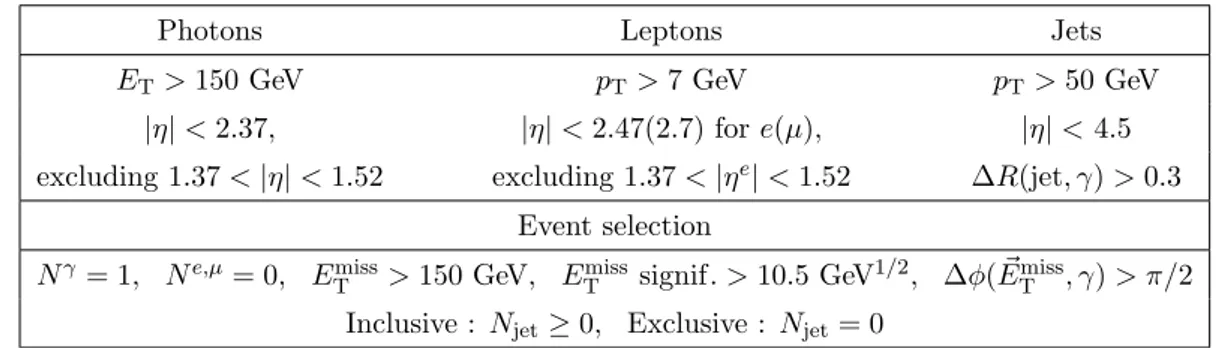
Photons Leptons Jets
ET> 150 GeV pT> 7 GeV pT> 50 GeV
|η| < 2.37, |η| < 2.47(2.7) for e(µ), |η| < 4.5 excluding 1.37 <|η| < 1.52 excluding 1.37 <|ηe| < 1.52 ∆R(jet, γ) > 0.3
Event selection
Nγ= 1, Ne,µ= 0, ETmiss> 150 GeV, ETmiss signif. > 10.5 GeV1/2, ∆φ( ~ETmiss, γ) > π/2 Inclusive : Njet≥ 0, Exclusive : Njet= 0
Table 1. Definition of the fiducial region. The object selection is presented in the top part of the table, while the event selection is described in the bottom part.
based variables is used to suppress jets originating from pile-up in the ID acceptance [
37
].
The energy of each jet is calibrated and corrected for detector effects using a combination
of simulated events and in situ methods [
38
] using data collected at
√
s = 13 TeV. The
selected jets are required to have p
Tlarger than 50 GeV and
|η| < 4.5.
The missing transverse momentum is defined as the negative vector sum of the
transverse momenta of all reconstructed physics objects in the event [
39
] (leptons with
p
T> 7 GeV, preselected photons with p
T> 10 GeV and jets with p
T> 20 GeV), plus
a “soft term” incorporating tracks from the primary vertex that are not associated with
any such objects [
40
]. The resulting vector is denoted ~
E
Tmisssince it includes calorimetric
energy measurements, and its magnitude E
Tmissis used as a measure of the total transverse
momentum of neutrinos in the event.
To resolve ambiguities in the object reconstruction, jet candidates lying within
∆R = 0.3 of the photon candidates are removed.
3.2
Signal region definition
The signal region (SR) is defined to have exactly one tight isolated photon, as described
above. In order to reduce the contamination from events that do not contain high-energy
neutrinos (mainly γ + jet background with fake E
Tmissfrom jet momenta mismeasurements)
the selected events are required to have E
Tmiss> 150 GeV. To reduce the number of W (`ν)γ
and Z(``)γ events, a lepton veto is applied: events with any selected electrons or muons
are discarded. A requirement of at least 10.5 GeV
1/2for the E
missTsignificance, defined
as E
Tmiss/
q
Σp
jetT+ E
Tγ, further suppresses background contributions with fake E
Tmiss. An
additional angular separation requirement ∆φ( ~
E
Tmiss, γ) > π/2 is made, which suppresses
the pp
→ W (eν) + X background. These object and event selection requirements define
the reconstruction-level fiducial region and are summarized in table
1
.
To simplify the interpretation of the results and comparison with theory predictions,
the cross section is measured in an extended fiducial region, defined at particle level
3in
ta-3“Particle level” quantities are defined in terms of stable particles in the MC event record with a properdecay length cτ > 10 mm which are produced from the hard scattering, including those that are the products of hadronization. The particle-level jets are reconstructed using the anti-kt algorithm with a
radius parameter of R = 0.4, using all stable particles except for muons and neutrinos. The particle-level jets in ATLAS do not include muons because jets are built from calorimeter clusters, excluding muons.
JHEP12(2018)010
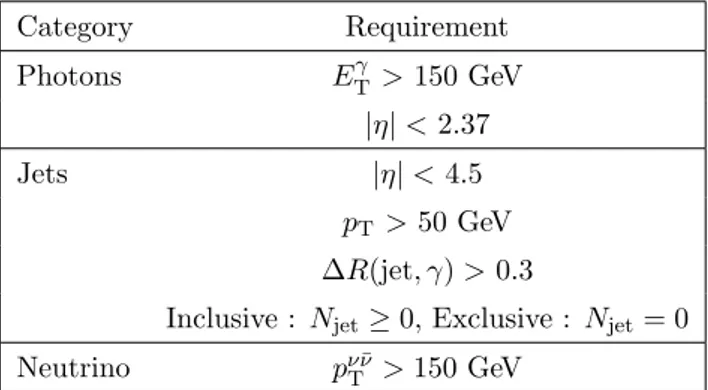
Category Requirement Photons ETγ > 150 GeV |η| < 2.37 Jets |η| < 4.5 pT> 50 GeV ∆R(jet, γ) > 0.3Inclusive : Njet≥ 0, Exclusive : Njet= 0
Neutrino pν ¯ν
T > 150 GeV
Table 2. Definition of the extended fiducial region. At particle level, pν ¯Tν is the equivalent of ETmiss.
ble
2
. Compared with the fiducial region, the extended fiducial region removes requirements
on E
Tmisssignificance, ∆φ( ~
E
Tmiss, γ), the lepton veto and the transition η region for
pho-tons. In the signal event selection at particle level, the E
Tmisssignificance and ∆φ( ~
E
Tmiss, γ)
are given by p
ν ¯Tν/
q
Σp
jetT+ E
Tγand ∆φ(~
p
Tν ¯ν, γ), respectively. Photon isolation at the
par-ticle level is performed using the same requirements and cone sizes as described for the
reconstruction-level isolation in section
3.1
.
4
Background estimation
Backgrounds to the Z(ν ¯
ν)γ signal originate from several sources. The dominant sources
(listed in decreasing order of importance) are estimated with data-driven techniques:
elec-troweak processes such as W (`ν)γ, where the lepton is not detected; events with prompt
photons and mismeasured jet momenta that gives rise to missing transverse momentum;
events with real E
Tmissfrom neutrinos (such as Z(ν ¯
ν) or W (eν)) and misidentified photons
from either electrons or jets. The procedures used to estimate these backgrounds closely
fol-low those of the previous ATLAS measurement [
5
]. A less important source is ``γ (mainly
τ τ γ) production, which is estimated from MC simulation and is expected to contribute
roughly 1% of the selected event yield. In the following, each source of background is
discussed in detail together with the method used for its estimation.
Misidentified events from W (`ν)γ production are one of the dominant background
contributions. A large fraction (about 60%) of this contamination arises from W (τ ν)γ
events. Photon+jets events form another sizeable background contribution to the signal
region. For the estimation of these backgrounds, two control regions (CRs) are defined by
selecting events with the same criteria used for the SR but requiring either exactly one
charged lepton (e or µ) in the event, or requiring the E
Tmisssignificance to be less than
10.5 GeV
1/2. The first CR is enriched with W (`ν)γ events (about 77%) while the second
CR is enriched with γ+jets events (about 55%). The use of the 1-lepton (e or µ) control
region for the estimation of the W (`ν)γ background to the signal region, where ` can be
any of e, µ or τ , relies on the assumption of lepton flavour universality. A simultaneous fit
to the background-enriched CRs is performed to allow the CR data to constrain the yield
of these main backgrounds, initially estimated with MC simulation, by establishing the
JHEP12(2018)010
normalization factors for the W (`ν)γ and γ+jets background contribution as described in
refs. [
5
,
41
]. The same background normalization factors are assumed in the CR and SR and
the fit uncertainties on these factors accounts for the uncertainty from this assumption.
The normalization factor for the W γ background is found to be close to one, while the
normalization factor for the γ+jets background is 1.7
± 0.5, since the pre-fit expectation is
computed at LO, for which higher-order corrections would be expected to be considerable.
The pre-fit kinematic distributions of these backgrounds are taken from the MC simulation.
The variations of the background yield in each bin due to each of the experimental and MC
modelling uncertainties reported in section
5.1
are treated as Gaussian-distributed nuisance
parameters in the likelihood function fit used to obtain the final background predictions
in the SR. The dominant systematic uncertainties in the W (`ν)γ process come from MC
modelling (mostly due to the QCD scale uncertainty) and from the uncertainty in the
electron-photon energy scale. Their contributions are 5.8% and 3.8%, respectively. The
systematic uncertainty for γ+jets events is also dominated by the QCD scale component,
and amounts to approximately 19%.
Misidentification of electrons as photons also contributes to the background yield in
the signal region. The main source of this background is the inclusive W (eν) process,
but contributions also arise from the single top-quark and t¯
t production processes. The
estimation of the size of these background contributions is done in two steps. The first is
the determination of the probability for an electron to be misidentified as a photon using
Z(e
+e
−) decays reconstructed as e + γ, as described in refs. [
5
,
41
]. The probability of
observing an e + γ pair with invariant mass near the Z boson mass is used to determine
an electron-to-photon fake factor f
e→γ. The fake factor is found to vary between 0.6%
to 2.7%, depending on the photon’s η and p
T. The second step is the construction of a
control region by applying the nominal ν ¯
νγ selection criteria described in section
3
, with
the exception that an electron is required instead of the final-state photon, leading to a
control region dominated by the W (eν)+jets process. The estimated background is then
given by the number of events in the chosen control sample scaled by the electron-to-photon
fake factor. The statistical uncertainty is determined by the size of the control sample and
does not exceed 5%. The systematic uncertainty for this background varies from 13%
to 25%, depending on the photon p
Tand η, and is dominated by the difference between
the fake rates obtained from Z(ee) and W (eν) MC events. This source of systematic
uncertainty on the fake factor is estimated from MC simulation in order to avoid double
counting the uncertainty associated with the estimation of backgrounds under the Z boson
mass peak in collision data. The total relative systematic uncertainty of this background
estimate is less than 15%, since the main contribution comes from the most populated
central pseudorapidity region and has p
T< 250 GeV, where the systematics on the fake
factor is the smallest.
To estimate the contribution from background due to the misidentification of jets as
photons, a two-dimensional sideband method is used, as described in ref. [
5
]. In this method
the Z(ν ¯
ν)γ events are separated into one signal and three control regions. Events in the
signal region require the photon to satisfy the nominal photon isolation and tight
identi-fication requirements, as described in section
3
. The photon isolation and identification
JHEP12(2018)010
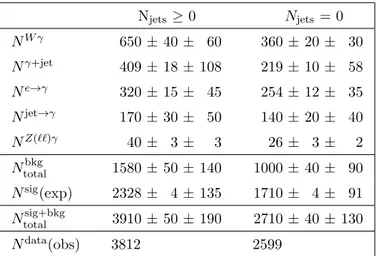
Njets≥ 0 Njets= 0 NW γ 650± 40 ± 60 360± 20 ± 30 Nγ+jet 409± 18 ± 108 219± 10 ± 58 Ne→γ 320± 15 ± 45 254± 12 ± 35 Njet→γ 170± 30 ± 50 140± 20 ± 40 NZ(``)γ 40± 3 ± 3 26± 3 ± 2 Ntotalbkg 1580 ± 50 ± 140 1000± 40 ± 90 Nsig(exp) 2328 ± 4 ± 135 1710± 4 ± 91 Ntotalsig+bkg 3910 ± 50 ± 190 2710± 40 ± 130 Ndata(obs) 3812 2599Table 3. Summary of observed and expected yields (all backgrounds and signal) for events passing the selection requirements in data for the inclusive (Njets ≥ 0) and exclusive (Njets = 0) selections.
The W γ and γ+jet backgrounds are scaled by the normalization factor from the fit, luminosity and cross section. The e→ γ and jet → γ backgrounds are estimated using data-driven techniques. The row labelled “Nsig
(exp)” corresponds to the Sherpa NLO prediction. The row labelled “Ntotalsig+bkg”
corresponds to the sum of the expected background contributions and expected signal. The first uncertainty is statistical, while the second is systematic.
criteria are modified in order to build the control regions, which are disjoint from each other
and from the signal region. The modified photon identification criteria requires photons to
pass a “non-tight ” identification but fail the tight identification. The non-tight selection
criteria remove requirements on four out of the nine shower shape variables required for
tight photons; the variables that are removed from the list of requirements are those that
are least correlated with calorimeter isolation [
42
]. Two of the control regions are defined
by modifying either the photon isolation or photon identification requirement, while for
the third control region both the isolation and identification requirements are modified.
The number of background events in the signal region can be derived from the number of
observed events in the control regions according to the methodology described in ref. [
5
].
The statistical uncertainty of the background is established by the event yields in the four
regions, while the systematic uncertainty is 29% and is dominated by the size of changes
to the background estimate arising from the variation of the control regions’ definitions,
which leads to changes exceeding the expected size of the statistical fluctuations. This
sys-tematic uncertainty also covers possible effects due to the correlation between the isolation
and identification criteria.
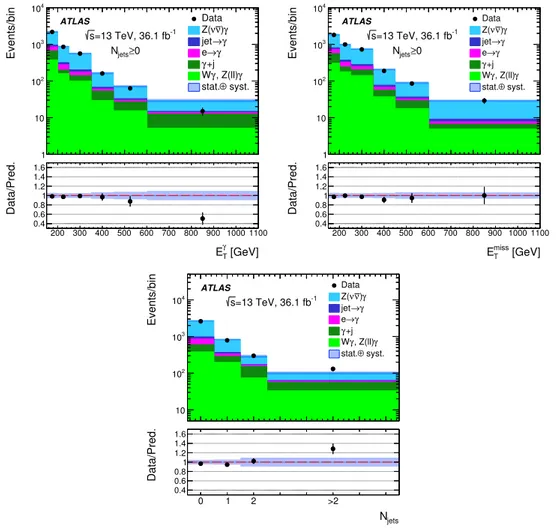
The resulting signal and background composition is shown in table
3
. Kinematic
distri-butions of the photon transverse energy, missing transverse momentum, and jet multiplicity
in the fiducial region for the inclusive selection (N
jets≥ 0) are shown in figure
2
. Kinematic
distributions of the photon transverse energy and the missing transverse momentum in the
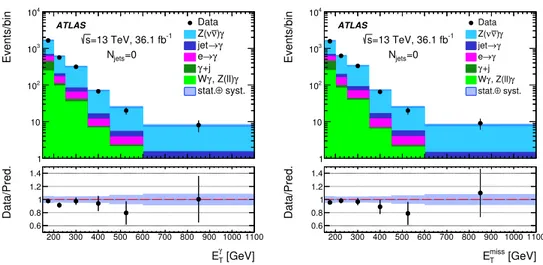
fiducial region for the exclusive selection (N
jets= 0) are shown in figure
3
.
Good agreement between data and the SM expectation is observed in the shapes of
most of the measured distributions. The discrepancy in the last bin of the inclusive E
Tγdistribution, which is not used to set aTGC limits, was found to be consistent with having
JHEP12(2018)010
[GeV] γ T p 200 300 400 500 600 700 800 900 1000 1100 Events/bin 1 10 2 10 3 10 4 10 Data γ ) ν ν Z( γ → jet γ → e +j γ γ , Z(ll) γ W syst. ⊕ stat. -1 =13 TeV, 36.1 fb s ATLAS 0 ≥ jets N [GeV] γ T E 200 300 400 500 600 700 800 900 1000 1100 Data/Pred. 0.4 0.6 0.8 1 1.2 1.4 1.6 [GeV] miss T p 200 300 400 500 600 700 800 900 1000 1100 Events/bin 1 10 2 10 3 10 4 10 Data γ ) ν ν Z( γ → jet γ → e +j γ γ , Z(ll) γ W syst. ⊕ stat. -1 =13 TeV, 36.1 fb s ATLAS 0 ≥ jets N [GeV] miss T E 200 300 400 500 600 700 800 900 1000 1100 Data/Pred. 0.4 0.6 0.8 1 1.2 1.4 1.6 jets N 0 1 2 3 4 5 6 7 Events/bin 10 2 10 3 10 4 10 Data γ ) ν ν Z( γ → jet γ → e +j γ γ , Z(ll) γ W syst. ⊕ stat. -1 =13 TeV, 36.1 fb s ATLAS jets N Data/Pred. 0.4 0.6 0.8 1 1.2 1.4 1.6 0 1 2 >2Figure 2. Top left: photon ETdistribution; top right: missing transverse momentum distribution;
bottom: jet multiplicity distribution, in the inclusive (Njets ≥ 0) signal region. MC expectations are
scaled to the integrated luminosity of the data using the expected MC cross section of each sample. The W γ and γ+jet backgrounds are scaled by an additional normalization factor from the fit to data in the corresponding control regions. Backgrounds arising from electron or jet misidentification as a photon are estimated with the data-driven techniques described in the text. The dashed band represents the sum in quadrature of systematic and statistical uncertainties of both the background and signal expectation, and includes a contribution arising from the uncertainty in the integrated luminosity of the data sample.
arisen from a statistical fluctuation of the data. The uncertainties shown in the figures are
treated as being uncorrelated among different systematic sources and different backgrounds.
5
Integrated and differential cross sections
5.1
Description of the cross-section measurements
The number of signal events is determined by subtracting the estimated backgrounds from
the number of observed events. The signal yield is then corrected for detection efficiencies
in the fiducial region, defined in table
1
. The integrated cross section in the extended
JHEP12(2018)010
[GeV] γ T p 200 300 400 500 600 700 800 900 1000 1100 Events/bin 1 10 2 10 3 10 4 10 Data γ ) ν ν Z( γ → jet γ → e +j γ γ , Z(ll) γ W syst. ⊕ stat. -1 =13 TeV, 36.1 fb s ATLAS =0 jets N [GeV] γ T E 200 300 400 500 600 700 800 900 1000 1100 Data/Pred. 0.6 0.8 1 1.2 1.4 miss [GeV] T p 200 300 400 500 600 700 800 900 1000 1100 Events/bin 1 10 2 10 3 10 4 10 Data γ ) ν ν Z( γ → jet γ → e +j γ γ , Z(ll) γ W syst. ⊕ stat. -1 =13 TeV, 36.1 fb s ATLAS =0 jets N [GeV] miss T E 200 300 400 500 600 700 800 900 1000 1100 Data/Pred. 0.6 0.8 1 1.2 1.4Figure 3. Left: photon ET distribution; right: missing transverse momentum distribution, in the
exclusive (Njets= 0) signal region. MC expectations are scaled to the integrated luminosity of the
data using the expected MC cross section of each sample. The W γ and γ+jet backgrounds are scaled by an additional normalization factor from the fit to data in the corresponding control regions. Backgrounds arising from electron or jet misidentification as a photon are estimated with the data-driven techniques described in the text. The dashed band represents the sum in quadrature of systematic and statistical uncertainties of both the background and signal expectation, and includes a contribution arising from the uncertainty in the integrated luminosity of the data sample.
fiducial region, defined in table
2
, is calculated as
σ
ext-fid=
N
− B
A
Zγ· C
Zγ·
R Ld t
,
where N is the number of observed candidate events, B is the expected number of
back-ground events and
R Ld t is the integrated luminosity corresponding to the analyzed data
set. The factors C
Zγand A
Zγcorrect for detection efficiency and acceptance, respectively:
• C
Zγis defined as the number of reconstructed signal events satisfying all selection
criteria divided by the number of events that, at particle level, meet the acceptance
criteria of the fiducial region;
• A
Zγis defined as the number of signal events within the fiducial region divided by
the number of signal events within the extended fiducial region, with both numerator
and denominator defined at particle level.
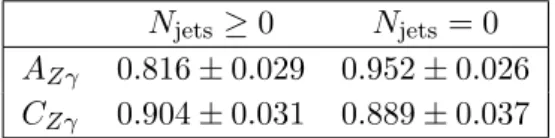
The corrections A
Zγand C
Zγare determined using the Zγ signal events generated by
Sherpa and are summarized in table
4
along with their uncertainties.
5.2
Systematic uncertainties
Systematic uncertainties in the acceptances A
Zγare evaluated by varying the PDF sets,
the value of α
S, the renormalization and factorization scales (QCD scale uncertainty), and
JHEP12(2018)010
N
jets≥ 0
N
jets= 0
A
Zγ0.816
± 0.029 0.952 ± 0.026
C
Zγ0.904
± 0.031 0.889 ± 0.037
Table 4. Summary of values of the correction factors (CZγ) and acceptances (AZγ) for the Zγ
cross-section measurements. The uncertainty presented here includes only systematic components, since the statistical uncertainty is found to be negligible.
(MPI). In total, 100 error sets are checked for the NNPDF3.0 NNLO PDF variation, leading
to a relative uncertainty of 0.76% for the inclusive case and 0.35% for the exclusive case.
These numbers fully cover variations arising from the use of alternative PDF sets such
as CT14 [
43
] and MMHT2014 [
44
]. The uncertainty from α
Sis estimated by varying it
within the range of its world-average value as provided in ref. [
45
] and is found to be
negligible.
The effects of the renormalization and factorization scale uncertainties are
assessed by varying these two scales independently by a factor of two from their nominal
values, removing combinations where the two variations differ by a factor of four, and
taking the envelope of the resulting cross-section variations as the size of the associated
systematic uncertainty. Uncertainties from the PS and MPI are evaluated using a series
of eigentunes for the Pythia generator with its A14 parameter tune [
46
]. The size of the
uncertainty from the renormalization and factorization scales does not exceed 3.0%, while
PS and MPI uncertainties cause variations from 1.9% to 2.7% for the inclusive and exclusive
cases, respectively. The total uncertainties in the acceptance factors are summarized in
table
4
.
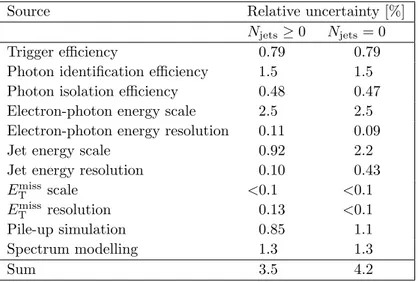
Systematic uncertainties affecting the correction factor C
Zγinclude contributions
aris-ing from uncertainties in the efficiencies of the trigger, reconstruction and particle
iden-tification, as well as the uncertainties in the energy, momentum scales and resolutions of
the final-state objects. Additional systematic uncertainty sources arise from the modelling
of particle spectra and pile-up events. Spectrum modelling uncertainties are estimated by
varying the PDF set and QCD scales as described above for the case of the acceptance
factor A
Zγ. Some of these contributions are found to have a non-linear dependence on
photon transverse energy, E
missT
or jet multiplicity. In these cases, uncertainties estimated
as a function of these observables are used in the unfolding process of section
5.5
when the
corresponding kinematic distributions are derived from the signal sample. Table
5
displays
the size of the individual contributions to the uncertainties in the C
Zγfactor; the total
uncertainty is summarized in table
4
.
5.3
Integrated extended fiducial cross section
The measurements of the cross sections, along with their uncertainties, are based on the
maximization of the profile-likelihood ratio
Λ(σ) =
L(σ,
ˆ
ˆ
θ(σ))
L(ˆσ, ˆθ)
,
JHEP12(2018)010
Source Relative uncertainty [%]
Njets ≥ 0 Njets= 0
Trigger efficiency 0.79 0.79
Photon identification efficiency 1.5 1.5 Photon isolation efficiency 0.48 0.47 Electron-photon energy scale 2.5 2.5 Electron-photon energy resolution 0.11 0.09
Jet energy scale 0.92 2.2
Jet energy resolution 0.10 0.43
Emiss T scale <0.1 <0.1 ETmissresolution 0.13 <0.1 Pile-up simulation 0.85 1.1 Spectrum modelling 1.3 1.3 Sum 3.5 4.2
Table 5. Relative systematic uncertainties in the signal correction factor CZγ for the inclusive and
exclusive Zγ measurements.
where
L represents the likelihood function, σ is the cross section, and θ are the nuisance
parameters corresponding to the sources of systematic uncertainty. The ˆ
σ and ˆ
θ terms
denote the unconditional maximum-likelihood estimate of the parameters, i.e., the
param-eters for which the likelihood is maximized for both σ and θ. The term
ˆ
ˆ
θ(σ) denotes the
value of θ that maximizes
L for a given value of σ.
The likelihood function is defined as
L(σ, θ) = Poisson(N | S(σ, θ) + B(θ)) · Gaussian(θ
0| θ),
representing the product of the Poisson probability of observing N events, given
expecta-tions of S for the signal and B for the background, multiplied by the Gaussian constraints
θ on the systematic uncertainties, with central values θ
0from auxiliary measurements, as
described in section
5.1
.
The measured cross sections for Z(ν ¯
ν)γ production in the extended fiducial region are
summarized in table
6
, along with the theoretical predictions of the Mcfm [
47
] generator
described in section
5.4
. The measured cross sections agree with the SM expectations to
within one standard deviation. Systematic uncertainties arise from uncertainties in the
ac-ceptances and correction factors, as well as from uncertainties in the background estimates.
These two sources contribute roughly equally to the uncertainty in the measured cross
sec-tions. Compared with the Zγ measurements at
√
s = 8 TeV [
5
], the systematic uncertainty
is significantly reduced. This improvement is due primarily to the reduction of systematic
uncertainty allowed by the data-driven estimate of the γ+jets and W γ backgrounds.
An overall check of the SM predictions is done with the Matrix generator [
48
].
Cross sections obtained by Matrix (inclusive case: σ
ext.fid.= 78.6
± 0.4 ± 4.4 fb;
ex-clusive case: σ
ext.fid.= 55.8
± 0.3 ± 3.6 fb, where the uncertainties are statistical and
systematic, respectively) are found to be consistent with those from Mcfm to within their
statistical uncertainty.
JHEP12(2018)010
σ
ext.fid.[fb]
σ
ext.fid.[fb]
Measurement
NNLO Mcfm Prediction
N
jets≥ 0
83.7
+3.6−3.5(stat.)
+6.9−6.2(syst.)
+1.7−2.0(lumi.)
78.1
± 0.2(stat.)±4.7(syst.)
N
jets= 0
52.4
+2.4−2.3(stat.)
+4.0−3.6(syst.)
+1.2−1.1(lumi.)
55.9
± 0.1(stat.)±3.9(syst.)
Table 6. Measured cross sections for Z(ν ¯ν)γ production within the extended fiducial region for a centre-of-mass energy of √s = 13 TeV, with corresponding SM expectations obtained from the Mcfm [47] generator at next-to-next-to-leading order in the strong coupling constant αS.
5.4
Standard Model calculations
The resulting measurement of the rate and kinematic distributions of Zγ production is
compared with SM expectations using the parton shower Monte Carlo generator Sherpa
and the NNLO parton-level generators Mcfm and Matrix. The NNPDF3.0 PDF set was
used for the Sherpa, Mcfm and Matrix generation. The values of the renormalization
and factorization scales were set to m
Zγfor the Mcfm and Matrix NNLO generation of
the Zγ process.
The photon isolation criterion at the parton level is applied by considering a cone of
variable opening angle ∆R (with maximum opening angle ∆R
max= 0.1) centred around the
photon direction, and requiring that the transverse energy flow inside that cone be always
less than a given fraction of the photon p
T; this fraction is set to 0.1 when ∆R = ∆R
max,
and tends smoothly to zero when ∆R
→ 0, as described in ref. [
49
]. Due to this procedure,
the contribution from photon fragmentation to the NNLO calculations of the Mcfm and
Matrix SM predictions is zero.
Events generated with Sherpa, as described in section
2.2
, are also compared with
the particle-level measurements. For the NNLO parton-level predictions, parton-to-particle
correction factors C
∗(parton→particle)must be applied in order to obtain the particle-level
cross sections. These correction factors are computed as the ratios of the pp
→ Zγ cross
sections predicted by Sherpa with hadronization and the underlying event disabled to the
cross sections with them enabled. The systematic uncertainty in the correction factors
is evaluated by using a signal sample from an alternative generator (MG5 aMC@NLO),
taking the resulting change in C
∗(parton→particle)as the one-sided size of a symmetrized value
for the uncertainty. This accounts for uncertainties in both the parton shower modelling
and the description of the underlying event. The value of C
∗(parton→particle)is found to
be 0.87
± 0.04 for the inclusive predictions and 0.97 ± 0.04 for the exclusive predictions.
For the exclusive case, the parton-to-particle correction includes an additional contribution
from the jet veto, which compensates for the difference in the photon isolation between the
parton and particle levels. The particle-level cross sections are then obtained by multiplying
the NNLO parton-level cross-section values by the C
∗(parton→particle)correction factors, and
are displayed in table
6
.
JHEP12(2018)010
The systematic uncertainty in the expected NNLO SM cross sections arising from
uncertainties in the QCD scale is estimated by varying the QCD scales by factors of 0.5
and 2.0 (separately for the renormalization and factorization scales, removing combinations
where the two variations differ by a factor of four). The effect of the QCD scale uncertainty
on the prediction for the first bin of the various differential cross-section measurements also
accounts for uncertainties arising from the incomplete cancellation of divergences associated
with soft gluon emission in fixed-order perturbative calculations of Zγ production. This
effect is appreciable because of the symmetric E
Tγand p
ν ¯Tνthresholds used in defining
the SR. The corresponding corrections are estimated conservatively from the cited MC
generators by evaluating the degree of compensation of the divergence that arises when
the p
ν ¯Tν(E
Tγ) requirement is lowered to a value significantly below the value of the E
Tγ(p
ν ¯Tν)
requirement of 150 GeV. The systematic uncertainty due to the PDF choice is computed
using the eigenvectors of the NNPDF 3.0 PDF set [
26
] and the envelope of the differences
between the results obtained with the CT14 [
43
] and MMHT2014 [
44
] PDF sets, according
to the PDF4LHC recommendations [
50
]. Matrix predictions do not include the systematic
uncertainty due to the PDF choice.
5.5
Differential extended fiducial cross section
The measurement of the Zγ production differential cross sections allows a comparison of
experimental results with SM expectations for both the absolute rates and the shapes of
kinematic distributions. The measurements are performed as a function of several
observ-ables that are sensitive to higher-order perturbative QCD corrections [
51
] and to a possible
manifestation of aTGCs [
52
]: photon transverse energy (E
Tγ), the transverse momentum
of the neutrino-antineutrino pair (p
ν ¯Tν), and jet multiplicity (N
jets). The differential cross
sections are defined in the extended fiducial region, and are extracted with an unfolding
procedure that corrects for measurement inefficiencies and resolution effects that modify
the observed distributions. The procedure described in ref. [
5
] is followed, using an
itera-tive Bayesian method [
53
]. For each distribution, events from simulated signal MC samples
are used to generate a response matrix that accounts for bin-to-bin migration between the
reconstruction-level and particle-level distributions.
The statistical uncertainties of the unfolded distributions are estimated using
pseudo-experiments, generated by fluctuating each bin of the observed spectrum according to a
Poisson distribution with a mean value equal to the observed yield. The shape uncertainties
arising from the limited size of the signal MC sample are also obtained by generating
pseudo-experiments. The sources of systematic uncertainty are discussed in section
5.1
,
with their impact on the unfolded distribution assessed by varying the response matrix for
each of the systematic uncertainty sources by one standard deviation and combining the
resulting differences from the nominal values in quadrature.
The differential cross sections as a function of E
Tγand p
ν ¯Tνare shown in figures
4
and
5
,
respectively, for both the inclusive and exclusive measurements. Figure
6
shows the cross
section measured in bins of jet multiplicity. The values of the SM expectations shown in
the figures are obtained as described in section
5.4
.
JHEP12(2018)010
[fb/GeV] T γ dE ] γ) ν ν Z( → [pp σd 6 − 10 5 − 10 4 − 10 3 − 10 2 − 10 1 − 10 110 Data with full unc.
Data stat. unc. Sherpa (NNPDF3.0) NNLO MCFM -1 = 13 TeV, 36.1 fb s 0 ≥ jets N ATLAS [GeV] γ T E Data Theory 0.5 1 1.5 150 200 250 350 450 600 1100 [fb/GeV] T γ dE ] γ) ν ν Z( → [pp σd 4 − 10 3 − 10 2 − 10 1 − 10 1 10
Data with full unc. Data stat. unc. Sherpa (NNPDF3.0) NNLO MCFM -1 = 13 TeV, 36.1 fb s = 0 jets N ATLAS [GeV] γ T E Data Theory 0.5 1 1.5 150 200 250 350 450 600 1100
Figure 4. The measured (points with error bars) and predicted differential cross sections as a function of ETγ for the pp→ Z(ν ¯ν)γ process in the inclusive Njets≥ 0 (left) and exclusive Njets = 0
(right) extended fiducial regions. The error bars on the data points show the sum in quadrature of the statistical and systematic uncertainties. The Mcfm NNLO predictions are shown with shaded bands that indicate the theoretical uncertainties described in section 5.4. For the Sherpa predictions, systematic uncertainty is not considered, and the statistical uncertainties arising from the size of the MC samples are too small to be visible. The lower plots show the ratios of the SM expectation to the measured values (shaded bands), with the error bars on the points showing the relative uncertainties in the experimental measurements. The bin size varies from 50 GeV to 500 GeV.
Good agreement with SM expectations is observed in all but the last bin of the E
Tγinclusive distribution. This disagreement is a consequence of the corresponding
disagree-ment observed in figure
2
, which was investigated and found to be consistent with having
arisen from a statistical fluctuation of the data.
6
Limits on triple gauge-boson couplings
Vector-boson couplings are completely fixed within the Standard Model by the
SU(2)
L×U(1)
Ygauge structure. Their measurement is thus a crucial test of the model.
Any deviation from the SM prediction is referred to as an anomalous coupling.
Within the framework of the effective vertex function approach [
52
], anomalous triple
gauge-boson coupling contributions to Zγ production can be parameterized by four
CP-violating (h
V1, h
V2) and four CP-conserving (h
V3, h
V4) complex parameters. Here the V
indices are Z and γ, and h
Zi
and h
γ
i
are the parameters of ZZγ and the Zγγ vertices,
respectively. The h
V3(h
V1) and h
V4(h
V2) parameters correspond to the electric (magnetic)
dipole and magnetic (electric) quadrupole transition moments of V , respectively [
54
].
All of these parameters are zero at tree level in the SM. Since the CP-conserving
couplings h
V3,4do not interfere with the CP-violating couplings h
V1,2, and their sensitivities
to aTGCs are nearly identical [
52
], the limits from this study are expressed solely in terms
of the CP-conserving parameters h
V3,4.
JHEP12(2018)010
[fb/GeV] ν ν T dp ] γ) ν ν Z( → [pp σd 4 − 10 3 − 10 2 − 10 1 − 10 1 10Data with full unc. Data stat. unc. Sherpa (NNPDF3.0) NNLO MCFM -1 = 13 TeV, 36.1 fb s 0 ≥ jets N ATLAS [GeV] ν ν T p Data Theory 0.5 1 1.5 150 200 250 350 450 600 1100 [fb/GeV] ν ν T dp ] γ) ν ν Z( → [pp σd 4 − 10 3 − 10 2 − 10 1 − 10 1 10
Data with full unc. Data stat. unc. Sherpa (NNPDF3.0) NNLO MCFM -1 = 13 TeV, 36.1 fb s = 0 jets N ATLAS [GeV] ν ν T p Data Theory 0.5 1 1.5 150 200 250 350 450 600 1100
Figure 5. The measured (points with error bars) and predicted differential cross sections as a function of pν ¯Tν for the pp→ Z(ν ¯ν)γ process in the inclusive Njets≥ 0 (left) and exclusive Njets = 0
(right) extended fiducial regions. The error bars on the data points show the sum in quadrature of the statistical and systematic uncertainties. The Mcfm NNLO predictions are shown with shaded bands that indicate the theoretical uncertainties described in section 5.4. For the Sherpa predictions, systematic uncertainty is not considered, and the statistical uncertainties arising from the size of the MC samples are too small to be visible. The lower plots show the ratios of the SM expectation to the measured values (shaded bands), with the error bars on the points showing the relative uncertainties in the experimental measurements. The bin size varies from 50 GeV to 500 GeV. [fb] jets dN ] γ) ν ν Z( → [pp σd 1 − 10 1 10 2 10
Data with full unc. Data stat. unc. Sherpa (NNPDF3.0) NNLO MCFM -1 = 13 TeV, 36.1 fb s ATLAS jets N Data Theory 0.5 1 1.5 0 1 2 >2
Figure 6. The measured (points with error bars) and predicted cross sections as a function of Njets
for the pp→ Z(ν ¯ν)γ process in the extended fiducial region. The error bars on the data points show the sum in quadrature of the statistical and systematic uncertainties. The Mcfm NNLO predictions are shown with shaded bands that indicate the theoretical uncertainties described in section5.4. For the Sherpa predictions, systematic uncertainty is not considered, and the statistical uncertainties arising from the size of the MC samples are too small to be visible. The lower plots show the ratios of the SM expectation to the measured values (shaded bands), with the error bars on the points showing the relative uncertainties in the experimental measurements.
JHEP12(2018)010
h
Z 3h
Z 4−5 · 10
−70
5
· 10
−7−5 · 10
−40.439
0.696
1.42
0
0.477
0.243
0.483
5
· 10
−41.40
0.674
0.424
Table 7. Cross sections [fb] for the exclusive Z(ν ¯ν)γ process, requiring a photon with ETγ > 600 GeV, for different values of hZ3 (vertical), and hZ4 (horizontal). For the Standard Model with no anomalous triple gauge-boson couplings, hZ3 = hZ4 = 0.
The yields of Zγ events with high E
Tγfrom the exclusive (zero-jet) selection are used
to set limits on h
V3,4. The exclusive selection is used because it significantly reduces the SM
contribution at high E
Tγand therefore optimizes the sensitivity to anomalous couplings.
The contribution from aTGCs increases with the E
Tof the photon, and the measurement
of Zγ production is found to have the highest sensitivity to aTGCs by restricting the search
to the portion of the extended fiducial region with E
Tγgreater than 600 GeV.
Cross-section values modified by the inclusion of aTGCs (σ
aTGCZγ
) are obtained from
the Mcfm generator. These values are displayed in table
7
for several combinations of
choices of the ZZγ vertex parameters h
Z3and h
Z4.
The expected number of Zγ events in the aTGC region (N
aTGCZγ
(h
V3, h
V4), where V = Z
or γ) is obtained using
N
ZγaTGC(h
V3, h
V4) = σ
aTGCZγ(h
V3, h
V4)
· C
Zγ· A
Zγ· C
∗(parton→particle)·
Z
L dt.
(6.1)
The anomalous couplings influence the kinematic properties of the Zγ events and thus
the efficiency factor of the event reconstruction (C
Zγ). The maximum variation of C
Zγdue
to non-zero aTGC parameters within the aTGC limits measured in this paper (about 7%)
is adopted as an additional systematic uncertainty. The effect of anomalous couplings on
the acceptance factor (A
Zγ) and parton-to-particle factor (C
∗(parton→particle)) is an order of
magnitude smaller than that on C
Zγ, and so is neglected.
Limits on a given aTGC parameters are extracted from a frequentist profile-likelihood
test similar to that of section
5.3
. The profile likelihood depends on the observed number
of exclusive Zγ candidate events, the amount of expected signal as a function of aTGC
given by eq. (
6.1
), and the estimated number of background events. A point in the aTGC
space is accepted (rejected) at the 95% confidence level (CL) if fewer (more) than 95%
of randomly generated pseudo-experiments exhibit larger profile-likelihood ratio values
than that observed in data. In this context, a pseudo-experiment is a set of randomly
generated numbers of events that follow a Poisson distribution with mean equal to the sum
of the number of expected signal events and the estimated number of background events.
Systematic uncertainties are incorporated into the pseudo-experiments via a set of nuisance
parameters with correlated Gaussian constraints. All nuisance parameters are allowed to
fluctuate in the pseudo-experiments.
No evidence of anomalous couplings is observed. The allowed 95% CL ranges for the
anomalous couplings are shown in table
8
for ZZγ (h
Z3and h
Z4) and the Zγγ (h
γ3and
JHEP12(2018)010
Parameter Limit 95% CL Measured Expected hγ3 (−3.7 × 10⁻⁴, 3.7× 10⁻⁴) (−4.2 × 10⁻⁴, 4.3× 10⁻⁴) hZ 3 (−3.2 × 10⁻⁴, 3.3× 10⁻⁴) (−3.8 × 10⁻⁴, 3.8× 10⁻⁴) hγ4 (−4.4 × 10⁻⁷, 4.3× 10⁻⁷) (−5.1 × 10⁻⁷, 5.0× 10⁻⁷) hZ 4 (−4.5 × 10⁻⁷, 4.4× 10⁻⁷) (−5.3 × 10⁻⁷, 5.1× 10⁻⁷)Table 8. Observed and expected one-dimensional 95% CL limits on hγ3, hZ3, h γ 4 and h
Z
4, assuming
that any observed excess in data relative to the associated SM estimate is due solely to hV 3 or hV4.
For each row, all parameters other than the one under study are set to 0.
γ 3 h 0.5 − 0 0.5 3 − 10 × γ h4 1.5 − 1 − 0.5 − 0 0.5 1 1.5 6 − 10 × -1 =13 TeV, 36.1 fb s γ ) ν ν Z( → pp ATLAS Observed ellipses of 95% CL Expected ellipses of 95% CL Observed best-fit value
Z 3 h 0.5 − 0 0.5 3 − 10 × Z h4 1.5 − 1 − 0.5 − 0 0.5 1 1.5 6 − 10 × -1 =13 TeV, 36.1 fb s γ ) ν ν Z( → pp ATLAS Observed ellipses of 95% CL Expected ellipses of 95% CL Observed best-fit value
Figure 7. Observed (solid) and expected (dashed) ellipses of 95% CL on the linear combinations of the pairs of anomalous couplings hγ3 and hγ4 (left) and hZ3 and hZ4 (right). The horizontal and vertical lines inside each contour correspond to the limits found in the one-parameter fit procedure, while the orientation of the ellipses indicates the correlations between the parameters in the two-dimensional fit. In each case, the two parameters not being displayed are set to 0.
h
γ4) vertices. Limits on anomalous couplings imposed by this analysis are 3–7 times more
stringent than those from prior studies [
5
].
Limits on possible combinations of each pair of aTGC parameters are also evaluated.
The ellipses of 95% CL on linear combination of the pairs of anomalous couplings are
shown on the (h
γ3, h
γ4) and (h
Z3
, h
Z4) planes in figure
7
, which are the only such pairs that
are expected to interfere [
52
].
Allowed ranges are also determined for parameters of the effective field theory (EFT)
of ref. [
55
], which includes four dimension-8 operators describing aTGC interactions of
neutral gauge bosons. The coefficients of these operators are denoted C
BWe/Λ
4, C
BW/Λ
4,
C
W W/Λ
4and C
BB/Λ
4, as described in ref. [
56
]. The parameter Λ has the dimension of
mass and is associated with the energy scale of the new physics described by the EFT. The
95% CL limits on these EFT parameters displayed in table
9
are derived from the limits of
table
8
making use of a linear transformation relating the EFT and vertex function aTGC
parameters, obtained from ref. [
56
].
JHEP12(2018)010
Parameter
Limit 95% CL
Measured [TeV
−4]
Expected [TeV
−4]
C
e BW/Λ
4(
−1.1, 1.1)
(
−1.3, 1.3)
C
BW/Λ
4(
−0.65, 0.64)
(
−0.74, 0.74)
C
W W/Λ
4(
−2.3, 2.3)
(
−2.7, 2.7)
C
BB/Λ
4(
−0.24, 0.24)
(
−0.28, 0.27)
Table 9. Observed and expected one-dimensional 95% CL limits on the C
e BW/Λ
4, C
BW/Λ4,
CW W/Λ4and CBB/Λ4EFT parameters, assuming that any excess in data over the SM expectation
is due solely to a non-zero value of the parameter C
e BW/Λ
4, C
BW/Λ4, CW W/Λ4 or CBB/Λ4. For
each row, all parameters other than the one under study are set to 0.
7
Conclusion
The cross section for the production of a Z boson in association with an isolated high-energy
photon is measured using 36.1 fb
−1of pp collisions at
√
s = 13 TeV collected with the
ATLAS detector at the LHC. The analysis uses the invisible decay mode Z
→ ν ¯ν of the Z
boson, and is performed in a fiducial phase space closely matching the detector acceptance.
Kinematic distributions are presented in terms of differential cross sections as a
func-tion of the transverse energy of the photon, the missing transverse momentum, and the
jet multiplicity. Measurements are made for both the inclusive case, with no requirements
on the system recoiling against the Zγ pair, and the exclusive case in which no jets with
p
T> 50 GeV are allowed within
|η| < 4.5.
The results are compared with SM expectations derived from a parton shower Monte
Carlo generator (Sherpa) and from parton-level perturbative calculations carried out at
NNLO (Mcfm and Matrix). Good agreement is observed between the measured and
expected total and differential cross sections.
In the absence of significant deviations from SM expectations, the data are used to set
limits on anomalous couplings of photons and Z bosons. Limits on aTGCs are determined
using a modified SM Lagrangian that includes operators proportional to the h
V3and h
V4(V = Z or γ) parameters of the vertex function parameterization of aTGC contributions
to Zγ production. The limits are also transformed into limits on the C
e
BW
/Λ
4
, C
BW
/Λ
4,
C
W W/Λ
4and C
BB/Λ
4parameters of an effective field theory formulation of aTGC
ef-fects. The limits obtained from the current study are 3–7 times more stringent than those
available prior to this study.
Acknowledgments
We thank CERN for the very successful operation of the LHC, as well as the support staff
from our institutions without whom ATLAS could not be operated efficiently.
We acknowledge the support of ANPCyT, Argentina; YerPhI, Armenia; ARC,
Aus-tralia; BMWFW and FWF, Austria; ANAS, Azerbaijan; SSTC, Belarus; CNPq and
FAPESP, Brazil; NSERC, NRC and CFI, Canada; CERN; CONICYT, Chile; CAS, MOST
and NSFC, China; COLCIENCIAS, Colombia; MSMT CR, MPO CR and VSC CR,
JHEP12(2018)010
Czech Republic; DNRF and DNSRC, Denmark; IN2P3-CNRS, CEA-DRF/IRFU, France;
SRNSFG, Georgia; BMBF, HGF, and MPG, Germany; GSRT, Greece; RGC, Hong Kong
SAR, China; ISF and Benoziyo Center, Israel; INFN, Italy; MEXT and JSPS, Japan;
CNRST, Morocco; NWO, Netherlands; RCN, Norway; MNiSW and NCN, Poland; FCT,
Portugal; MNE/IFA, Romania; MES of Russia and NRC KI, Russian Federation; JINR;
MESTD, Serbia; MSSR, Slovakia; ARRS and MIZˇ
S, Slovenia; DST/NRF, South Africa;
MINECO, Spain; SRC and Wallenberg Foundation, Sweden; SERI, SNSF and Cantons of
Bern and Geneva, Switzerland; MOST, Taiwan; TAEK, Turkey; STFC, United Kingdom;
DOE and NSF, United States of America. In addition, individual groups and members have
received support from BCKDF, the Canada Council, CANARIE, CRC, Compute Canada,
FQRNT, and the Ontario Innovation Trust, Canada; EPLANET, ERC, ERDF, FP7,
Hori-zon 2020 and Marie Sk lodowska-Curie Actions, European Union; Investissements d’Avenir
Labex and Idex, ANR, R´
egion Auvergne and Fondation Partager le Savoir, France; DFG
and AvH Foundation, Germany; Herakleitos, Thales and Aristeia programmes co-financed
by EU-ESF and the Greek NSRF; BSF, GIF and Minerva, Israel; BRF, Norway; CERCA
Programme Generalitat de Catalunya, Generalitat Valenciana, Spain; the Royal Society
and Leverhulme Trust, United Kingdom.
The crucial computing support from all WLCG partners is acknowledged gratefully,
in particular from CERN, the ATLAS Tier-1 facilities at TRIUMF (Canada), NDGF
(Denmark, Norway, Sweden), CC-IN2P3 (France), KIT/GridKA (Germany), INFN-CNAF
(Italy), NL-T1 (Netherlands), PIC (Spain), ASGC (Taiwan), RAL (U.K.) and BNL
(U.S.A.), the Tier-2 facilities worldwide and large non-WLCG resource providers.
Ma-jor contributors of computing resources are listed in ref. [
57
].
Open Access.
This article is distributed under the terms of the Creative Commons
Attribution License (
CC-BY 4.0
), which permits any use, distribution and reproduction in
any medium, provided the original author(s) and source are credited.
References
[1] ATLAS collaboration, Measurement of W γ and Zγ production in proton-proton collisions at √s = 7 TeV with the ATLAS detector,JHEP 09 (2011) 072[arXiv:1106.1592] [
INSPIRE].
[2] ATLAS collaboration, Measurements of W γ and Zγ production in pp collisions at
√s = 7 TeV with the ATLAS detector at the LHC,Phys. Rev. D 87 (2013) 112003[Erratum ibid. D 91 (2015) 119901] [arXiv:1302.1283] [INSPIRE].
[3] CMS collaboration, Measurement of the Zγ production cross section in pp collisions at 8 TeV and search for anomalous triple gauge boson couplings,JHEP 04 (2015) 164
[arXiv:1502.05664] [INSPIRE].
[4] CMS collaboration, Measurement of the Zγ→ ν ¯νγ production cross section in pp collisions at√s = 8 TeV and limits on anomalous ZZγ and Zγγ trilinear gauge boson couplings,Phys. Lett. B 760 (2016) 448[arXiv:1602.07152] [INSPIRE].
[5] ATLAS collaboration, Measurements of Zγ and Zγγ production in pp collisions at
√s = 8 TeV with the ATLAS detector, Phys. Rev. D 93 (2016) 112002[arXiv:1604.05232] [INSPIRE].
![Table 6. Measured cross sections for Z(ν ¯ ν)γ production within the extended fiducial region for a centre-of-mass energy of √ s = 13 TeV, with corresponding SM expectations obtained from the Mcfm [ 47] generator at next-to-next-to-leading order in the str](https://thumb-eu.123doks.com/thumbv2/5dokorg/4221375.93006/15.892.195.699.123.288/measured-sections-production-extended-fiducial-corresponding-expectations-generator.webp)

