The Influence of Technology on Inclusive
Growth through Poverty Reduction
Master’s thesis within: Economics Trade & Policy Author: Marija Andonova - 8810032287
Tutor: Sara Johansson
Sofia Wixe Jönköping May 2015
Acknowledgements
I would like to thank my supervisor Sara Johansson and deputy supervisor Sofia Wixe for guiding me through the way of exploring inclusive growth concept. Their comments and recommendations were of profound meaning for achieving the aim of this thesis.
I also want to thank my colleague Thomas Nähle, as part of our small group, as well as my colleague Petya Petrova, for their valuable comments on further improving the thesis. Jönköping, May 2015
Master’s Thesis in Economics Trade & Policy
Title: The Influence of Technology on Inclusive Growth through Poverty Reduction
Author: Marija Andonova
Tutor: Sara Johansson
Sofia Wixe
Date: 2015-05-11
Subject terms: Inclusive Growth, Poverty, Technology, Infrastructure, Development
Abstract
In line with recent growth strategies as well as the achievement of Sustainable Develop-ment Goals, countries are faced with achieving sustainable and inclusive growth. While in-clusive growth is imposed as important task for countries to accomplish, its conceptualiza-tion is rather puzzling and demands more attenconceptualiza-tion. There is no consensus on the concept of inclusiveness and its major determinants let alone on how to operationalise it. Therefore, the aim of this thesis is to provide theoretical clarification of the concept and to investigate the influence of technology on inclusive growth, through the process of poverty reduction. In the first part of the thesis a discussion of the literature on inclusive growth is provided together with analysis of the different approaches used in the different definitions of the concept. This part finishes with overview on the empirical attempts to measuring inclusive growth. The second part of the thesis analyses the influence of technology access on inclu-sive growth, where the poverty reduction is the variable in focus. Regression analysis based on a cross-country data set including more then 100 developing countries indicates that technology access help to reduce poverty. The results show that economic infrastructure have negative correlation with poverty, although the explanatory variables are not robust to changes in poverty measures and changes in specifications.
Table of Contents
1
Introduction ... 1
2
Inclusive Growth - Theoretical Framework ... 3
2.1 From pro-poor to inclusive growth ...3
2.2 Different approaches in defining inclusive growth...3
2.3 Indicators and determinants of inclusive growth ...5
3
Technology and Inclusive Growth ... 10
3.1 The link between access to technology and inclusive growth ... 10
3.1.1 Economic infrastructure - ttheoretical implications from inclusive growth perspective ... 11
4
Empirical Model ... 14
4.1 Methodology ... 14
4.2 Description of variables ... 16
5
Results and Analysis ... 18
6
Conclusion ... 24
7
References ... 26
Figures
Figure 1 Growth, inequality and poverty in countries with low, meadium and high
HDI ...5
Figure 2 Inclusive growth framework ...8
Figure 3 The influence of technology on inclusive growth ... 10
Tables
Table 1 Measuring inclusiveness - different indicators and findings ...6Table 2 Description of variables ... 17
Table 3 OLS estimates on the effect of electricity access on poverty ... 19
Table 4 OLS estimates on the effect of roads on poverty ... 21
Table 5 OLS estimates on the effect of ICT on poverty ... 23
Table 6 Different approaches in defining inclusive growth concept ... 30
Table 7 Descriptive statistics ... 31
Table 8 Pearson correlation matrix ... 32
Appendices
Appendix 1 Different definitions of inclusive growth ... 30Appendix 2 Descriptive statistics ... 31
Appendix 3 Correlation matrix ... 32
Appendix 4 Relationship between dependent and independent variables ... 33
Appendix 5 List of countries by region ... 34
1
Introduction
The economic performance of countries has been rapidly improving throughout history and most of all in the previous century. Nearly all the countries in the world experience improved economic performance and increase in the income levels. However, an increase in the level of gross domestic product, does not by default imply a reduction in poverty as countries may still perform poorly in improving income equality as well as employment and educational opportunities.
In line with recent growth strategies (Europe, 2020; Strategy 2020; African Inclusive Growth Agenda) as well as acheiving Sustainable Development Goals (UN Genelar As-sembly, 2014a)1, countries are faced with targets of accomplishing smart, sustainable and inclusive growth, highlighted as key objectives and priorities to reach. While these concepts are clearly imposed as important task in front of countries, their conceptualization demands more attention. Аlthough, much have been said about sustainable growth and having in mind the growing theoretical body of smart growth (WCED, 1987; Redclift, 2005; Europe-an Commission, 2010; Foray, David & Hall, 2009; Barca, 2009), the term inclusive is fall-ing behind in theoretical clarification. Eventhough, there is a recent growfall-ing empirical and theoretical literature, there is no achieved consensus on the determinants of inclusive growth and how the concept may be operationalised. However, experts have emphasized that poverty can be reduced at a faster rate when inclusive growth strategies are applied and when special income distribution policies are undertaken (Chenery & Ahluwalia, 1974). This cаlls for further studies, that can improve poverty analysis and contribute to the de-sign of inclusive growth policies. This paper makes a contribution in that direction.
The first part of the paper surveys previous studies in terms of indicators of inclusive growth and its determinants. Despite of giving a theoretical framework to the term inclu-siveness, this part provides a discussion of the different concepts of inclusive growth, high-lights the most important content as well as differences and similarities between definitions. This part provides review on the empirical literature on the topic and analyses the different approaches in measuring inclusive growth.
The second part examines technology variables and their influence on inclusive growth for over 100 developing countries. Although, it is not consensual, the measure for inclusive-ness in this study is the commonly used measure for poverty, the headcount ratio. This var-iable is a measure of the percent of people living below international poverty line2 and rep-resents an incidence dimesion of poverty. Additionally, the influence of technology is test-ed on the poverty depth dimension, by introducing a second dependent variable that is the poverty gap. This variable gives poverty depth dimension throughout measuring the mean shortfall from the poverty line. The study uses poverty and inequality data, obtained from World Bank´s Povcal database. Access to technology is represented by economic infra-structure variables (McKiney, 2010): access to electricity, fixed lines and mobile subscrip-tions as a proxy for access to information and communication technology (ICT) and paved roads per kilometers as proxy for access to road infrastructure. The latest available data set on poverty and access to technology were combined and the year 2010 was chosen as the most suitable for cross-sectional analysis. The empirical model presented in this part pro-vides analysis on economic infrastructure on poverty incidence and poverty depth in
1 In Juli 2014, the UN General Assembly forwarded proposal of Sustainable Development Goals to achieve until 2020, as replacement of Millenium Development Goals that expire in 2015.
oping countries, according to UNDP classification3. Thereby, countries with low, medium and high Human Development Index (HDI) in 2010 are taken into consideration. Data used as proxy for access to technology were obtained from World Development Indicators Database and CIA World Factbook. The analysis includes 109 countries under investiga-tion of the main quesinvestiga-tion of considerainvestiga-tion, that is how access to technology influence in-clusivity of growth throughout the process of alleviating poverty in the developing coun-tries. The results show significant and negative relationship between technology, represent-ed through economic infrastructure and poverty.
However, results need to be interpreted with coution due to two main limitations of the study. The study recognizes that the headcount poverty ratio and poverty gap are not con-sensual measures of inclusive growth. The second one entails empirical issues in terms of the econometric methodology used in asserting the effect of technology on poverty. Name-ly, there is an effect of endogeneity, because of omitted variables, which causes biased and inconsistent estimates. Furthermore, reverse causality between technology and poverty may be taking place, which can not be addressed using cross-sectional analysis.
Nevertheless, the contribution of the study is multiple. Giving a conceptual framework of the term inclusiveness it contributes for explicating and clarifying the central proposition of the concept. Тhis is of main importance to the policymakers, especially now, that the tar-get is imposed for the countries and further clarification is missing. Although the paper is one of the many investigating the link between technology and poverty, its among the first one linking technology and invlusive growth. While testing the correlation between tech-nology accessibility and inclusiveness, I will try to point out the importance of the first one for the occurrence of the second. The study is giving an answer to the question whether technology, in terms of economic infrastructure, can be seen as an indicator for inclusive growth.
The first part of the thesis is devoted to investigate the concept and its main characteristics. The theorethical framework is developed in section 2, where the emergence of the concept is explained and different approaches in defining the concept. Then, a literature review on previous studies trying to assess the concept empirically is also provided. The second part of the thesis analyses how technology influence inclusive growth. Section 3 gives the main links between technology in terms of econometric infrastructure and inclusive growth. The empirical approach is explained in section 4, whereas the results and analysis are provided in section 5. Section 6 discusses the conclusion of the thesis and gives implications for further research.
3 UNDP classifies the countries as countries with low Human Development Index, which values range from
0.20-0.55. Countries with medium HDI have HDI between 0.55-0.70. High HDI countries are the ones in the rage of 0.70-0.80; and very High HDI countries have HDI of 0.80 and above. List of countries by HDI used in the study provided in Appendix 6.
2 Inclusive Growth – Theoretical Framework
This part gives insights of the appearance of the concept and its development into what it represents today. For this purpose, conceptualization of the pro-poor growth is provided as well as the main differences and mutual interactions between these two. Moreover, two dimensions of the concept of inclusive growth are high-lighted together with an assemblance of the characteristic features that it entails. The last part contains re-view on the literature of indicators and determinants of inclusive growth.
2.1
From pro-poor to inclusive growth
The term inclusive wаs first used in the beginning of the century when Kakwani and Pernia (2000) employed it to highlight the nature of what they considered to be an upgrade of the concept of pro-poor growth. The reference to it as “inclusive economic growth” intended to stress the particular attributes that make pro-poor growth distinct. These two terms should not be misused. Inclusive growth is at the same time a pro-poor growth whereas the oppo-site relation is not necessarily true (Ianchovichna & Lundstrom, 2009).
Speaking of the attributes that make growth inclusive, it should be noted that they differ according to the different concepts of the pro-poor growth that they are in line with. Namely, the growth can be pro-poor in absolute terms if this growth raises the incomes of poor people (regardless what happens with inequality). On the other hand, growth can be pro-poor in relative terms if the incomes of the poor people rise more than proportionally of the rise of total incomes, meaning inequality decreases (Zependa, 2004). While, some in-clusive growth definitions are interchangeable with the absolute pro-poor growth definition (Ravallion, 2004; Ianchoivicna & Lundstrom, 2009; Habito, 2009; Klasen 2010), most stud-ies acknowledge that reducing both, poverty and inequality is at the heart of the meaning of inclusive growth. (Ali & Son, 2007; Rauniyar & Kanbur, 2010; UNDP, 2013). However, these are not the only attributes that constitute the concept of inclusiveness.
While pro-poor growth is concerned mainly with poverty reduction, inclusive growth defi-nition evolved this concept by enhancing it and widening the focus. It is notable that while in the central concerns of the pro-poor concept are poverty (absolute definition) and ine-quality (relative definition), where the focus is on income levels and distribution (Kakwani & Pernia, 2000; Dollar & Kraay, 2002; Ravalion, 2004), most of the definitions of inclusive growth have incorporated non-income dimension into the pro-poor notion. And instead of constraining only to outcomes, inclusive growth incorporates the way through which de-velopment happens. The center of the concern is that in addition to imparting the benefits of growth, individuals should effectively take part and participate in the growth process (World Bank, 2008), while the benefits should be equally distributed to all of the partici-pants in the process of growth. Ramos and Ranieri (2013) explain the expansion of oppor-tunities for participation as complemental part of distributing the benefits equally.
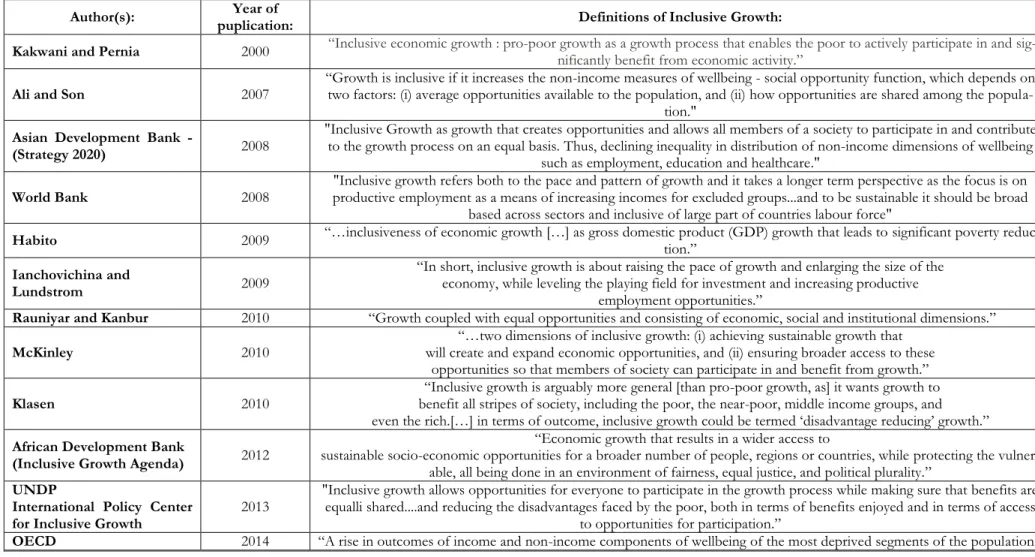
2.2 Different approaches in defining inclusive growth
A number of different аpproaches in defining inclusive growth are provided in Table 1. For better comprehension of the definitions, the study recognizes that the concept has two di-mensions. A process dimension, refering to participation and an outcome dimension that stands for benefit sharing. In terms of process, inclusion means including as many people as participants in the process as possible. It can be characterized as broad-based growth across sectors that includes non-discriminatory participation for businesses and individuals. In this context, inclusive growth is somewhat related to broad-based or labor-intensive growth (World Bank, 2008). Speaking in terms of outcome dimension, the difference
tween the alignment with the absolute or the relative definition of pro-poor growth be-comes visible. The outcome dimension in absolute terms would be decreasing poverty or number of people living below certain poverty line. In terms of outcome, using the relative definition, the growth would be inclusive if it benefited the poor more then it benefited the whole population. The later definition has been subjected to critiques that are discussed later in this section.
Depending on different initial levels of development across regions, the term is differently defined. The definition that the European Commision proposes entails fostering a high-employment economy that should deliver economic, social and territorial cohesion through investments in skills, fighting poverty and moderising labour markets and social protection systems (European Commission, 2010)4. Asian Development Bank, in the working paper Strategy 2020, emphasizes the three most important pillars of inclusivity: education, em-ployment and healthcare. Growth is inclusive if these three pillars are increasing together with an income measure such as GDP per capita (Asian Development Bank, 2008).5 Afri-can Development Bank recognizes: “wider access to sustainable socio-economic opportunities for a
broader number of people, regions or countries, while protecting the vulnerable, all being done in an envi-ronment of fairness, equal justice, and political plurality”. Here, the concept is widened to include political dimension that means supporting the voices and democratic accountability of the poorest and vulnerable groups (African Development Bank Group, 2012, p.2)6.
A summary of the different definitions existing in the literature points out that this type of economic performance should meet 4 requirements: increase in income measures, decrease in inequality, decrease in poverty, and increase in non-income measures of wellbeing, such as opportunities. The definitions mostly differ as to whether they are aligned to the abso-lute or relative pro-poor concept. Nevertheless, they all recognize that increasing the stand-ards of living of all, while including the poor into economic and social participation is the central proposition of the concept.
The first two requirements that should be met for achieving inclusive growth imply eco-nomic growth in income measures and increased equality in income distribution. Income distribution is usually represented by Gini index that measures the extent to which actual income distribution in a country deviates from perfect distribution. It takes values from 0 to 100 where 0 represents perfect equality among distribution and 100 is perfect inequality, meaning high Gini represents high inequality in the country.
The last two requirements in the literature are referred to as inclusive development (Klasen, 2010; McKinley, 2010; Rauniyar & Kanbur, 2010). It describes (but its not limited to) in-cluding the poor in the economic and social participation by providing job opportunities, investment on the education and providing improved healthcare. It is understood as activi-ties or projects that improve the living standards of people other then income measures. According to Rauniyar and Kanbur (2010), the concept includes human capital develop-ment, social capital development and increased gender equality. Human capital develop-ment refers to access to education, primary health care, and other essential services. Social capital development means increasing the opportunities of the poor to participate in deci-sion making and self-managed community services such as in creating community-based groups in microfinance, and natural resources management. Gender development involves
4 European Commission. (2010). Europe 2020 - A strategy for smart, sustainable and inclusive growth. 5 Asian Development Bank. (2008). Strategy 2020 – The Long Term Strategic Framework of the Asian
De-velopment Bank.
improving the status of women through promoting their participation in the development of society. Social protection addresses the vulnerabilities and risks of age, illness, disability, natural disasters, economic crises, and/or civil conflict (Rauniyar & Kanbur 2010).
For illustration of the importance of inclusive development on poverty, the figure provided below represents countries used in theempirical analysis and their macroeconomic perfor-mances in 2010. In the figure, the countries are plotted according to the first two require-ments of the concept, that are income growth and inequality7. The figure demonstrates that countries with low, medium and high Human Development Index performed nearly the same in growth and inequality measures, but the poverty in the countries with high HDI is smaller by half. This is due to the improved human development, which is only a part from inclusive development concept, yet plays a crucial role in poverty alleviation.
0 10 20 30 40 50
Low HDI Medium HDI High HDI
GDP growth % Gini index Poverty rate
Figure 1. Growth, inequality and poverty in countries with low, medium and high HDI
2.3. Indicators and determinants of inclusive growth
Measuring the inclusiveness has imposed a challenge in the literature, since the concept started to be minced. The number of studies measuring this type of growth is still limited and while the concepts they propose are far away from consensual, everyone of them con-tributes to exploring this term and providing new possibilities of measurement to be taken into account. Similarly to the definition process, the process of measurement has been quite complex as to the indicators used as well as to the results obtained. In the limited number or emprical studies, the orientation of the debate towards a more comprehensive definition/measure is notable, replicating that the center of the concept is decreasing pov-erty. The employment of different definitions of the concept in the empirical literature, contribute to different outcomes which should not be surprising. Table 1 sums the differ-ent indicators and findings in the recdiffer-ent empirical literature.
One of the earliest attempts to study the magnitude of inclusive growth among its most important constitutes is applied to the case of Philippines (Ali & Son, 2007). The proposed methodology is applied only to two measures which are 1) Employment and 2) Basic social
Table 1. Measuring inclusive growth - different indicators and findings
Title Author Publication year Indicator period Data Findings
Defining and Measuring Inclusive Growth: Applica-tion to the Philippines
Ifzal Ali and
Hyun H. Son 2007 Social opportunity curve 1998
Health services and benefits from basic infrastructure are not equally shared among population. Employment is unequally distributed among man and women.
Inclusive Growth Analytics: Framework and Applica-tion.
Ianchovichna and
Lundstrom 2009
Inclusive Growth
Analytical Framework 1960 - 2007
Application of the framework to Zambia: High indirect costs, market coordination failure, low access to sec-ondary and tertiary education and weak governance are the biggest factors that impede inclusiveness.
Inclusive Growth Criteria and Indicators: An Inclusive Growth Index for Diagnosis of Country Progress
Terry McKinley 2010 Inclusive Growth Index constructed of different
indicators 2005 - 2007
Conducted 5 Case studies in which IG index was calcu-lated.A score of 1-3 is regarded as unsatisfactory, 4-7 is satisfactory progress and score 8-10 is superior score. In the case studies Bangladesh IG index was 4.55; Cambo-dia: 5.05; InCambo-dia: 5.70; Indonesia: 4.40; Philippines: 3.80.
Measuring and Monitoring Inclusive Growth:
Multiple Definitions, Open Questions, and Some Con-structive Proposals
Stephan Klasen 2010 Model of analysis at pro-ject/program level NA
Inclusive growth model of project/program considers whether it reduces poverty and increases employment of people living bellow $2.50/day indicator (as direct and indirect beneficiaries). Does it reduce social disparities of non-income measures and promotes human capabili-ties and whether it delivers benefits beyond improve-ments in human capabilities.
Inclusive Growth Revisited: Measurement and Determinants Anand Rahul, Saurabh Mishra and Shanaka J. Peiris 2013 Estimated Inclusive growth income containing
level of income and index of income distribution
1970 - 2010 Macroeconomic stability, human capital, and structural changes are foundations for achieving inclusive growth.
Determining the Correlates of Poverty for Inclusive Growth in Africa. African Development Bank Work-ing paper
John C. Anyanwu 2013 Poverty headcount ratio 1980 - 2011
Income inequality, primary education, mineral rents, in-flation, and population increase poverty. Real per capita GDP and secondary education have negative effect on poverty. Trade openness has positive but insignificant effect.
services in: a) education, b) health service and c) infrastructure. In this study, the authors are measuring inclusiveness by calculating a social opportunity function, which depends on the average opportunities available to the population, and how opportunities are shared or distributed among different deciles of population. Results show that various opportunities, although increased, are not equally distributed among poor and between men and woman. By setting the opportunities in the center of the attention, the authors basically are measur-ing only the inclusive development dimension without introducmeasur-ing an income measure. Consequently, their estimation by this type of methodology is not fully comprehensive. More recently, Anand et al. (2013) use a panel regression on average 5 year data from 1970-2010 for 143 countries. It is the first paper to include growth of income and equity of dis-tribution into one measure. The dependent variable is the inclusive growth levels y* which are developed using framework of Ali and Son (2007), with the difference that the indicator is the income measure. The results show that macroeconomic stability, human capital and structural changes are the key determinants of inclusive growth in the emerging markets. This is one of the few studies connecting ICT8 and inclusive growth. The ICT variable was found to have negative but insignificant effect for which the authors suspect it is the con-sequence of lacking data of this type for the emerging economies.
Another attempt to identify the variables that promote inclusiveness is the study by Anyanwu (2013). He uses a number of different empirical models to examine the link be-tween poverty and other economic indicators. The OLS results were robust to the em-ployment of Feasible Generalised Least Squares (FGLS), two-stage Least Squares instru-mental variables (2SLS) and Generalised Methots of Moments Instruinstru-mental Variables (IV - GMM). The dependent variable is Poverty headcount ratio which is the percentage of the population living below $1.25 a day. The results show that higher levels of income inequali-ty, primary education, mineral rents, inflation, and higher level of population increase pov-erty. On the other hand, higher real per capita GDP, and secondary education have nega-tive effect on poverty. According to these model Trade openness is posinega-tively but insignifi-cantly correlated with the headcount. The paper does not include any variable as a proxy for technological access.
Ianchovichna and Lundstrom (2009) provide an analytical tool to assert inclusivity on a country basis. In their study they propose a framework to identify and prioritize country specific constraints to inclusive growth illustrated in Figure 1. The framework is applied to Zambia and results show that the main factors impeding inclusive growth are market and government failures. Coordination failures are especially severe for the poor who cannot afford the fixed cost associated with finding alternative sources for inputs. Weak govern-ance, in particular poor government effectiveness, is a factor behind the government fail-ures and is as such a major obstacle to inclusive growth.
Ianchovichna and Lundstrom (2009) also provide a discussion in terms of measurement of inclusiveness. They discuss the disadvantages of inclusive growth in line with relative pro-poor growth saying that the relative definition could prompt problematic results for both poor and non-poor households. For example, a society attempting to reach pro-poor growth under the relative definition would favor an outcome where average income growth
8 The variable was measured as total stock of ICT software and hardware-related investments as a share of to-tal capito-tal stock.
Figure 1. Inclusive growth framework
Source: Adapted from Ianchovichna and Lundstrom (2009)
is 2 percent of the whole population and 3 percent of the poor ones over an outcome of average growth rate of 6 percent where the income of poor grew by 4 percent. In this con-text they rely on the Department for International Development9 definition and emphase that when poverty reduction is the objective, then the аbsolute definition of pro- poor growth is the more relevant. In line with the claiming in the literature, the study is defining inclusiveness in absolute terms.
The same framework has been applied to Nicaragua in another study (Vargas, García & Escamilla, 2013). For this country, the impeding factors of inclusiveness stem manly from lack in human capital and bad infrastructure. The authors also found that there is a low provision of public goods, like transport infrastructure, access to electricity, water and sani-tation system. Among the other factors constraining inclusivity in Nicaragua are govern-ment failures (fragile fiscal situation, weak institutions and corruption) and market failures (little diversification of exports, inability of business to broaden production).
McKinley (2010) proposes different conceptual frameworks for measuring inclusive growth on a country level and on a project or programme level. He proposes estimation of Inclu-sive growth index which is constructed by different macroeconomic indicators to which different weights of importance are attached. Growth in income has been given the highest weight – 25%, rate of employment enters this index with 15% weight. Infrastructure,
9Department for International Development (2008) refers to the absolute definition of pro-poor growth in light of the
gether with poverty and inequality enter the index with 10% weights. Another indicators with smaller weights are health and nutrition, education, gender equality, social protection and sanitation and water.
However, Klasen (2010) claims that country-level indicators would be inreliable to assess how certain projects or programs lead to and impact inclusive growth. Therefore, he pro-poses an analytical framework to assert the inclusiveness of certain projects/programs. He explains that in this case the focus should be put on whether the project/programme aim to reduce absolute income poverty, increase the employment of poor people and remove social disparities among the poor as well as members from disadvantaged ethnic minorities, females, people with disabilities etc. Also it should be considered whether the pro-ject/program promote the human capacities in terms of health and education so that they are able to better contribute and benefit from economic growth and does the pro-ject/program is likely to deliver benefits in non-income dimensions above the improve-ments in human capacities such as: reductions in infant mortality, improved nutrition and social security, better social integration, improved housing, etc.
In terms of indicators, a summary of the empirical literature indicates that macroeconomic stability, structural changes and human capital are the main factors contributing to inclusive growth, whether inequality, population, and low educational attainment are the main fac-tors impeding inclusivity. The theoretical framework from Ianchovichna and Lundstrom (2009) points out that low social returns may arise from bad infrastructure, despite unfa-vourable geography and low human capital. Accessibility to technology and improved in-frastructure, is contributing to inclusive growth by utilizing the process of production and creating new job opportunities. Improved infrastructure also increases the returns to hu-man capital by increasing total factor productivity and leads to self-sustained growth in the long run (World Bank, 2008). On the other side, this type of technology "works" against the impeding factors of inclusive growth, equalising returns to labour and increase oppor-tunities through job creation.
On the grounds that previous empirical analysis stop at the point of determining the rela-tionship of technology (Anand et al., 2013), the main motives behind this research would be to account for this variable in the empirical analysis. As a measure of the poverty, the study has implemented the mainly used measure of poverty incidence that is the Headcount poverty ratio. The study takes into consideration White and Anderson (2001) critique on the headcount ratio, stating that it only measures the poverty of people "just around" the poverty line and does not give information about depth of poverty. In order to capture the influence of technology on the depth of an analysis of poverty gap is implemented in the empirical part. By the same token, it is following Adams and Page (2005) methodology of depicting the effect of remittances and migration on the different dimensions of poverty. Although the proposition may seem self evident, it has never been tested and analyzied from the inclusive growth perspective. By investigating how the access of technology leads to direct and indirect alleviation of poverty, the study reveals in what ways economic infra-structure influences inclusive growth and inclusive development.
3. Technology and Inclusive Growth
This section explicates the linkages between technology and inclusivity. It disentangles between the effects of economic and social infrastructure. Giving theoretical foundations the most important implications economic infrastructure are provided through linking empirical studies and their inference from inclusive growth and inclusive development perspectives.
3.1 The link between access to technology and inclusive growth
The more recent type of economic models of the endogenous growth literature by Romer (1990), Grossman and Helpman (1991) and Aghion and Howitt (1992), all share the char-acteristic that a technology is crucial for economic growth and that continued increase in the level of resources spent on the creation of new technologies leads to a continued in-crease in economic growth.
The development practitioners today, tend to emphasize the importance of reliable and af-fordable technology and infrastructure for reducing poverty and its contribution in the achievement of Millenium Development Goals. However, it should be stressed that access to technology is not a goal in itself, since technology is a mean for achieving development goals decreasing poverty and increasing opportunities (Pigato, 2001).
Both, economic and social infrastructure, are crucial ingredients for the concept of inclu-sive growth. Economic or “hard” infrastructure refers to the large physical networks nec-essary for functioning of a modern industrial nation: transporting and water infrastructure, electricity and communication infrastructure and facilities. It brings about economic devel-opment. Social or “soft” infrastructure refers to institutions required to maintain health, cultural and social standards of a country, financial system, education system, health care system, government, law enforcement. Social infrastructure brings about human develop-ment.
Figure 2: The influence of technology on inclusive growth Prepared by author Inclusive growth Electricity Health Technology Social infrastructure Transportation Comunicaton Education Housing Economic infrastructure Inclusive development
However, it should be noticeable that there are interactions and interdependences among economic and social infrastructure that can affect the outcome in terms of inclusive growth. Namely, as the access of economic infrastructure is a fundament for further im-provement of social infrastructure, the advancement of the later also affects the former. For example, the level of education affects how people use technology and on the other side, technology access improves education (Norris, Sullivan, Poirot & Soloway, 2003). Although, acknowledged, the causal links between social and economic infrastructure are not the focus of the study, but rather how economic infrastructure affects inclusive growth throughout poverty alleviation. It is also observable that the concept of inclusive develop-ment, involves human capital development and social capital development (health and edu-cation), but is not limited to. As previously explained, the concept also includes employ-ment, gender development and social protection (Raynar & Kanbur, 2010)10.
One possible option for explaining the influence of this type of technology and inclusive growth is if we use the knowledge and experience together with vast empirical body stating that this type of technology is:
Increasing growth;
Reducing poverty;
Inducing opportunities and improving the standards of living.
By simply applying analogous reasoning, we have incentive to state our hypothesis that technology, in this case economic infrastructure, can create inclusive development and in-clusive growth.
3.1.1 Economic infrastructure – theoretical implications from inclusive growth perspective
There are many macroeconomic studies that have tried to empirically link public infrastruc-ture investments to economic growth (Aschauer, 1989; Canning & Bennathan, 2000; Straub & Terada-Hagiwara, 2011). For the case of economic infrastructure, studies show that investment in their quantity, as well as quality, contributes positively to economic growth (Calderón, 2009;Xueliang, 2013). In addition, studies show that infrastructure in-vestment reduces inequality (Calderón & Servén, 2004a). In fact, good transport network reduces transport costs, road congestion and promotes industrial development throughout the country. The supply of electricity, on the other hand, is believed to be a fundamental requirement for economic and social development (Kanagawa & Nakata, 2008). Communi-cation technologies through the supply of information enable the society to accommodate and appropriately manage economic information in order to increase overall welfare (Suregeni, 2008).
There is a widely debated issue in the literature on the subject whether policies that aim to increase growth are decreasig poverty at the same time (Dollar & Kraay, 2002; Ghura, Leite & Tsangarides, 2002). Thereafter, this study is closely investigating the direct link between economic growth and poverty alleviation that stems from access to technology, in develop-ing countries context. In order for all the requirements for inclusive growth to be met, it is
10 Gender development involves improving the stаtus of women through health and welfare programs and promoting their participation in the development of society. Social protection addresses the vulnerabilities and risks of age, illness, disability, natural disasters, economic crises or civil conflict.
also important to assess how and whether economic infrastructure promote equality and increase opportunities for all, with the emphasis on the poor and disadvantaged groups. This study focuses on three types of technology, represented as economic infrastructure as explained in the previous section. Although, economic infrastructure is not limited only to transport, electricity and ICT infrastructure, the analysis provided below investigates the linkages between these three types of technology and how they affect inclusivity through poverty alleviation.
According to Kingombe (2012), transport projects, in particular rural ones, are more con-cerned with progress and performance monitoring rather then impact assessment, over the last decades. Project management finds it easier to organize and support baseline studies than fund and support follow up surveys. A lot of transport related poverty assess-ments are not done because of the time lag between the project and the effects11. However, it is evident that despite reducing transportation costs, improved road infrastructure also reduces the costs of consumption and production of goods and services (BIDS, 2004). With easier access to markets and technology, improved roads expand farm and non-farm production through increased availability of relevant inputs and lower input costs (Binswanger, Khandker & Rosenzweig, 1993; Jacoby, 2000). A study for road development in Bankgladesh (Khandker, Bakht & Koolwal, 2009) explicates that improved road infra-structure led to improved education and health, including women and girls. Road-related studies have also suggested that household consumption is likely to get a boost from in-creased household income and consequently reduced poverty (BIDS, 2004; Fan, Hazell & Thorat, 2000). Khandker et al. (2006) point out that rural road investments has led to high-er secondary school enrollment as compared to primary school enrollment and that road investments are pro-poor, meaning that they have benefited the poor disproportionately higher than the non–poor. Furthermore, transport disadvantage and transport poverty, as explained by Lucas (2012), is the main factor for social and economic exclusion.
Electricity is by itself, not a solution for the economic and social problems facing develop-ing regions, although, the supply of electricity is believed to be a necessary requirement for economic and social development. Research show that electricity service appears to be one of the most important services for improving the welfare of the poor individual through the promotion of opportunities and increased standards of living (World Bank, 2001; WEO, 2012). This is because energy services have an effect on productivity, health, education, safe water and communication services (Human Development Report, 2007/2008). According to the Department for International Development (DfID, 2002), for one of the MDGs, gender equality and women's empowerment, energy access im-provement directly contributes to freeing up women and girls from time-consuming housework such as laundry and cleaning by utilization of electricity. In addition, through reduction of time-consuming chores and attainment of energy services, it has indirect con-tributions for women to have the opportunity to attend schools or educational activities as well as to take part in the labor market or establish small enterprises. As a result, gender equality and empowerment of women are promoted.
Accesses to information and communication technologies, such as telephones, fax, inter-net, are providing knowledge to people in various levels regarding socio, political and
11 The stimulus of rural road investment on cotton production took seven years to emerge in eastern Zambia (Kingombe, 2012). Another study found that the range and availability of goods, services, employment and changes in primary school completion rates took six years to become statistically significant changes in Vi-etnam (Mu & Van De Walle, 2007).
nomic events happening around them. Although, using different proxies for access to in-formation, a vast empirical body found negative relationship between access to telecom-munication technology and poverty. Poverty is not only a state of lack of income but also a deficiency of information needed in to make appropriate living choices (OECD, 2005). Therefore, access to ICT alleviates poverty in many directions. Direct impacts involve im-proved education and educational tools in developing regions (Kenny, 2002), impact on health through improved medical information flow (ITU, 1999) and on productivity and income generation through access to market information (Suregeni, 2008). Using a cross-coutry empirical analysis, Suregeni (2008) shows that information capability of women12 has higher negative correlation with poverty then income level, unemployment and inequality, for 70 developing countries. Having in mind that in these countries women belong to dis-advantaged groups, investing in them would represent inclusive investment and would promote faster rate of growth, as suggested by the results.
Adapting a cross-sectional empirical model, this study is investigating the relationship be-tween the level of economic infrastructure and the incidence as well as depth of poverty.
12 Information capability of women is estimated by transforming fertility rate values instead of literacy rate which the author explains are not the perfect measure for access to information of women.
4. Empirical Model
This section explains the empirical approach used to address the second part of the research question. It contains theoretical motivation behind the methodology used in asserting the relationship between different technology variables and inclusivity. Additionally, description of data as well as definitions of the variables used in the model are provided.
4.1 Methodology
The headcount ratio as a proposed measure of inclusive growth is in line with the absolute definition of inclusiveness (DFID, 2004) as well as proposed measure of inclusive growth from an outcome perspective. This index was also suggested by Rauniyar and Kanbur (2010), as giving the “degree of poverty aversion”. As they claim, for a given level of average in-come, inclusiveness can be measured simply by the degree of poverty (Rauniyar & Kanbur, 2010). White and Anderson (2002) point a critique to the usage of the poverty headcount ratio, stating that it only measures the poverty of people “just around” the poverty line and gives little to no information about the depth of poverty and the gap between the estimated poverty line and the poorest in the country.
The empirical estimation consists of multiple regression equations where the correlation between economic infrastructure variables and poverty are examined. In line with the gen-eral understanding and motivated by the critics of the indicator, the empirical model uses both the poverty headcount (as a measure of poverty incidence) and the poverty gap (as a measure of poverty depth).
The empirical model used in the estimation is based on the basic growth–poverty model suggested by Ravallion (1997) and Ravallion and Chen (1997), as well as the frameworks posited by Dollar and Kraay (2002), Ghura, Leite and Tsangarides (2002)13. Controlling for income level and its distribution, the relationship between certain variable and poverty is investigated.
By using the basic growth-poverty model, this study investigates the links between access to technology and poverty. Access to technology is represented by three different variables, namely, access to electricity, total network of paved roads per kilometers of total roads and the number of fixed and mobile subscriptions per capita. The model also implements re-gional dummies in order to account for the impact on poverty of unobservable rere-gional specific factors. The dummies have been constructed following the World´s Bank classifi-cation of countries by six different regions. To avoid dummy variable trap, one dummy variable was omitted, representing the countries for Sub- Sahara Africa.
Controlling for income level and its distribution, the correlation between technology and poverty is being investigated, with and without the inclusion of the regional dummies. Fur-thermore, additional control variable that is secondary education is included in the model14. The effect of technology variables on poverty then is estimated controlling for both, re-gional effects and secondary education. Estimating the same equations on the poverty gap is giving information about the influence of these variables on the depth of poverty. Due to
13 For empirical works using this model, see Agénor (2004), Islam (2004), Adams and Page (2005), Anyanwu and Erhijakpor (2010, 2012);
14 To better reflect the influence of technology on poverty, various additional control variable were imple-mented, such as population, trade oppeness and employment rate. Because of their statistical insignificance in the model and the robustness of other coefficients on their inclusion, they were not included in the fur-ther analysis.
correlation between explanatory variables, not all variables are included in same specifica-tion.
The full model of the estimated relationship between the three different explanatory varia-bles and poverty is presented in equations 1, 2 and 3. Equation 1 represents the linkages between poverty and electricity whereas the second equation is used to asses the ship between poverty and road infrastructure. Equation 3 describes the estimated relation-ship between poverty and ICT.
log Pi = αi + β1 log(yi) +β2 log (gi) + β3 log(ei) + β4 log(eli) + β5 D1 + ... +β9 D5 + εi (1) (i = 1,…….,N)
log Pi = αi + β1 log(yi) +β2 log (gi) + β3 log(ei) + β4 log(ri) + β5 D1 + ... +β9 D5 + εi (2) (i = 1,…….,N)
log Pi = αi + β1 log(yi) +β2 log (gi) + β3 log(ei) + β4 log(icti) + β5 D1 + ... +β9 D5 + εi (3) (i = 1,…….,N)
In the equations above, P is the measure of poverty in country i, α is a constant parameter, β1 is the growth elasticity of poverty with respect to income given by Y. β2 is the elasticity of poverty with respect to income inequality given by the Gini coefficient, whereas β3 is the elasticity of poverty with respect to the additional control variable – education. β4 is the elasticity of poverty with respect to one of the variables of interest, such as, the elasticity of poverty to electricity, roads and ICT in Equation 1, 2 and 3, respectfully. D is a symbol that stands for the 5 regional dummies that are included in the full model and ε represents the error term. Because the empirical model uses two different poverty measures, that are pov-erty headcount and povpov-erty gap, the same equations are also estimated with respect to the poverty gap as dependent variable.
The estimated results of the links between these variables to the poverty headcount ratio are presented in the first 3 specifications in all three tables (Table 3, 4 and 5), whereas the last three specifications (specification 3-6) show the results of the estimated relationship be-tween the variables of interest and the poverty gap.
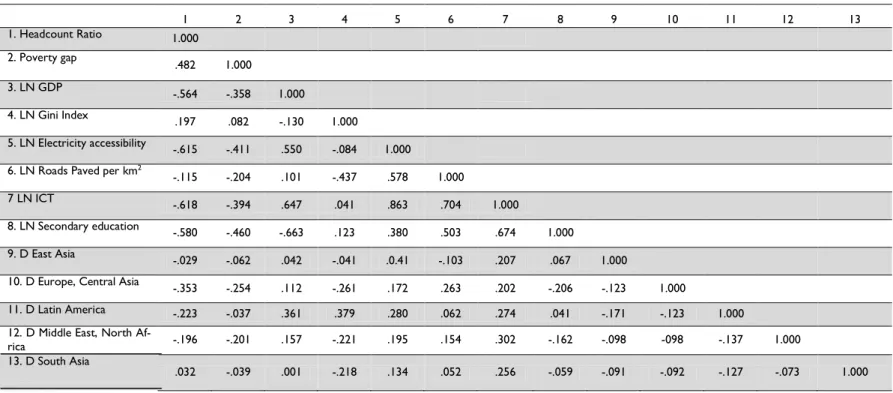
From the correlation matrix provided in Appendix 3, multicollinearity is observable, mean-ing that the technology variables are highly correlated. As explained before, this is the rea-son why the variables are tested in different specifications.
Heteroscedasticity violates the assumptions of constant variances for different observa-tions of the error term, thus leading to bias standard errors. The Breuch- Pagan test for heteroscedasticity pointed on presence of heteroscedasticity in the model, since the null hypothesis was rejected. Therefore, all the estimations are made using heteroscedasticity-consistent standard errors.
A diagnostic check for normality of the distribution of the error terms was also performed according to which non-normal distribution of the errors was observed in all the regres-sions.
The relationship between both of the dependent variables and each of the independents are plotted and presented in Appendix 4.
4.1. Description of variables
The dependent variables used in this model are two different poverty measures, that are poverty headcount ratio and poverty gap. Headcount ratio is the relation between number of people living bellow certain level of income, referred as poverty line, and the total popu-lation in the country. This level of income is estimated after the main expenses for food and shelter as well as non-food consumption is extracted from the total income. Interna-tional poverty lines are also adjusted for inflation over years, in order to remain constant in real terms and to enable meaningful comparison of poverty over time. The study from Ravalion and Chen (2008) used improved price data from the 2005 International Compari-son Program to adjust for change of prices in cost of living, and suggested a new poverty threshold at $1,25 dollars a day, according to 2005 Purchasing Power Parity. From 2008 this poverty line is internationally accepted and used until today (previous poverty line was $1 and $1.08 dollars a day). This line is also representing the mean of the national poverty lines for the poorest 15 countries in the world15.
Poverty gap is a measure for depth of poverty that is the amount of income by which the average income of the poor falls short of the poverty line. It is estimated with reference to a certain poverty line used, so in this model the poverty gap is estimated at $1.25 a day poverty line. The poverty gap is expressed as a percentage of the poverty headcount ratio. For instance, a poverty gap of 5% means that the poor have an expenditure shortfall of 5% of the poverty line. Another interpretation is that on average poor person´s income are 95% of the poverty line. The measure is also referred to as the cost of eliminating poverty, since it shows how much would have to be transferred to the poor to bring their income up to the poverty line.
The explanatory variables are access to electricity, ICT and roads. The variable access to electricity, available for only 2 years by the World Bank, represents percentage of the popu-lation with access to electricity. Electricity access, refers to the situation where people can acquire modern sources of energy at affordable prices (Kanagawa & Nakata, 2008). ICT variable is a proxy for communication technology in my model and it is also representing communication infrastructure. It is a sum of fixed line and mobile phone subscriptions. Fixed telephone lines are those that connect a subscribers terminal equipment to the public switched telephone network (PSTN). Mobile cellular telephone subscriptions are those that provide access to PSTN using cellular technology. Having advanced communication infra-structure and technology implies decreased costs and more available subscriptions to socie-ty through lower prices. Since there is no existing indicator for access to roads, the network of paved roads is taken as a proxy for transport infrastructure. The same logic follows, meaning if transport infrastructure is advanced and developed, there will be longer and denser road network implying higher access of roads to the people.
The standard control variables used in the basic growth model are income and inequality. Real Gross Domestic Product as an income measure represents the level of income earned by the population. The Gini index represents measurement of inequality through measuring income distribution of a country's residents. This number, which ranges between 0 and 1, is based on residents' net income and helps to define the gap between the rich and the poor.
15 A country might have unique, national poverty line or separate poverty lines for urban and rural areas, as well as different geographic areas, in order to better reflrect differences in costs of living.
Secondary education is used as additional control variable to reflect possible interdepend-ences between usage of technology and level of education16.
Table 2 presented below, supplies full definitions of variables employed in the empirical model and thir sources, extended with the expected signs from each explanatory variable. Except from the variable roads, the other variables representing access to technology are expressed in per capita terms.
Table 2: Description of variables
16 As found in the empirical study of Anyanwu (2013), as well as proposed by Tilak (2007), secondary and higher education are more relevant for poverty reduction than primary education.
Variable Definition Source Expected sign
Poverty headcount Ratio
Log of poverty headcount
ra-tio is the percentage of popula-tion living on less than 1.25 a day at 2005 international pric-es.
PovcalNet data base (World Bank)
Poverty gap
The mean shortfall of incomes from the poverty line (count-ing the nonpoor as hav(count-ing ze-ro shortfall), expressed as a percentage of the poverty line.
PovcalNet data base (World Bank)
Access to
electricity Percentage of population with access to electricity. World Development Indictors (World Bank) Negative Roads, paved per
km
Total network of paved roads
per kilometers of total roads. CIA World Fact Book World Development Indictors (World Bank)
Negative
ICT per capita
Fixed lines: sum of active number of analogue fixed tel-ephone lines, (VoIP) subscrip-tions, fixed wireless local sub-scriptions and fixed public payphones.
Mobile subscriptions: number of postpaid and active prepaid accounts.
World Development Indictors
(World Bank) Negative
Income
Gross Domestic Product per capita converted to interna-tional dollars using purchasing power parity rates.
World Development Indictors
(World Bank) Negative
Gini index
Measure of income distribu-tion. The extent to which the distribution of income deviates from a perfect distribution.
World Development Indictors
(World Bank) Positive
Secondary
Education Total enrollment in secondary education, regardless of age. World Development Indictors (World Bank) Negative Regional dummies
East Asia, Europe and Central Asia, Latin America, Middle East and North Africa, South Asia. Sub-Sahara Africa is the omitted regional dummy.
5. Results and Analysis
This part presents the results of the empirical calculation on the link between technology and inclusive growth. The relation between technology and poverty are provided and discussed, looking at economic infra-structure on more dissaggregated levels. The correlates of economic infrainfra-structure are analyzed in terms of in-cidence of poverty as well as its depth. Different specifications are used to capture additional effects on poverty of other macroeconomic indicators.
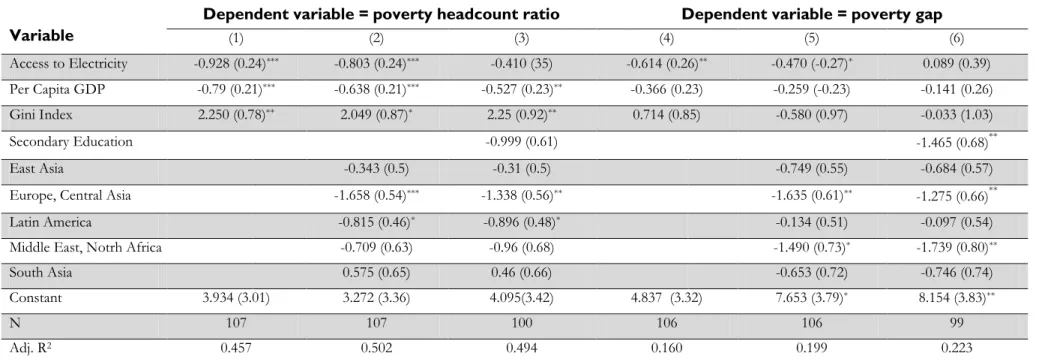
The results obtained on the linkages between poverty and three variables of interest are presented in three different tables. Table 3 shows the outcome of the estimated relation-ship between poverty and access to electricity. Table 4 presents the correlations between poverty and roads, whereas the relationship between poverty and ICT is presented in table 5. Different specifications are used in each table in order to capture the influence of tech-nology on different dimensions of poverty. As stated before, the first 3 specifications demonstrate the effect of technology on the incidence of poverty, and the last three speci-fications demonstrate the linkages between technology variables and the depth of poverty. Furthermore, specification 1 and 4 in all three tables, presents the outcome of the estimat-ed basic growth-poverty model, where the effect of certain variable of interest and poverty is shown by controlling for income and inequality. The second and fifth specification are estimated including only reagional fixed effects, whereas specification 3 and 6 in all tables control for both, education and fixed effects. Thereafter, the estimation of the full model is represented in specifications 3 and 6 in every table. Considering the fact that the variables are expressed in logs, the coefficients are interpreted as elasticities.
Table 3 shows the results where Equation (1) is estimated using OLS. In the first two specifications all signs obtained are as expected. Furthermore, income level and Gini index are highly statistically significant and the variable access to electricity is also signifi-cant (Table 3, specification 1 and 2). The negative coefficient implys that the access to elec-tricity is negatively correlated with the number of people living below poverty line, which is expected. The results, however, reveal lower elasticity of headcount poverty rate with re-spect to electricity access when unobservable region-fixed effects are included into the specification (Table 3, specification 2). This implies that unobservable regional effects were reflected in some part of the electricity coefficient, which eventually becomes smaller but still negative and statistically significant.
The previous results are not robust on the inclusion of secondary education as additional control variable in the third specification (Table 3, specification 3). Although, not signifi-cant, the inclusion of education changed the statistical significance of the objective variable. It is observable that the coefficient of access to electricity falls immensely and becomes insignificant. As it can be seen from the results, neither access to electricity nor education perform as expected when both included in the same specification.
The results differ with the chаnge of the poverty measure. The next three specifications in the table demonstrate the effect of electricity access on the depth of poverty (Table 3, spec-ification 4-6). Access to electricity is found to have negative and statistically significant ef-fect on the poverty gap, when controlling for income level and distribution (specification 4). The negative and significant relationship stays robust on the inclusion of regional fixed effects (specification 5). This means that access to electricity proves to be significantly in-fluencing the depth of poverty, even when controling for unobservable regional fixed ef-fects. However, when controlling for both, fixed effects and education, the coefficient of electricity becomes insignificant (specification 6). The only variable with statistical signifi-cance in specification 6 is secondary education, implying that larger number of people
Table 3: OLS estimates of the effects of electricity accessibility on poverty
Variable
Dependent variable = poverty headcount ratio Dependent variable = poverty gap
(1) (2) (3) (4) (5) (6) Access to Electricity -0.928 (0.24)*** -0.803 (0.24)*** -0.410 (35) -0.614 (0.26)** -0.470 (-0.27)* 0.089 (0.39) Per Capita GDP -0.79 (0.21)*** -0.638 (0.21)*** -0.527 (0.23)** -0.366 (0.23) -0.259 (-0.23) -0.141 (0.26) Gini Index 2.250 (0.78)** 2.049 (0.87)* 2.25 (0.92)** 0.714 (0.85) -0.580 (0.97) -0.033 (1.03) Secondary Education -0.999 (0.61) -1.465 (0.68)** East Asia -0.343 (0.5) -0.31 (0.5) -0.749 (0.55) -0.684 (0.57)
Europe, Central Asia -1.658 (0.54)*** -1.338 (0.56)** -1.635 (0.61)** -1.275 (0.66)**
Latin America -0.815 (0.46)* -0.896 (0.48)* -0.134 (0.51) -0.097 (0.54)
Middle East, Notrh Africa -0.709 (0.63) -0.96 (0.68) -1.490 (0.73)* -1.739 (0.80)**
South Asia 0.575 (0.65) 0.46 (0.66) -0.653 (0.72) -0.746 (0.74)
Constant 3.934 (3.01) 3.272 (3.36) 4.095(3.42) 4.837 (3.32) 7.653 (3.79)* 8.154 (3.83)**
N 107 107 100 106 106 99
Adj. R2 0.457 0.502 0.494 0.160 0.199 0.223
Notes : All the variables are in logs. Estimates are made using robust standard errors. Standard errors shown in parenthesis. Number of observations reduced in the table be-cause of missing values.
*Significant at the 0.10 level **Significant at the 0.05 level ***Significant at 0.01 level
with secondary education is correlated with smaller poverty gap in the countries, as ex-pected. The statistical insignificance of income and its distribution on the poverty gap, in every specification, are rather unexpected results (Table 3, specification 4-6).
The results obtained from the estimation of the full model on access to electricity on pov-erty, are in line with previous empirical studies that did not find significance on both, elec-tricity nor education on the poverty headcount (Suregeni, 2005). Previous studies have pointed out some neutral, even negative impacts of electricity on poverty. Rural electrifica-tion is considered to have little or no impact on agricultural productivity in Indonesia ow-ing to high connection costs, unclear land use rights, extremely low income levels, restrict-ed crrestrict-edit access, and low potential for agricultural improvements. Therefore, many house-holds opt not to connect to available electric power supply in this country (Ali & Pernia, 2003) . This is further explained by the fact that electrification infrastructure opens up op-portunities to those who have a minimum amount of income, as a required threshold and therefore are better placed to take advantage of technology for poverty alleviation (Jalilian & Wies, 2004).
The results obtained on the estimated relationship between roads and poverty are shown in Table 4. In the first three specifications, the signs of the coefficients demonstrate the ex-pected negative relation between this poverty measure and roads infrastructure (Table 4, specification 1-3). The correlation between road infrastructure and poverty headcount ra-tio is statistically significant and negative in every specificara-tion. The results are in line with previous studies on the relationship between road infrtastructure and poverty allevia-tion (Jalilian & Wies, 2004; Khander et al., 2006). The coefficient is slightly reduced when the regional fixed effects are included. As the output shows, these results are robust to the inclusion of the additional control variable accounting for secondary education, but then the coefficient of roads have decreased by nearly one half (Table 4, specification 3). As ex-pected, the larger network of paved roads is negatively correlated with poverty as estimated by the full model (Equation 2).
An intriguing finding here, is that the correlation between transport infrastructure and poverty is even higher when the poverty measure is the poverty gap. (Table 4, specification 4-6). This means that although, the total network of paved roads negatively affects the inci-dence of poverty, it has an even higher negative influence on the depth of poverty. The co-efficient representing roads is robust to the inclusion of the regional dummies and the addi-tional control for secondary education. This can be further explained by the fact that the required threshold of income and/or human capital for exploiting opportunities brough by roads is lower.
The findings are in line with previous studies claiming that road infrastructure have higher effect on social and economic exclusion (and through this channel affecting the depth of poverty) then on the levels of income (Lucas, 2012; Xueliang, 2013). However, the lower value of Adjusted R2, in this model,should not be neglected, demonstrating lower
explana-tory power of the variables used in the model on the poverty gap. Income level and distri-bution are again proved to be insignificant on the depth of poverty.
Table 5 displays the estimated relationship between access to ICT and poverty. From the table we observe noticeable influence of access to communication technology on poverty incidence (specification 1) that is somehow decreased when regional fixed effects are in-cluded and controlling for secondary education (specification 2 and 3, respectively). In this
Table 4: OLS estimates of the effects of paved roads on poverty
Variable
Dependent variable = poverty headcount ratio Dependent variable = poverty gap
(1) (2) (3) (4) (5) (6)
Roads, paved per km -0.209 (0.08)** -0.207 (0.08)** -0.111 (0.09)* -0.306 (0.08)** -0.274 (0.09)** -0.227 (0.10)**
Per Capita GDP -1.236 (0.17)*** -0.957 (0.18)*** -0.617 (0.23)** -0.575 (0.17)*** -0.397 (0.19)** -0.163 (0.24)
Gini Index 2.591 (0.81)*** 2.52 (0.88)** 2.538(0.89)** 0.662 (0.81) -0.266 (0.94) -0.108 (0.99)
Secondary Education -1.272 (0.48)** -0.929 (0.52)*
East Asia -0.574 (0.5) -0.402 (0.51) -0.898 (0.53)* -0.788 (0.55)
Europe, Central Asia -1.615 (0.56)*** -1.352 (0.57)** -1.359 (0.59)** -1.051 (0.62)*
Latin America -1.155 (0.46)** -1.024 (0.48)** -0.308 (0.48) -0.133 (0.52)
Middle East, Notrh Africa -0.84 (0.64) -1.0129 (0.67) -1.378 (0.68)* -1.561 (0.72)**
South Asia 0.719 (0.69) 0.579 (0.68) 0.122 (0.73) 0.151 (0.75)
Constant 2.125 (3.09) 0.495 (3.47) 3.025 (3.52) 2.497 (3.18) 4.979 (3.7) 6.316 (3.81)
N 107 107 100 106 106 99
Adj. R2 0.417 0.479 0.496 0.216 0.245 0.265
Notes : All the variables are in logs. Estimates are made using robust standard errors. Standard errors shown in parenthesis. Number of observations reduced in the table be-cause of missing values.
*Significant at the 0.10 level **Significant at the 0.05 level ***Significant at 0.01 level