Results from the genetic analyses performed
on feces samples from bears in Västerbotten
County, Sweden.
Part II Population Estimate
Report number 2006-3 from the Scandinavian Brown Bear Project
by Jonas Kindberg and Jon E. Swenson
Population estimate of brown bears in Västerbotten
This is the second report from the bear scat collection survey in Västerbotten 2004. Regarding methods and genetic analysis see “Results from the genetic analyses
performed on feces samples from bears in Västerbotten County, Sweden”, 2006 from the Laboratoire D’ecologie Alpine, Grenoble.
The geographical consistency of the results was verified for individual bears that were characterized by more than 1 fecal sample and those that had a genotype that was
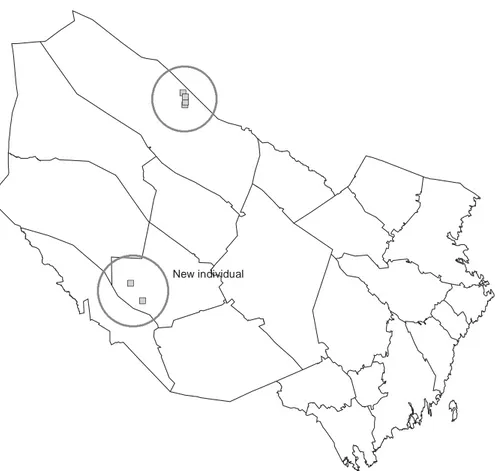
classified as “close to” other genotypes. The coordinates of those samples were plotted in GIS and checked visually. Of the samples we found to be geographically far away from the “same genotype samples”, we found only one that we considered to be a new
individual (figure 1); a female with two locations far from the other samples. As a result we conclude that 223 unique individuals were found during the feces collections and analysis (140 males and 83 females). We would expect a skewed sex ratio, because many of the bears in the län are in an area of expansion. However, results from Dalarna and Gävleborg in 2001 showed that this method may not correctly estimate the population sex ratio.
For the population estimate we used the MARK estimator (based on a capture mark recapture (CMR) principle). Identical multilocus genotypes were grouped and a “capture” and “recapture” history was compiled for each individual by dividing the dataset into 12 weekly sampling periods (only the weeks with an adequate sample size for estimating population size were considered). If an individual’s feces were “captured” two or more times within the same capture period, only one capture was considered.
The data were analyzed with the open-capture models of MARK (POPAN). A set of a priori models was developed, analyzed, and then ranked by AICc (Akaike’s information criterion corrected for small sample size) values following analysis in the program MARK. The MARK estimate give a population size of 272 (min 254, max 299) bears in Västerbotten 2004.
Estimation of real function parameters from the MARK program:
95% Confidence
Interval
Parameter Estimate Standard Error Lower Upper
Apparent survival (F) 0.47 0.03 0.42 0.53 Apparent survival (M) 0.51 0.02 0.46 0.55 Probability of recapture 0.83 0.01 0.82 0.85 Population estimate (F) 101 5 94 113 Population estimate (M) 171 6 160 186
The high recapture probability shows that a high proportion of the population has been sampled. However, when considering the population size estimates for males and
New individual
Figure 1. Sample locations of brown bear genotype F36. The two southern samples were categorized as a new individual based on the large distance between the positions and the fact that the bear was a female, which move much less than males.