INVESTIGATION OF THE EFFECTS OF
INTRODUCING HYDRODYNAMIC
PARAMETERS INTO A KINETIC
BIOMASS GASIFICATION MODEL FOR
A BUBBLING FLUIDIZED BED
Master of Science Thesis
DANIEL ANDERSSON
MARTIN KARLSSON
School of Business, Society and Engineering Course: Degree Project
Course code: ERA400 Subject: Energy Engineering HE credits: 30 credits
Programme: M.Sc. programme in Energy
Supervisor: Guilnaz Mirmoshtaghi Rebei Bel Fdhila Examiner: Eva Thorin
Principals: Mälardalen University Date: 2014-10-22
Email: dan09002@student.mdh.se mkn09019@student.mdh.se
i
ABSTRACT
Biomass is an alternative to fossil fuels that has a lower impact on the environment and is thus of great interest to replace fossil fuels for energy production. There are several technologies to convert the stored energy in biomass into useful energy and this thesis focuses on the process of gasification. The purpose of this thesis is to investigate how the prediction accuracy of gas composition in a kinetic model for fluidized bed gasifier is affected when hydrodynamic parameters are introduced into the model. Two fluidized bed gasifier models has therefore been set up in order to evaluate the affects: one model which only considers the kinetics of a gasifier and a second model which includes both the kinetics and the hydrodynamic parameters for a bubbling fluidized bed. The kinetic model is represented by an already existing kinetic model that is originally derived for a downdraft gasifier which has quite similar biomass gasification processes as fluidized bed gasifiers. Gas residence time differs between the two gasifier types and the model has thus been calibrated by introducing a time correction factor in order to use it for fluidized bed gasifiers and get optimum results. Two sets of experimental data were used for comparison between the two models. The models were compared by comparing the results of the predicted gas composition yield and the amount of unreacted carbon after the reactor at various equivalence ratios (ER).
The result shows that the model that only considers reaction kinetics yields best agreement with the experimental data that have been used. One reasons as to why the kinetic model gives a better prediction of gas composition is due to the fact that there are higher reactant concentrations available for chemical reactions in the kinetic, in comparison to the combined model. Less reactant concentrations in the combined model is a result of the bed in the combined model consisting of two phases, according to the two-phase theory of fluidization that have been adapted. Both phases contain gases but the bubble phase is considered solid free, chemical reactions occur therefore only in the emulsion phase since the kinetic model is based on gas-solid reactions. The model that only contains reaction kinetics considers only one phase and all concentrations are available for chemical reactions. Higher char conversion is thus achieved in the model that only contains reaction kinetics and higher gas concentrations are produced.
Keywords: Gasification, Gasifier, Biomass, Bubbling fluidized beds, MATLAB, Reaction kinetics, Hydrodynamics, Two-phase theory of fluidization
Nyckelord: Förgasning, förgasare, biomassa, bubblande fluidiserade bäddar, MATLAB, reaktionskinetik, hydrodynamik, två-fas teorin av fluidisering
ii
PREFACE
This is a master thesis, written at Mälardalen University Västerås Sweden during the spring of 2014. The thesis is a part of a research project at Mälardalen University which focuses primarily on fluidized beds. The work began with a literature study to understand the processes that takes place in a bubbling fluidized bed gasifier and the work continued with studying existing models that have been published. Modelling was carried out in the programming language and computing environment MATLAB and input data for the models and results from them were processed in Microsoft Excel. The workload has been equally divided between the authors and the programming has mainly been carried out by Daniel. It has been a very intense but highly interesting and instructive period of our lives whilst we wrote this thesis. To accomplish a result with this thesis we have been dependent on several persons to whom we would like to express our gratitude towards.
We are very grateful to our supervisor, Guilnaz Mirmoshtaghi, for her generous help, advising and guidance during this study.
We also want to give special tanks to our co-supervisor Rebei Bel Fdhila for supplying us with lots of good advice during the thesis.
We gratefully acknowledge Simone Pedrazzi and Giulio Allesina, at University of Modena and Reggio Emilia, for taking their time to guide us and provide us with advice when solving the mathematical problems that we encountered in the kinetic model.
iii
SAMMANFATTNING
Biomassa är ett alternativ till fossila bränslen som har lägre inverkan på miljön och är därför ett mycket intressant bränsle till att ersätta fossila bränslen med. Det finns flera olika alternativ att konvertera den energi som är lagrad i biomassa till användbar energi och i det här examensarbetet kommer förgasning som är ett populärt sätt att höja kvalitet och värdet på råvaran att stå i fokus. Den producerade gasen har många användningsområden, gasen kan exempelvis användas som bränsle till gasturbiner eller för syntetisering till drivmedel eller framställning av kemiska produkter. Förgasningen kan ske i olika typer av förgasare och en typ av förgasare som ökat i intresse och som har intressanta egenskaper är bubblande fluidiserade bädd (BFB)-förgasare. Denna typ av förgasare är bränsleflexibel och tekniken lämpar sig väl för uppskalning. Syftet med det här examensarbetet är att undersöka hur den förutspådda gaskompositionen från en kinetikmodell för en BFB-förgasare påverkas utav att hydrodynamiska parametrar för bädden inkluderas i modellen. Två modeller för BFB-förgasare har konstruerats i programmeringsspråket MATLAB för att kunna utvärdera detta: en modell som endast är uppbyggd av kemiska reaktionskinetiska samband för en förgasare och en kombinerad modell som inkluderar både kinetik och hydrodynamiska parametrar för en bubblande fluidiserande bädd. Kinetik modellen är baserad på en redan existerande modell som från början är härledd för en medströmsförgasare, vilken innehåller kemiska reaktioner som liknar de som sker i en BFB-förgasare för biomassa. Uppehållstiden för gasen genom reaktorn skiljer sig dock mellan de två olika förgasningstyperna och därför har modellen kalibrerats genom att introducera en korrektionsfaktor för att modellen skall fungera för en bubblande fluidiserande bädd-förgasare och ge optimala resultat.
Två olika uppsättningar av experimentell data har använts i jämförelsen mellan de två olika modellerna. Modellerna jämfördes genom att jämföra resultatet från den förutspådda gaskompositionen och oreagerad kol som finns vid utloppet från förgasaren vid olika ekvivalenskvoter (ER).
Resultatet visar att modellen som endast tar hänsyn till kinetiken ger bäst överenstämmelse med den experimentell data som användes vid jämförelsen. En möjlig orsak till varför kinetikmodellen förutspår gaskompositionen bättre än den kombinerade modellen beror på att det finns högre koncentrationer av reaktanter tillgängligt för kemiska reaktioner i kinetikmodellen. Anledningen till varför det finns lägre koncentrationer av reaktanter i den kombinerade modellen beror på att bädden i denna modell antas vara uppbyggd av två olika faser enligt två-fas teorin av fluidisering. Båda dessa faser innehåller gaser, men den så kallade bubbelfasen antas vara fri från fasta partiklar. Därför sker kemiska reaktioner endast i den andra fasen eftersom kinetikmodellen endast tar hänsyn till reaktioner mellan gaser och solida partiklar. Modellen som endast innehåller kinetik antas endast vara uppbyggd av en fas, vilket gör att alla reaktanter är tillgängliga för att delta i kemiska reaktioner, högre andel av det kol som finns närvarande i förgasaren kan konverteras och högre gaskoncentrationer produceras. Om gas till gas reaktioner implementeras i kinetikmodellen så är det möjligt att främst den kombinerade modellen ger bättre överensstämmelse med experimentell data.
TABLE OF CONTENTS
1 INTRODUCTION ...1
1.1 Purpose ... 2
1.2 Scope and Limitations ... 2
2 LITERATURE REVIEW ...3 2.1 Biomass ... 3 2.1.1 Properties of Biomass ... 3 2.2 Gasification ... 4 2.2.1 Drying ... 4 2.2.2 Pyrolysis ... 5 2.2.3 Gasification ... 5 2.2.4 Combustion ... 5 2.2.5 Equivalence Ratio ... 5 2.3 Fundamentals of Fluidization ... 5 2.3.1 Fluidized-Bed Gasifier ... 6
2.3.2 Bubbling Fluidized-Bed Gasifier ... 6
2.3.3 Fluidization Regimes ... 7
2.3.4 Geldart’s Classification of Powders ... 8
2.3.5 Minimum Fluidization Velocity ... 9
2.3.6 Terminal Velocity ...11
2.4 Bubbling Fluidized Beds ...12
2.4.1 The Two-Phase Theory of Fluidization ...12
2.4.2 Bubbles in Fluidized Beds ...13
2.4.3 Bubble Rise Velocity ...15
2.4.4 Fraction of Bed in Bubble Phase ...16
2.4.5 Bed Height ...16
2.4.6 Freeboard ...17
2.4.7 Gas Transfer between the Fluidized-bed Phases ...18
2.5 BFB Hydrodynamic Models ...20
2.5.1 Bubbling Bed Model ...20
2.5.2 Bubble Assemblage Model...20
2.6 Aspen Plus ...21
2.7 Classification of Fluidized Bed Gasification Models ...21
2.7.1 Computational Fluid-Dynamic Models (CFDM) ...21
2.7.3 Fluidization Models (FM) ...22
3 METHOD ... 23
4 HYDRODYNAMIC VALIDATION AND GASIFIER MODELING ... 23
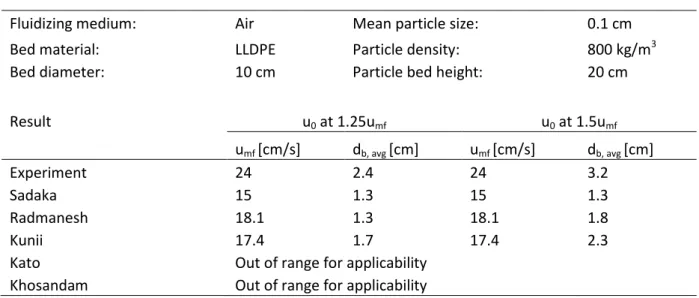
4.1 Validation of Hydrodynamic Models ...23
4.2 M1 – Kinetic Model ...26
4.2.1 Assumptions ...26
4.2.2 Mathematical Model ...27
4.2.3 Calibration of Kinetic Model...32
4.3 M2 – BFB Gasifier Model ...38
4.3.1 Assumptions ...39
4.3.2 Mathematical One-dimensional Model ...40
5 RESULTS ... 45
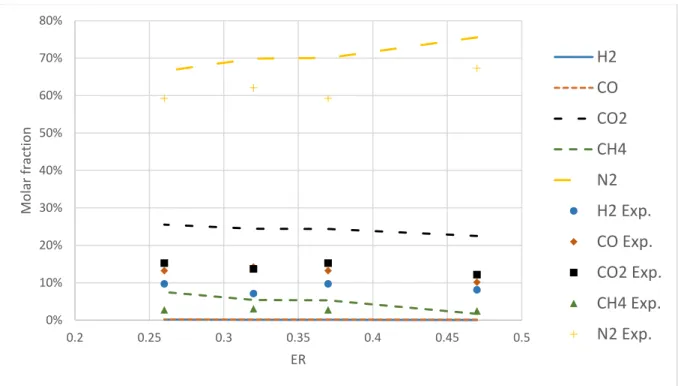
5.1 Narváez et al. ...46
5.2 Turn et al. ...48
6 DISCUSSION... 49
7 CONCLUSIONS ... 50
8 SUGGESTIONS FOR FURTHER WORK ... 51
APPENDICES
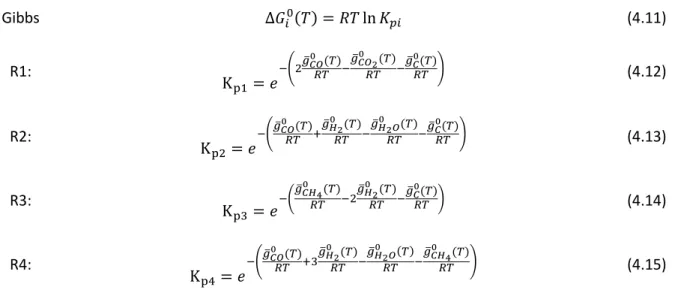
APPENDIX A. EQUILIBRIUM CONSTANTS
APPENDIX B. MOLECULAR WEIGHT
APPENDIX C. VISCOSITY AND TEMPERATURE RELATION FOR GAS SPECIES
APPENDIX D. M1 AND M2 COMPARISON NARVÁEZ ET AL.
APPENDIX E. M1 AND M2 COMPARISON TURN ET AL.
APPENDIX F. AVERAGE OEJ WITH DIFFERENT TIME CORRECTION FACTORS
APPENDIX G. MATLAB CODE FOR KINETIC MODEL (M1)
APPENDIX H. MATLAB CODE FOR GASIFIER MODEL (M2)
LIST OF FIGURES AND TABLES
Figure 1. Bubbling fluidized-bed biomass gasifier ... 7 Figure 2. Different fluidization regimes. Adapted from Kunii and Levenspiel [3]. ... 8 Figure 3. Geldart's classification of particles for ambient air conditions. Note that operating conditions above ambient may make powders appear in a different group than at ambient condition [13]. Reprinted from Fluidization Engineering, 2nd edition, Daizo Kunii and Octave Levenspiel, Fluidization and Mapping of Regimes, 61-94, Copyright (1991), with permission from Elsevier. ... 9 Figure 4. Schematic of bubble, cloud, wake and emulsion ...14 Figure 5. Bed height at different fluidization conditions, left is bed at rest, middle is at minimum fluidization and the right is at bubbling bed condition. Reprinted with permission from Kunii and Levenspiel [30]. Copyright (1990) American Chemical Society. ... 17 Figure 6. Different approaches to divide bubble, cloud and emulsion into separate and merged regions. Adapted from Kunii and Levenspiel [11]. ...19 Figure 7. Computational algorithm of M1 ... 31 Figure 8. Overall error in predicting composition of all major species ... 33 Figure 9. Overall error in predicting composition of all major species for all ER-values with different time correction factors ... 34 Figure 10. Molar fraction of species at different ER-values with no time correction factor.... 34 Figure 11. Molar fraction of species at different ER-values with a time correction factor of 160
... 35 Figure 12. Overall error in predicting composition of all major species ... 36
Figure 13. Overall error in predicting composition of all major species for all ER-values with
different time correction factors ... 37
Figure 14. Molar fraction of species at different ER-values with no time correction factor .... 37
Figure 15. Molar fraction of species at different ER-values with a time correction factor of 48 ... 38
Figure 16. Compartment structure of the model ... 39
Figure 17. Computational algorithm of M2 ... 44
Figure 18. Accuracy of the models before and after calibration. The kinetic model have also been executed with data from an experiment on a downdraft gasifier conducted by Dogru et al. [49]. The numbers in the parantheses in the legend represents time correction factors that have been used. Number one represents that no correction factor have been used. ... 45
Figure 19. Accuracy of the models in predicting the gas composition with data from Narváez et al. ... 46
Figure 20. Accuracy of the models in predicting gas composition with data from Narváez et al. ... 47
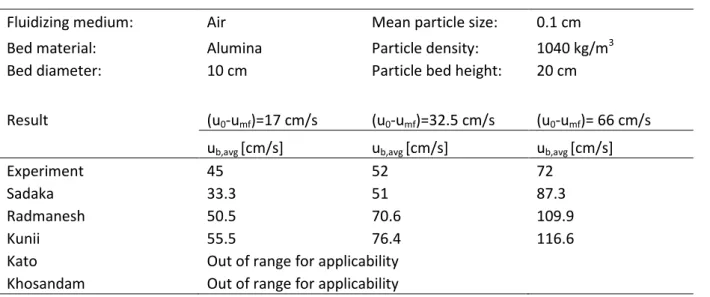
Figure 21. Accuracy of the models in predicting gas composition with data from Turn et al. 48 Figure C-1. Viscosity of gas species Table 1. Result from validating models for 𝑢𝑚𝑓 and 𝑑𝑏, 𝑎𝑣𝑔 towards data extracted from Vikrant et al. [38] ... 24
Table 2. Result from validating models for 𝑢𝑏, 𝑎𝑣𝑔 towards data extracted from Vikrant et al. [38] ... 25
Table 3. Apparent rate constants [4]. Reprinted from kinetic model of biomass gasification, vol 51, Y. Wang and C.M. Kinoshita, pages 19-25, copyright(1993), with permission from Elsevier. ... 28
Table 4. Adsorption constants ... 29
Table 5. Input to kinetic model ,derived from Narváez et al. [44] ... 33
Table 6. Input data to kinetic model, derived from Turn et al. [45] ... 36
Table 7. Hydrodynamic parameters used in this study ... 43
Table A-1. Values of the constants used to calculate equilibrium constants for temperature range 1000 – 5000 K [50]. Reprinted from equilibrium and kinetic modeling of char reduction in a downdraft biomass gasifier: A comparsion, vol 82, Avdesh kr. Sharma, pages 918-928, copyright (2008), with permission from Elsevier
Table B-1. Molecular weight of species considered
Table D-1. Model and experimental gas compositions at ER 0.37, Narvaéz et al. Table E-1. Model and experimental gas compositions at ER 0.37, Turn et al.
NOMENCLATURE
Designation Symbol Unit
Decay constant 𝑎 m-1
Cross section area 𝐴𝑐 m2
Pre-exponential factor 𝐴𝑖 s-1
Archimedes number 𝐴𝑟
Concentration of A in the gas bubble 𝐶𝐴𝑏 mol/m3
Concentration of A in the cloud-wake region 𝐶𝐴𝑐 mol/m3
Concentration of A in the emulsion phase 𝐶𝐴𝑒 mol/m3
Drag coefficient 𝐶𝐷
Bubble diameter 𝑑𝑏 m
Average bubble diameter 𝑑𝑏,𝑎𝑣𝑔 m
Particle diameter 𝑑𝑝 m
Mean particle diameter 𝑑̅𝑝 m
Diameter of char particles 𝑑𝑝,𝑐 cm
Molecular diffusion coefficient of gas 𝐷 m2/s
Bed diameter 𝐷𝑡 m
Activation energy 𝐸𝑎𝑖 kJ/mol
Standard gravity 𝑔 m/s2
Gibbs function of ith species 𝑔̅𝑖0 kJ/kmol
Average visible volumetric bubble flow 𝐺𝑏 m3/s
Bed height ℎ m
Gas interchange coefficient between bubble
and cloud wake region 𝐾𝑏𝑐 s-1
Apparent rate constant 𝑘𝑎𝑖 cm
Gas interchange coefficient between bubble
and emulsion phase 𝐾𝑏𝑒 s-1
Gas interchange coefficient between cloud
wake region and emulsion phase 𝐾𝑐𝑒 s-1
Adsorption constant 𝐾 Pa-1
Bed height at of bubbling condition 𝐿𝑓 m
Bed height at rest 𝐿𝑚 m
Bed height at minimum fluidization 𝐿𝑚𝑓 m
Mass flow 𝑚 g/s
Mass 𝑀 kg
Molecular weight 𝑀𝑊 g/mol
Number of moles of component A 𝑁𝐴 mol
Molar flow rate 𝑛̇𝑗 mol/s
Number of moles 𝑛𝑗 mol/s
Overall error predicting composition of species 𝑂𝐸𝑗
Universal gas constant 𝑅 J/mol, K or kJ/kmol,K Reynolds number for particles at minimum 𝑅𝑒𝑝,𝑚𝑓
fluidization
Absolute temperature 𝑇 K
Superficial gas velocity 𝑢0 m/s
Bubble rise velocity 𝑢𝑏 m/s
Rise velocity of an isolated bubble 𝑢𝑏𝑟 m/s
Rise velocity of emulsion gas 𝑢𝑒 m/s
Minimum fluidization velocity 𝑢𝑚𝑓 m/s
Terminal velocity 𝑢𝑡 m/s
Net reaction rate 𝜈𝑖 mol of ith species/
mol biomass,s
Volume of bubble phase 𝑉𝑏 m3
Molar number of species 𝑥𝑗 mol of ith species/
mol biomass
Initial mole of carbon 𝑥1,0 mol of ith species/
mol biomass
Height above bed in freeboard 𝑧 m
Pressure drop Δ𝑃 Pa
Fraction of bed occupied by bubbles 𝛿 Voidage of bed at bubbling fluidization 𝜖𝑓
Voidage of freeboard 𝜖𝑓𝑏
Voidage of bed at rest 𝜖𝑚
Minimum fluidization voidage 𝜖𝑚𝑓
Number of species 𝜃
Viscosity of gas mixture 𝜇𝑔 kg/m, s
Density of char particles 𝜌𝑐 g/cm3
Density of gas mixture 𝜌𝑔 kg/m3
Density of solid 𝜌𝑠 kg/m3
Experimental value 𝜏𝑗,𝑒𝑥𝑝
Predicted value 𝜏𝑗,𝑝𝑟𝑒𝑑
Subscripts Species 𝑗 Reaction 𝑖 Gas 𝑔 Solid 𝑠 Minimum fluidization 𝑚𝑓 Bubble 𝑏 Emulsion 𝑒 Carbon (C) 1 Hydrogen (H2) 2
Carbon monoxide (CO) 3
Water (H2O) 4
Carbon dioxide (CO2) 5
Methane (CH4) 6
Nitrogen (N2) 7
ABBREVIATIONS AND TERMS
BBM Black-box models
BFB Bubbling fluidized bed
CCBM Countercurrent backmixing
CFB Circulating fluidized bed
CFD Computational fluid-dynamics
CFDM Computational fluid-dynamic models
FBG Fluidized bed gasifier
ER Equivalence ratio
FB Fluidized bed
FBG Fluidized bed gasifier
FM Fluidization models
K-L Kunii-Levenspiel
LLDPE Low linear density polyethylene
M1 Model 1
M2 Model 2
1
INTRODUCTION
World’s primary energy use is supplied by fossil fuels that are finite resources with adverse environmental impacts. An alternative fuel to fossil fuels is biomass that has lower environmental impacts and potential to supply large amounts of energy. In contrast to fossil fuels, biomass is also a renewable and sustainable fuel that is obtained from biological materials, such as wood, wood waste, charcoal and agricultural residues. The chemical energy in biomass fuels can be released or converted by three main thermochemical conversion methods: combustion, pyrolysis and gasification. Gasification is an energy efficient process to produce a gaseous mixture through partial thermal oxidation of biomass. This mixture is mainly composed of carbon monoxide (CO), hydrogen (H2), carbon dioxide (CO2) and traces
of methane (CH4). The produced gaseous mixture, often called synthesis gas, can be used for
heat production, generation of electrical power and further processed into chemicals or transport fuels. Gasification processes are carried out in gasifiers that can be of different types, a relative old technology that has increased in interest to gasify biomass are fluidized bed (FB) gasifiers due to the concern for climate change. Two main types of FB gasifiers in use are circulating fluidized beds (CFB) and bubbling fluidized beds (BFB). The oldest commercial application of a BFB gasifier was developed by Fritz Winkler in 1921 and the synthesis gas produced from oxidation of coal was used to power gas engines. Advantages of fluidized beds include good gas-solids contact, excellent heat transfer characteristics and fuel flexibility, thereby being applicable to be used with biomass fuels that can differ greatly in both chemical and physical properties [1,2].
Modell development is a great tool if there is an interest of how a process works and when more knowledge of a process is wanted in order to understand how a process works in more detail and how it might behave during different run conditions by changing e.g. pressure or temperature. A model of a certain process as in this thesis a bubbling fluidized gasifier can provide good knowledge of how a gasifier might behave and how the different physical aspects works during operation.
The majority of published gasification models deals with coal gasification that includes both kinetic and hydrodynamic parameters. However, hydrodynamic models are commonly not included in the few published gasification models that deals with biomass. The existing models of biomass gasification in fluidized beds have been reviewed by Gómez-Barea and Leckner [3]. The hydrodynamic parameters affect both mass and heat transfer and this work will therefore investigate how the reaction kinetics in a fluidized bed gasifier is affected by including hydrodynamic parameters.
Two models are set up in this thesis, one model (M1) consisting of an already existing kinetic model for biomass gasification that is based on the work done by Wang and Kinoshita [4]. The second model (M2) consists of the kinetic model from M1 combined with a hydrodynamic model. The hydrodynamic model is created from work done by Kunii and Levenspiel [5]. Hydrodynamic models by Kato and Wen [6], Radmanesh et al. [7], Khosandam et al. [8], and Sadaka et al. [9] have also been reviewed before the decision to
models are all based on the two-phase theory but differ in assumptions and these models have been validated with the data that have been found. The aim of this thesis is to evaluate if the gas composition prediction of the kinetic model is improved when taking the hydrodynamics into account along with the kinetic reactions throughout the fluidized bed. The models are modelled in the computer software MATLAB.
1.1
Purpose
This thesis will describe the term “fluidization” in gasifiers by studying and comparing different models for the fluidization mechanism in bubbling fluidized bed gasifiers. The purpose is to investigate if the kinetic model accuracy in terms of predicting composition of produced gas will be improved by including a model that describes the hydrodynamics of fluidized beds. The two models will be implemented into the computer software MATLAB and results from the models will be validated and calibrated towards existing experimental data.
1.2
Scope and Limitations
The data for validation are retrieved from literature
Only bubbling fluidized beds are considered in this thesis and circulating fluidized beds are thereby excluded.
Main focus of the literature review has been put into hydrodynamic models that are based on the two-phase theory of fluidization.
2
LITERATURE REVIEW
The purpose with this part of the thesis is to give an understanding of how fluidization and gasification in bubbling fluidized beds works. Knowledge is retrieved and collected by studying available literature and published models on fluidized beds, biomass and coal gasification.
2.1
Biomass
Biomass is a carbonaceous biological material derived from living, or recently living species such as plants and animals. Biomass that is used for energy production is often plant based material such as wood and agriculture products. Biomass can however equally apply to both animal and vegetable derived material. Fossil fuels takes millions of years to form and this is not the case for biomass since plants use sunlight through photosynthesis to grow, biomass is considered as a renewable energy source. [2]
When biomass is burned it releases carbon dioxide to the atmosphere as all fuel types does, however, as biomass grows through photosynthesis it has to absorb carbon dioxide from the atmosphere. Biomass is thus considered to be a “carbon-neutral” fuel since any burning of biomass does not add to the Earth´s carbon dioxide inventory. [2]
Downsides of biomass are that it is bulky and cannot be stored, handled and transported with ease, such as gas or liquid fuels. This motivates the conversion of solid biomass into liquid or gaseous fuels with biochemical and/or thermochemical (e.g. gasification) processes for later use as energy or vehicle fuel. In the thermochemical conversion process the entire biomass is converted into gases for later use in chemical production or as a fuel in e.g. a power plant for energy production. [1]
2.1.1
Properties of Biomass
Biomass is beside carbon, also composed of hydrogen, oxygen, nitrogen and also small traces of compounds, e.g. alkali and heavy metals. There are some properties of biomass that may have significant effect on the performance of gasifiers, such as moisture content, ash content, volatile compounds and particle size. [10]
Fuels that contain moisture contents above 30% can make ignition difficult and the moisture reduces the calorific value of the product gas due to the need of evaporating the excess moisture in the fuels. A high level of moisture together with CO produces H2 by the water gas
shift reaction which gives an increased level of H2 in the gas produced in the gasifier. An
increased level of H2 in the gasifier will produce more CH4 by direct hydrogenation. The
higher concentrations of H2 and CH4 in the product gas in the gasifier does not compensate
for the energy loss for the moisture evaporation and yields a lower calorific value of the product gas. [10]
Fuels with ash content above 5% can become a problem during gasification due to that the oxidation temperature is often above the melting point of the biomass ash. The problem is often clinkering and is especially a problem when the biomass ash contain high amounts of alkali oxides and salts. [10]
Volatile matter of biomass is the part of the biomass that is released as gaseous matter when biomass is heated. When biomass is heated it starts to decompose into volatile gases and solid char. Biomass has high volatile matter content, sometime up to 80%, compared with coal that has less than 20% of volatile matter content. [11]
2.2
Gasification
Gasification means incomplete combustion of a carbonaceous material and the reactions takes place in an oxygen-deficient environment that requires heat. Gasification yields a mixture of gases that is called synthesis gas or product gas, which consists primarily of carbon monoxide (CO), hydrogen (H2) and traces of methane (CH4). [12]
Gasification and combustion are two thermochemical related processes, however, there is an important difference between them. Gasification converts solid or liquid feedstock into useful and convenient gaseous fuel or chemicals that can be burned to release energy or to produce chemicals by packing energy into chemical bonds in the synthesis gas. Gasification strips away carbon from the feedstock and instead adds hydrogen to it to produce gases with a higher hydrogen-to-carbon- ratio. Combustion on the other hand breaks the chemical bonds and releases the energy by oxidizing the hydrogen and carbon into water and carbon dioxide. [2]
Biomass gasification processes includes typically the following steps that will be briefly discussed:
Drying Pyrolysis
Partial combustion of some gases, vapours, and char Gasification of decomposition products
2.2.1
Drying
Moisture content in biomass ranges from 30 to 60% but can reach to as high as 90% (e.g. cattle manure 88% and Water Hyacinth 95.3%). Water in biomass takes away extra energy from the gasifier when it has to be vaporised and this energy is not recoverable, therefore can biomass with high moisture content be a concern for energy applications. The moisture content of biomass is between 10 to 20% in most gasification systems in order to produce a synthesis gas with reasonably high heating value. Drying of biomass is thus required for the most biomass fuels before they can be gasified. As biomass enters the gasifier it will become completely dried as it receives heat from the bed material. [2]
2.2.2
Pyrolysis
Pyrolysis involves the thermal breakdown of larger hydrocarbon molecules of biomass into smaller gas molecules with no major chemical reaction with any gasifying medium. Tar is an important product of pyrolysis that are made of hydrocarbons and free carbon, and is formed through condensation of the condensable vapours produced in the process. Tar can however become a great deal of difficulty when the gasification product is used in industries. [2]
2.2.3
Gasification
Gasification follows the pyrolysis process and involves chemical reactions among the hydrocarbons in fuel, steam, carbon dioxide, oxygen and hydrogen in the reactor, and chemical reactions among the produced gas. Char gasification is the most important reaction in the gasification stage. Char produced through pyrolysis of biomass does not have to be pure carbon, instead it can contain a certain amount of hydrocarbon including hydrogen and oxygen. [2]
2.2.4
Combustion
Gasification reactions are most of the time endothermic (i.e. heat absorbing). However, a certain amount of exothermic (i.e. heat releasing) (combustion reaction) is allowed in gasifiers in order to provide the required heat of reaction (unless the heat required is not provided externally) for heating, drying and pyrolysis. [2]
2.2.5
Equivalence Ratio
Equivalence Ratio (ER) is defined as the ratio between the actual oxidant/fuel ratio and the stoichiometric oxidant/fuel ratio. The reactor performance is greatly affected by this parameter.
2.3
Fundamentals of Fluidization
Fluidization is a process in which a gas or liquid is blown upwards through a bed of solid particles that are forced to behave like a fluid. If the velocity of the upward stream is high enough, the solid particles will become suspended in the gas or liquid and the bed is hence fluidized. [13]
Unusual characteristics are inherited by fluidization and fluidized beds are one of the best used contacting methods due to the high surface area between fluid and solid per unit bed volume. The particles are well mixed and generate thus low temperature differences within the particles. [13]
Fluidized beds are widely used commercially. They are for instance used for; food processing, gasification, power generation, chemical reactions and fuel production [13]. This thesis focuses on biomass gasification and bubbling fluidized bed gasifiers.
2.3.1
Fluidized-Bed Gasifier
Fluidized-bed gasifiers (FBG) are characterized by their fluidized bed that is made of granular solids and kept in semi-suspended condition (also called fluidized state). The medium used to fluidize the bed material is air, oxygen or steam or a combination of two of them. The process offers excellent mixing and temperature uniformity that reduces the risk of fuel agglomeration. [2].
Fuel particles are quickly mixed with the bed material and heated up to the temperature of the bed, resulting in a fast pyrolysis of the fuel. Gaseous materials with a component mix are produced and further gasification and tar-conversion reactions occur in the gas phase. Drying, pyrolysis and gasification takes place simultaneously and the residence time of gas in the system is short in comparison to other type of gasifiers. The residence time is the time it takes for gas to pass through the reactor from the bottom of the bed to the surface of the bed. [2]
2.3.2
Bubbling Fluidized-Bed Gasifier
The Bubbling Fluidized-bed Gasifier, or BFB as it is commonly abbreviated, was developed in 1921 by Fritz Winkler and has been used commercially for coal gasification for many years. BFB is one of the most popular technologies for biomass gasification. [2]
Biomass that is fed into the gasifier’s hot bed material is generally first crushed to a size less than 10 mm and the bed temperature is normally kept below 900 °C in order to avoid ash fusion and consequent agglomeration. Ashes that are generated inside the gasifier are drained from the bottom of the bed. The fluidizing medium enters the reactor through the distributor plates, whose primarily function is to distribute the fluidizing medium uniformly to the bed and prevent leaking of bed material into the chamber below. Common distributor plates are perforated- and porous plates. BFB gasifiers can operate at atmospheric pressure or elevated pressure and are grouped as low- or high- temperature types depending on the operating conditions. The fluidization velocity of a BFB is normally maintained between 0.5-1.0 m/s. [2]
Gasifying medium is used in two stages. The first-stage is to maintain the desired temperature of the bed and the second-stage is above the bed in order to convert entrained hydrocarbons and unreacted carbon into useful gas. [2]
Figure 1. Bubbling fluidized-bed biomass gasifier
2.3.3
Fluidization Regimes
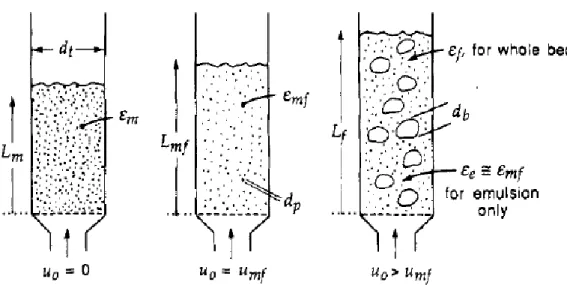
When a fluid flows upward through a bed of fine particles the bed will start to behave differently as the velocity, gas and solid properties are varied. As the properties are varied, different fluidization regimes will form. The regimes which are discussed in this thesis are shown in Figure 2.
Figure 2. Different fluidization regimes. Adapted from Kunii and Levenspiel [3].
As a fluid is passed through a bed of fine particles at a low flow rate and merely percolates through the void space between the stationary particles, there occurs no fluidization. A bed at this state is called a fixed bed and is shown in Figure 2A. When the velocity of the fluid is increased, a point is reached where the frictional force between the particles and the fluid is equal to the weight of the particles and causes the particles to suspend in the bed. This is the onset of fluidization and it is called the minimum fluidization of a bed and it is illustrated in Figure 2B. As the flow is increased further, bubbles start to appear in the bed, this bubbling state of the fluidized bed is shown in Figure 2C. If the flow rate is increased sufficiently further, a point will be reached where the terminal velocity of the solids in the bed is exceeded. When this occurs the upper surface of the bed will disappear and instead of bubbles, there will be a turbulent motion of solid clusters and voids of gas of various sizes and shapes. This phenomenon is called a turbulent fluidization, shown in Figure 2D. Further increase of flow will yield a regime that is called pneumatic transport of solids where solids will be carried out of the bed with the fluid (not shown in Figure 2). In both turbulent and pneumatic transport there is a need for having a cyclone due to the large amount of particles that are entrained in theses regimes. The entrained particles have to be collected and returned to the bed for steady state operations. [13]
2.3.4
Geldart’s Classification of Powders
The particles used in fluidized beds affects the behaviour of the bed and their behaviour depends on primarily size and density [14]. Geldart [15] was able to come up with four clearly recognizable kinds of particle behaviour when observing the fluidization of different sorts and sizes of solids. Geldart’s classification of particles is displayed in Figure 3 and the groups are characterized by the density difference between the particles (𝜌𝑠) and the fluidizing medium (𝜌𝑔) and the mean particle size (𝑑̅𝑝). The graph shows the fluidization that can be expected by determing at which group the particles belongs to and the graph also helps to predict other properties such as bubble size and bubble velocity. [16]
Figure 3. Geldart's classification of particles for ambient air conditions. Note that operating conditions above ambient may make powders appear in a different group than at ambient condition [13]. Reprinted from Fluidization Engineering, 2nd edition, Daizo Kunii and Octave Levenspiel, Fluidization and Mapping of Regimes, 61-94, Copyright (1991), with permission from Elsevier. The most obvious characteristics and types of solids of the groups are shortly presented below [16].
Group A: Very suitable for fluidization and exhibits range of non-bubbling fluidization. Typical solids are cracking catalysts.
Group B: Gas bubbles appear at the minimum fluidization velocity. Typical solid is building sand.
Group C: Difficult to fluidize due to cohesive bed particles. Typical solids are flour and cement.
Group D: Coarse solids that require very high fluid energy to achieve fluidization. Typical solids are gravel and coffee beans.
See Geldart [15] or Rhodes [16] for more extensive information about the different groups.
2.3.5
Minimum Fluidization Velocity
The superficial gas velocity at the point when the bed is fluidized is called the minimum fluidization velocity 𝑢𝑚𝑓 (sometimes referred as the velocity at incipient fluidization). This
can be described by the Ergun equation which gives the pressure drop in gas flowing through a packed bed: Δ𝑃 ℎ = 150 (1 − 𝜖𝑚𝑓)2 𝜖𝑚𝑓3 𝜇𝑔𝑢𝑚𝑓 (𝜙𝑠𝑑𝑝)2 + 1.751 − 𝜖𝑚𝑓 𝜖𝑚𝑓3 𝜌𝑔𝑢𝑚𝑓2 𝜙𝑠𝑑𝑝 (2.1)
in which Δ𝑃 is the pressure drop across the bed, which always is positive and h is the length of a fixed bed. The particle sphericity 𝜙𝑠, is defined as the surface area of a sphere having the same volume as a particle divided by the surface area of the particle. 𝑑𝑝 is the particle
diameter and 𝜌𝑔 is the density of the gas along with 𝜇𝑔 which is the viscosity of the fluid. [17] The minimum fluidization voidage, 𝜖𝑚𝑓, is often an unknown which becomes a problem since it is needed when applying the Ergun equation. The minimum fluidization voidage is often assumed to approximately 0.4 − 0.5 [1,13,18], however, Wen and Yu [19] developed for a range of particle types and sizes an expression which describes the minimum fluidization voidage based on experimental data with the following approximations: [17]
1 − 𝜖𝑚𝑓 𝜙𝑠2𝜖 𝑚𝑓3 ≅ 11 1 𝜙𝑠𝜖𝑚𝑓3 ≅ 14
Wen and Yu [19] combined these approximations with the Ergun equation and obtained the following relation which gives Reynolds number at minimum fluidization:
𝑅𝑒𝑝,𝑚𝑓=𝑑𝑝𝑢𝑚𝑓𝜌𝑔
𝜇𝑔 = √𝐶12+ 𝐶2𝐴𝑟 − 𝐶1 (2.2)
where 𝐴𝑟 is the Archimedes number, which is defined as:
𝐴𝑟 =𝑑𝑝
3𝜌
𝑔(𝜌𝑠− 𝜌𝑔)𝑔
𝜇𝑔2 (2.3)
where 𝑔 is the standard gravity and 𝜌𝑠 is the density of the bed material.
Kunii and Levenspiel [13] presents a table with different values for C1 and C2, where Wen and
Yu [19] suggests the use of C1=33.7 and C2=0.0408, while Grace [20] instead suggests C1=27.2 and C2=0.0408.
Kunii and Levenspiel [5] suggests the following equation to estimate the minimum fluidization voidage: 𝜖𝑚𝑓= 0.586𝜙𝑠−0.72( 𝜇𝑔2 𝜌𝑔𝑔(𝜌𝑝− 𝜌𝑔)𝑑𝑝3 ) 0.029 (𝜌𝑔 𝜌𝑝) 0.021 (2.4)
The following equation was proposed by Kunii and Levenspiel [13] for the calculation of the minimum fluidization velocity for fine particles:
𝑢𝑚𝑓= 𝑑𝑝2(𝜌𝑠− 𝜌𝑔)𝑔 150𝜇𝑔 𝜖𝑚𝑓3 𝜙 𝑠2 1 − 𝜖𝑚𝑓, 𝑅𝑒𝑝,𝑚𝑓< 20 (2.5)
where the 𝑅𝑒𝑝,𝑚𝑓 is the Reynolds number for particles at minimum fluidization and defined as follows:
𝑅𝑒𝑝,𝑚𝑓=𝜌𝑔𝑑𝑝𝑢𝑚𝑓
𝜇𝑔 (2.6)
The minimum fluidization velocity can also be calculated by the following equation that Gupta and Sathiyamoorthy [21] proposes:
𝑢𝑚𝑓=𝑅𝑒𝑝,𝑚𝑓𝜇𝑔
𝑑̅𝑝𝜌𝑔 (2.7)
2.3.6
Terminal Velocity
The velocity at which an object is falling with a constant velocity in a stagnant medium is an important parameter in fluidization and this velocity is referred to as the terminal velocity. A falling object reaches its terminal velocity when the sum of the drag force and buoyancy equals the downward force of gravity. An object in the bed will be carried upward with the gas stream and leave the bed if the upward gas velocity exerted on the object exceeds the terminal velocity since the drag force on the object hence surpasses the gravitational force.
The terminal velocity provides thereby an upper bound that can be used to operate the fluidized bed in order to avoid transportation of particles out of the bed, while the minimum fluidization provides a lower bound. This range can be used as condition to be satisfied for proper bed operation (see below).
𝑢𝑚𝑓< 𝑢0< 𝑢𝑡
In calculating the terminal velocity 𝑢𝑡, the diameter of the smallest particles present in quantities in the bed should be used and the terminal velocity for a single particle can be obtained from the following equation which was proposed by Wen-Ching [14]:
𝑢𝑡= √4𝑑𝑝(𝜌𝑠− 𝜌𝑔)𝑔
3𝜌𝑔𝐶𝐷 (2.8)
where 𝐶𝐷 is the drag coefficient obtained from experiments. Haider and Levenspiel [22] proposes the following correlation from a study on drag coefficients:
𝐶𝐷= 24
𝑅𝑒𝑝[1 + (8.1716𝑒−4.0655𝜙𝑠 )𝑅𝑒𝑝0.0964+0.5565𝜙𝑠] +
73.69𝑒−5.0748𝜙𝑠𝑅𝑒
𝑝
𝑅𝑒𝑝+ 5.378𝑒6.2122𝜙𝑠 (2.9) where Reynolds number is calculated as:
𝑅𝑒𝑃=𝜌𝑔𝑢𝑡𝑑𝑝
𝜇𝑔 (2.10)
The procedure to calculate the terminal velocity by the formulas above requires trial and error since 𝑢𝑡 is present in both 𝐶𝐷 and 𝑅𝑒𝑝. Expressions that give 𝑢𝑡 explicitly would
therefore be useful and some of these expressions from Haider and Levenspiel [22] will be briefly presented.
Two dimensionless quantities are used, these quantities are shown below and the first one is for terminal velocity 𝑢𝑡∗ and the second one is particle diameter 𝑑
𝑝∗. 𝑢𝑡∗= 𝑢 𝑡[ 𝜌𝑔2 𝜇𝑔(𝜌𝑠− 𝜌𝑔)𝑔] 1 3⁄ = 𝑅𝑒𝑝 𝐴𝑟1 3⁄ ( 4 3 𝑅𝑒𝑝 𝐶𝐷) 1 3⁄ (2.11) 𝑑𝑝∗ = 𝑑 𝑝[ 𝜌𝑔(𝜌𝑠− 𝜌𝑔)𝑔 𝜇𝑔2 ] 1 3⁄ = 𝐴𝑟1 3⁄ = (3 4𝐶𝐷𝑅𝑒𝑝2) 1 3⁄ (2.12)
A useful approximation for 𝑢𝑡∗ is the following expression:
𝑢𝑡∗= [ 18 (𝑑𝑝∗)2+ 2.335 − 1.744𝜙𝑠 (𝑑𝑝∗)0.5 ] −1 , 0.5 < 𝜙𝑠< 1 (2.13)
2.4
Bubbling Fluidized Beds
Bubbles in bubbling fluidized beds are very important in several aspects of the performance of the bed, bubble size affects for instance; bubble rise velocity, fractions of bubbles, solids mixing and mass transfer. This chapter will thus introduce the two-phase theory of fluidization that is often adapted in models and how bed properties can be estimated.
2.4.1
The Two-Phase Theory of Fluidization
Toomey and Johnstone [23] proposed in 1952 a simple description of the expansion of a bubbling fluidized bed, known as the two phase theory. This theory considers that bubbling fluidized bed consists of two phases: a bubbling phase and a particulate phase that is often referred as the emulsion phase. The bubbling phase consists of gas bubbles, while the emulsion phase consists of fluidized solids surrounding the bubbles.
The theory states that all gas in excess of that required for minimum fluidization passes through the bed as bubbles, while the emulsion phase remains stationary at minimum fluidizing conditions (i.e. essentially constant at 𝜖𝑚𝑓.)
𝐺𝑏
𝐴𝑐 = 𝑢 − 𝑢𝑚𝑓 (2.14)
Where 𝐺𝑏 is defined as the visible bubble flow rate in a fluidized bed that crosses any cross section area 𝐴𝑐. The resulting velocity is approximated to be equal to the excess gas flow required for minimum fluidization.
Several studies for larger beds (>30 cm) indicates that the assumptions of the two-phase theory are not well met in practice [13]. The two-phase theory do overestimate the volume of gas passing though the bed as bubbles and modifications and correction factors has been created to obtain a better consistency with experimental findings [16]. It has also been found that as gas velocity is raised above 𝑢𝑚𝑓, emulsion voidage will not stay at 𝜖𝑚𝑓 [13].
2.4.2
Bubbles in Fluidized Beds
Bubbles in a fluidized bed are in fact gas pockets that are formed when gas is passed through a dense bed. When the gas rises upwards in the bed, regions of low solid density begins to appear, so called gas pockets which is commonly known as bubbles. The part of the bed that does not have a low solid density but in fact has a high solid density is called the emulsion phase. [13]
The bubbles in a fluidized bed rises upwards through the bed to reach the surface, this motion of the upward rising bubbles enhances rapid and extensive particle mixing in the bed, thus promotes the uniformity of the bed properties e.g. heat and mass transfer. The bed height at fluidization or bed expansion is a function of the bubble-phase volume in the bed. [24]. Bubbles throughout the bed are classified either as fast or slow moving bubbles depending on whether the emulsion rises faster or slower than the bubbles. For slow-moving bubbles the emulsion gas rises faster than the bubbles, where the emulsion gas uses the bubbles as shortcuts during its way through the bed. Slow-moving bubbles does not have a surrounding gas cloud. [13]. Fast-moving bubbles within the fluidized bed carries with them a cloud of gas and particles which only circulates through the bubbles and does not exchange any of the gas or particles with their surroundings. This through-flow obstructs mixing within the bed and may cause elutriation of unreacted particles. Elutriation is a phenomenon that is caused by bursting bubbles at the bed surface, which throws particles into the space above the bed surface. [24]
Prediction of bubble size in a bubbling bed can be quite difficult since bubbles are irregular in shape and vary greatly in size. Bubbles in a bed grows in size as they rise through the bed due to coalescence and bubbles in beds which consists of particles from the groups of A and B in the Geldart’s classification are typically spherical cap-shaped, but this is often ignored and the bubbles are assumed to have a spherical geometry. The part of the bubble that is often ignored is called the wake, the wake is formed at the bottom of the bubble due to solids that are carried inside the bubble as it rises through the bed. The wake is formed directly when the bubble forms at the bottom of the bed where it also picks up most of the solids. Figure 4 shows an illustration of a bubble and its surroundings.
Figure 4. Schematic of bubble, cloud, wake and emulsion
Solids in the wake are continuously shed and leaked as the bubble rise and there is thereby a continuous interchange of solids between the wake and emulsion that plays an important role in solids mixing in bubbling fluidized beds. Since the size can be hard to define, a mean bubble diameter 𝑑𝑏 for a spherical bubble is often used to represent the bubbles throughout the bed. The bubbles themselves include small portions of solids and investigations by Kobayashi et al. [25] and Hiraki & Kunii [26] have with different techniques found that bubbles contain 0.2-1.0% solids by volume. The fact that solids are present in bubbles are often ignored in models, but Kunii and Levenspiel points out that the particles dispersed in bubbles can although their small volume fraction have enormously influence on practical operations in which rapid kinetics occur. [13]
Darton et al. [27] proposed the following relationship to calculate the variation of bubble sizes throughout the bed:
𝑑𝑏 =0.54(𝑢0− 𝑢𝑚𝑓)
0.4
ℎ0.8
𝑔0.2 (2.15)
where ℎ is the height over the distribution plate. The average bubble diameter 𝑑𝑏,𝑎𝑣𝑔 for the
whole bed is defined as:
𝑑𝑏,𝑎𝑣𝑔= (1 𝐻) ∫ 𝑑𝑏
𝐻
0
𝑑ℎ (2.16)
where 𝐻 is the total height of the bed.
The bubble size at any height ℎ in the bed can be calculated for Geldart B and D solids from the following relationship proposed by Mori and Wen [28].
𝑑𝑏𝑚− 𝑑𝑏 𝑑𝑏𝑚− 𝑑𝑏0= 𝑒
−0.3ℎ𝐷
𝑡 (2.17)
This correlation was obtained from bed diameters of 7 t0 130 cm, minimum fluidization velocities of 0.5 to 20 cm/s and solid particle diameters of 0.006 to 0.045 cm. The values of
𝑑𝑏𝑚 and 𝑑𝑏0 can be calculated according to equations below and the mean bubble size 𝑑𝑏 at any height ℎ above the distributor plate can thereafter be solved explicitly by rearranging the relationship above.
The maximum bubble size is given by:
𝑑𝑏𝑚 = 0.652[𝐴𝑐(𝑢0− 𝑢𝑚𝑓)] 0.4
(2.18) The initial bubble diameter depends upon distributor type and the relationship below is valid for porous plates:
𝑑𝑏0= 0.00376(𝑢0− 𝑢𝑚𝑓)2 (2.19)
2.4.3
Bubble Rise Velocity
Bubbles in fluidized beds behaves like bubbling liquids of low viscosity and the analogy between gas-liquid is hence commonly employed to illustrate behaviour of bubbles in fluidized beds. Davidson and Harrison [29] proposed from experiments the following expression for bubble rise velocity of a single bubble in relation to its bubble size:
𝑢𝑏𝑟 = 0.711√𝑔𝑑𝑏,
𝑑𝑏
𝐷𝑡 < 0.125 (2.20)
where 𝐷𝑡 is the diameter of the bed. The wall effects retard the rise of bubbles when 𝑑𝐷𝑏
𝑡 > 0.125 and in order to account for wall effects, Kunii and Levenspiel [13] suggest the following expression when 𝑑𝑏/𝑑𝑟 > 0.125:
𝑢𝑏𝑟= [0.711(𝑔𝑑𝑏) 1
2] 1.2𝑒−1.49𝑑𝐷𝑏𝑡, 0.125 < 𝑑𝑏
𝐷𝑡 < 0.6 (2.21) The bed is not considered to be bubbling when 𝑑𝑏⁄𝐷𝑡 > 0.6 and the bed is instead operating in the slugging regime. Slugging is a regime that occurs when the fluidized bed height is large in relation to the diameter, thereby providing enough time for bubbles to coalesce into bigger ones with diameters that corresponds to about 2/3 of the bed diameter (this regime occurs between bubbling and turbulent and it is not shown in Figure 2).
The bubble rise velocity when many bubbles are present is affected by several factors and Davidson and Harrison [29] proposed the following expression for bubble rise velocity when other bubbles are present in the fluidized bed:
𝑢𝑏= 𝑢𝑏𝑟+ (𝑢0− 𝑢𝑚𝑓) = 𝑢0− 𝑢𝑚𝑓+ 0.711√𝑔𝑑𝑏 (2.22)
Kunii and Levenspiel [13] points out that large bubbles rise rapidly and small bubbles rise slowly. Other experiments in bubbling beds have indicated that almost all gas in excess of that required to fluidize the bed passes through the bed as bubbles, while emulsion phase remains close to minimum fluidizing conditions and this theory is used in the two-phase
2.4.4
Fraction of Bed in Bubble Phase
The fraction of the bed occupied by bubbles can be determined by the following relation: 𝛿 =𝑢0− 𝑢𝑚𝑓
𝑢𝑏 (2.23)
Kunii and Levenspiel [13] suggest in their K-L model the following expressions to determine the fraction of bed in bubbles, depending on whether the velocity of the bubbles in the bed is slow, intermediate or fast.
For slow bubbles, or when 𝑢𝑏 < 𝑢𝑒,
𝛿 = 𝑢0− 𝑢𝑚𝑓
𝑢𝑏+ 2𝑢𝑚𝑓 (2.24)
where rise velocity of emulsion gas is calculated as: 𝑢𝑒=
𝑢𝑚𝑓
𝜖𝑚𝑓 (2.25)
Regimes of intermediate bubbles with thick clouds or when 𝑢𝑚𝑓⁄𝜖𝑚𝑓 < 𝑢𝑏 < 5𝑢𝑚𝑓⁄𝜖𝑚𝑓 can roughly be represented as 𝛿 = { 𝑢0− 𝑢𝑚𝑓 𝑢𝑏+ 𝑢𝑚𝑓 𝑤ℎ𝑒𝑛 𝑢𝑏≅ 𝑢𝑚𝑓⁄𝜖𝑚𝑓 𝑢0− 𝑢𝑚𝑓 𝑢𝑏 𝑤ℎ𝑒𝑛 𝑢𝑏 ≅ 5𝑢𝑚𝑓⁄𝜖𝑚𝑓 (2.26)
For fast bubbles, or when 𝑢𝑏 > 5𝑢𝑚𝑓⁄𝜖𝑚𝑓 :
𝛿 =𝑢0− 𝑢𝑚𝑓
𝑢𝑏− 𝑢𝑚𝑓 (2.27)
For vigorously bubbling beds, when 𝑢0≫ 𝑢𝑚𝑓
𝛿 =𝑢0
𝑢𝑏 (2.28)
2.4.5
Bed Height
Kunii and Levenspiel [13] proposes the following mass balance for the solids in the bed from which the bed height at various conditions can be determined:
𝐿𝑚(1 − 𝜖𝑚) = 𝐿𝑚𝑓(1 − 𝜖𝑚𝑓) = 𝐿𝑓(1 − 𝜖𝑓) (2.29)
where 𝐿𝑚 is the height of a bed at rest (no fluidization), 𝐿𝑚𝑓 is the bed height at minimum fluidization condition and 𝐿𝑓 is the bed height at bubbling fluidization condition. Figure 5
Figure 5. Bed height at different fluidization conditions, left is bed at rest, middle is at minimum fluidization and the right is at bubbling bed condition. Reprinted with permission from Kunii and Levenspiel [30]. Copyright (1990) American Chemical Society.
𝜖𝑚 and 𝜖𝑚𝑓 are the voidage of the bed at rest and at minimum fluidization condition. Experiments and observations has shown that rising bubbles throughout the bed contain very little amounts of solids, according to Kunii and Levenspiel [13] the solids inside the bubbles can be ignored, hence letting the 𝛿 be the fraction of bubbles in the bed and the average bed voidage can be written as follows:
𝜖𝑓 = 𝛿 + (1 − 𝛿)𝜖𝑚𝑓 (2.30)
2.4.6
Freeboard
Most fluidized beds have normally an open space above its bed surface, known as the freeboard. Solids that are carried upwards through the bed in bubble wakes are thrown into the freeboard when bubbles erupt at the surface of the bed. Some particles may disengage from the gas and return to the bed while some particles are carried out from the freeboard by the gas. It all depends on whether the fluid drag is greater than the gravitational force exerted on the particles, i.e., particles with terminal velocities lower than the superficial gas velocity in the freeboard are carried away. [1]
The purpose of the freeboard is thus to prevent too large amounts of particles from being carried out the fluidized bed unit by the gas stream.
The volume fraction of solids at various levels z in the freeboard can be determined with the following equation according to Lewis et al. [31]
1 − 𝜖𝑓𝑏 = (1 − 𝜖𝑓)𝑒−𝑎𝑧 (2.31)
The constant 𝑎 can be found in a graph presented in Kunii and Levenspiel [13]. This graph can be used in the following ranges:
𝑢0≤ 1.25 𝑚/𝑠, 𝑑𝑝≤ 800 𝜇𝑚 The decay constant 𝑎 can then be determined as follows:
𝑎 =1.8
𝑢0 (2.32)
2.4.7
Gas Transfer between the Fluidized-bed Phases
In order to predict the behaviour of the fluidized bed at various operations, knowledge about how the gases passes through the bed by dispersion and interchange between bubble and emulsion phases is required. Gas flows directly from the emulsion phase into the bubble in slow cloudless bubbles and then back into the emulsion again. Whilst in fast clouded bubbles, the gas transfer occurs in two steps between emulsion and bubble: between emulsion and cloud, and between cloud and bubble. [13]
Transfer of component A from bubble phase of volume 𝑉𝑏 can be defined by the following rate equations: − 1 𝑉𝑏 𝑑𝑁𝐴𝑏 𝑑𝑡 = 𝑑𝐶𝐴𝑏 𝑑ℎ = 𝐾𝑏𝑒(𝐶𝐴𝑏− 𝐶𝐴𝑒) = 𝐾𝑏𝑐(𝐶𝐴𝑏− 𝐶𝐴𝑐) = 𝐾𝑐𝑒(𝐶𝐴𝑐− 𝐶𝐴𝑒) (2.33) Where 𝑁𝐴 is the number of moles A and 𝐶𝐴𝑏, 𝐶𝐴𝑐, 𝐶𝐴𝑒 are the mean concentrations of component A in bubble, in gas cloud and wake regions, and in the emulsion phase respectively. The coefficients 𝐾𝑏𝑒, 𝐾𝑏𝑐 and 𝐾𝑐𝑒 are of dimension s-1 and represents overall gas
interchange between bubble and emulsion, between bubble and cloud, and between cloud and emulsion respectively.
Kunii and Levenspiel [13] explains that the interchange coefficient 𝐾𝑏𝑒 can be interpreted as
the flow of gas from bubble to emulsion with an equal flow in the opposite direction:
𝐾𝑏𝑒 =
volume of gas from bubbles to emulsion or from emulsion to bubbles
(volume of bubbles in the bed)(time) (2.34) 𝐾𝑏𝑐 and 𝐾𝑐𝑒 has similar meanings and the interchange coefficients follows the following relationship: 1 𝐾𝑏𝑒= 1 𝐾𝑏𝑐+ 1 𝐾𝑐𝑐 (2.35)
The interchange coefficient between bubble and cloud for fast clouded bubbles (𝑢𝑏𝑟≥
5𝑢𝑚𝑓⁄𝜖𝑚𝑓) can be estimated by the following expression obtained by Kunii and Levenspiel:
𝐾𝑏𝑐 = 4.5 (𝑢𝑚𝑓
𝑑𝑏 ) + 5.85 (
𝐷1 2⁄ 𝑔1 4⁄
𝑑𝑏5 4⁄ ) (2.36)
Kunii and Levenspiel presents also the following expression to estimate the interchange coefficient between cloud and emulsion:
𝐾𝑐𝑒= 6.77 ( 𝜖𝑚𝑓𝐷𝑢𝑏𝑟 𝑑𝑏3 )
1 2⁄
(2.37)
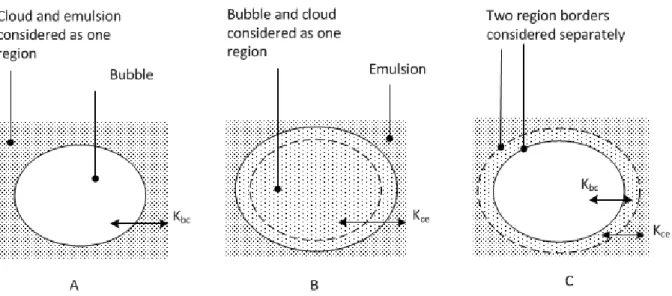
Some gasification model developers [32] considers cloud and emulsion as one region (see Figure 6A) and the overall interchange coefficient is thereby 𝐾𝑏𝑐. Other developers [7]
considers the regions of bubble, cloud and emulsion separately (as shown in Figure 6C), which requires 𝐾𝑏𝑐 and 𝐾𝑐𝑒 in order to estimate the overall gas interchange coefficient 𝐾𝑏𝑒.
Figure 6. Different approaches to divide bubble, cloud and emulsion into separate and merged regions. Adapted from Kunii and Levenspiel [11].
2.5
BFB Hydrodynamic Models
Bubbling fluidized bed hydrodynamic models are useful to give a deeper understanding of the behaviour of bubbling fluidized bed. Hydrodynamic models are used to predict and simulate the behaviour of new as well as old fluidized test rigs. Two mostly used modelling theories for the hydrodynamic in bubbling fluidized beds are shortly reviewed in this text.
2.5.1
Bubbling Bed Model
The bubbling bed model by Kunii and Levenspiel [5], or the K-L model as it is commonly referred to, is a two-phase model which aims to model the flow of gas through fluidized beds by modelling bubble phase, emulsion phase, and the gas interchange rate between these two phases. If the properties of the material in the bed along with minimum fluidization velocity and superficial gas velocity are known, then the effective bubble size is the only parameter in this model and all internal flows and interchanges in the bed are hence derived from it. The model considers the following assumptions [5]:
Bubble gas stays with the bubble as a cloud
Rise velocity and recirculation are functions of the bubble size
Each bubble drags a cloud with solids up through the bed which creates solid mixing in the bed
The bubbles are of one size and evenly distributed in the bed The emulsion stays at minimum fluidizing conditions
2.5.2
Bubble Assemblage Model
The “Bubbling Bed Model” proposed by Kunii and Levenspiel [13] asserts that only the effective size of bubble is needed to describe the gas flow through a bed, this is considered as an oversimplification by Kato and Wen [6]. As Kato and Wen believes that the “Bubbling Bed Model” are based on oversimplifications they proposes their own model, the “Bubble Assemblage Model” [6]. The “Bubble Assemblage Model” considers that the bubbles rising through the bed grows in size with height with the following assumptions [4]:
The fluidized bed consists of 𝑛 compartments in a series. The size of each compartment is equal to the size of the bubble at corresponding location.
Each compartment consists of a bubble phase and an emulsion phase. The bubbles are assumed to be spherical.
2.6
Aspen Plus
Aspen (Advanced System for Process ENgineering) Plus is a process simulation software that was developed at the Massachusetts Institute of Technology (MIT) during the 70’s. Aspen Plus is widely accepted in chemical industry engineers due its ability to model and simulate steady-state processes. The tool contains several unit operation models and has many useful features, such as sensitivity analysis. However the imbedded library do not contain any BFB or CFB models so far, Aspen Plus also provides the opportunity to write own models when the built-in models do not meet the needs. The user model consists of one or more Fortran subroutines that can interact with built-in models. [33]
2.7
Classification of Fluidized Bed Gasification Models
The complicated processes in gasification require the development of mathematical models in order to study the thermochemical processes during gasification and to evaluate the influence of input variables. Variables of interest can for instance be hydrodynamic parameters, moisture content, air/fuel ratio, composition of produced gas and the calorific value of produced gas. These models can furthermore be used to optimize design and operation of fluidized bed gasifiers. Many models have been published with different names, categories and classifications depending on the purpose.
Gómez-Barea and Leckner [3] have classified published gasification models in fluidized beds into three categories, based on the simplifications that the models have adopted to solve the fluid-dynamics. The categories are:
Computational fluid-dynamic models (CFDM) Black-box models (BBM)
Fluidization models (FM)
2.7.1
Computational Fluid-Dynamic Models (CFDM)
In CDFM, several equations for conservation of mass, momentum, species and energy over a discrete region are solved simultaneous. Regions can be divided into elements for which equations describing quantities moving in and out of elements can be written with boundary conditions. The results from CFDM give detailed information of the fields in the reactor, such as distribution of temperature and concentration. CFDM for gasification consists normally of several submodels for operation of vaporization of biomass particles, pyrolysis and char oxidation. [2]
CFD models of gas-solid systems are divided into two groups by van Wachem et al. [34], the groups are Lagrangian models and Eulerian models (see van Wachem et al. [34] for further information). The partial differential equations in CFDM are often nonlinear and these are discretized and solved numerically rather than analytically. This is done by utilizing
discretization methods such as finite volume, finite difference and finite element. Available commercial software is ANSYS, ASPEN, FLUENT, PHoenics and CFD2000.
Computational fluid-dynamics (CFD) fluidized bed gasifiers are relative new and few trials to simulate fluidized bed biomass gasifiers by using CFDM have been reported. Much has to be added to CFD for FBG and the considerable computation time required for CFD computations needs be shorten. CFD offer promising expectations for modelling FBG. [3]
2.7.2
Black-Box Models (BBM)
Black-box model is a set of models in gasification reactors where the process are not resolved and the models consist of overall mass and heat balances over the reactor supported by assumptions to acquire knowledge about the material distribution in the gasifier. Assumptions and the complexity of BBM vary widely between different models of this type depending on the aim, from predicting the overall gasifier performance by applying simple mass and heat balances to predicting the gas and solid composition. The gasifier can be divided into black-box regions where specific processes are assumed to be dominant and models based on kinetics or equilibriums are applied. Models can be also based on empirical correlations to fit specific plants. [3]
2.7.3
Fluidization Models (FM)
FM is a mixture between BBM and CFDM and is up to date the best developed model type for fluidized bed gasifiers, hence most of the comprehensive models published within the subject of fluidized bed gasifier are using this type of modelling approach. FM omits the details of complex gas-solid dynamics but by assuming a multiphase pattern in the bed the fluid-dynamic effects can still be maintained. To omit the details of complex gas-solid fluid-dynamics FM assumes that two (sometimes three) regions or phases exists in the bed. The phase or the region has a predefined topology which allows exchange of mass and heat between them. In FM the momentum equation is not solved and the fluid-dynamic pattern is described by semi-empirical correlations (i.e. a correlations which are partially empirical and partially theoretical). These correlations describes the dynamics of bubbles and particles in the bed, thus gives a proper closure for chemical reaction modelling. [3]
Fluidization models for fluidized bed gasifiers are mostly assumed to be one dimensional, however, three dimensional models exist but are not as common as one dimensional models [35]. Fluidized bed reactor models are often named after their author e.g. Davidson-Harrison model [29], Kunii-Levenspiel model [13], but sometimes they are also named after the main features e.g. Bubble assemblage model by Kato and Wen [6] and countercurrent back mixing by Fryer and Potter [36]. [3]
Gómez-Barea and Leckner [3] have not found any fundamental differences between the models mentioned earlier since they are all based on the essentials of fluid-dynamics e.g. bubble velocity, diameter of bubbles, fraction of bubbles in bed etc. and are applying similar correlations.

![Table 3. Apparent rate constants [4]. Reprinted from kinetic model of biomass gasification, vol 51, Y](https://thumb-eu.123doks.com/thumbv2/5dokorg/4446976.107871/40.892.121.777.103.359/table-apparent-constants-reprinted-kinetic-model-biomass-gasification.webp)

![Table 5. Input to kinetic model ,derived from Narváez et al. [44] ER 0.47 0.37 0.32 0.26 x 1 0.35689 0.41555 0.41689 0.43924 x 2 0 0 0 0 x 3 0 0 0 0 x 4 0.99568 0.83453 0.88701 0.80879 x 5 0.59742 0.48010 0.47742 0.43272 x 6 0.045](https://thumb-eu.123doks.com/thumbv2/5dokorg/4446976.107871/45.892.99.804.142.380/table-input-kinetic-model-derived-narváez-et-er.webp)