STATENS VAG- OCH TRAFIKINSTITUT National Swedish Road and Traffic Research Institute
BIFROST - INSTRUMENT FOR AUTOMATIC DIGITAL RECORDING OF ROAD CROSS PROFILES
by
Olle Andersson
REPORT No. 22 A
STATENS VAG- OCH TRAFIKINSTITUT
National Swedish Road and Traffic Research Institute
BIFROST
INSTRUMENT FOR AUTOMATIC DIGITAL
RECORDING OF ROAD CROSS PROFILES
by
Olle Andersson
REPORT No. 22 A
VTI Rapport Nr 22
Summary
For rational cross profiling of road surfaces, predominantly in
order to measure rut depth due to permanent defelction and
studd-ed tyre wear, a towstudd-ed cross profilometer has been designstudd-ed and built, capable of tracing road profiles up to 5 meters road width. The scanning mechanism of the profilometer is composed of a folded arm system, which carries a measuring wheel across the road along a straight line. At 17.1 mm intervals across the road the height of the wheel above an artificial zero level is punched, the zero level being determined by the position and orientation of the profilometer. The profilometer is crudely levelled by means of level indicators. For establishment of the position and orienta-tion of the zero level the measuring wheel is made to run across reference nails, one at each terminal point of the profile. The vertical coordinates are measured electrically by measuring the change of an electrical resistance, the coordinate being reproduced as an electrical voltage, measured by a digital volt-meter. The output of the voltmeter is fed into a data transmission
unit and punched on a paper tape by a Facit tape punch. The tapes
are fed into a large computer and evaluated by a Basic Fortran computer program. This program c0pies a diary line, the only data
recorded manually by punching into the tape, and after that the
computer calculates the rut depths and other basic parameters of the profile. If necessary the program makes the computer plot the profile on the line printer. The total time of profiling is a
BIFROST ~ instrument for automatic digital recording of road cross profiles.
Introduction
Several methods for the recording of road cross profiles have been tried, the simplest method being the mearusrement of vertical distances from the road surface to a straightedge. A.method fre-quently tried is the recording of the profile curve from the motion of a wheel which traverses the road. Such a record can often be made in a fraction of a minute. However, the graphical record has to be evaluated, which can sometimes be a tedious procedure. There are therefore certain advantages in producing a digital record of the profile, which can then easily be evalutated by means of a computer.
For this purpose the former Swedish Road Research Institute
deve-10ped a "towed instrument for recording by punching of cross profiles". The initials of the sequence within quotation marks written in Swedish gives the name BIFROST, which incidentally was the name of the rainbow in the ancient Nordic mythology, the rain? bow then being considered as a bridge right across the world. lgrinciple and design
The purpose of the instrument is determination of vertical coordi-nates of the intersection between the road surface and acvertical plane and across the road, i. e. within a width of about 3.5 meters.
The coordinates are normally wanted in realtion to a horizontal
line or some other datum line, but the establishment of such a line is mostly quite time consuming, and therefore it was decided to level the instrument only quite crudely and to introduce reference nails at the two terminal points of the profile. Profiles will there-fore have the connecting line between these references as a base
line, and transformation with respect to other base lines can easily-be made afterwards. The vertical coordinates are measured by means
of a potentiontiometer, whose resistance is 20 kiloohms and whose resolution is 2 ohms. It is linearity tolerance is 100 ohms.
The measering probe is a rubber tired wheel of 86 mm diameter, born
by a vertical rod, whose upper part is made into a gear rack, which
turns the potentiometer. The vertical rod slides in a girdle, joined
to the traversing arm system in such a way that the wheel is always
3.
The traversing arm system is composed of two arms of equal length.
The geometry of the motion of these arms is shown in figure 1. For
geometrical reasons, if the angle w = OAB is half of the angle ABC, the base line AC of the isosceles triangle ABC is always perpendi~ cular to the direction A0. Hence when the angle w varies, the point C will always be on a straight line perpendicular to the direction A0. This system for the creation of linear motion x, often used in
mechanical technology, can be utilized also for negative angles w, i,e, the point C to the left of the point A, if the arms AB and AC are arranged in different horisontal planes, making it possible for the point C to travel across the point A without the arms
obstruc-ting one another's motion.
The moving arms AB and BC, made of sheet metal, have a very high bending stiffness. The vertical motion of the travelling wheel is
less than 0.1 mm during a full swing of the arm system, covering a profile length of 5 meters. By means of a sprocket chain mechanism the angle ABC is maintained twice as large as the angle OAB through-out the swing. The orientation of the measuring wheel at C is also-controlled by a Sprocket chain mechanism.
The arm system is carried by a one axle towed vehicle, whose pole
points in the direction 0A, the point A being at the leftmost edge of
the vehicle. The length of the arms AB and BC is 1.25 meters, which gives a full swing of 5 meters. If the vehicle is parked at the edge of the road so that the point A is located 1 meter from the edge, it is therefore possible to cover 3.5 m profile length (one normal lane width) without blocking more than 1 meter of the lane width by the vehicle. Cross profiling of the lane can therefore be performed without blocking the traffic. The full width of the lane needs
blocking only for the period required to swing the arm to the leftmost position and back again, i.e. a fraction of a minute.
The arm system and sprocket chain system are attached to one another partly by means of bolts which can easily be realeased, thereby making it possible to fold the arm system and fixing it to the towing vehic-le for minimum space requirement during transport. Before transport the arm system is also tilted to a position on top of the vehicle,
thereby making the length of the compacted system no greater than.
that of the towed vehicle itself. A
In the measuring position the vehicle rests upon two-supporting?
legs, which are lowered hydraulically, until these legs alone carry the vehicle. A third leg close to the front end of the towing pole provides a third support point to the instrument. A simple level indicator on one of the traversing arms provides means for crude
levelling-of the system by adjusting the supporting legs. Fine adjust? ment of the levelling is superflous since profiling is made across
reference nails.
During tranSport the measuring system is protected against dirt by means of a plastic hood. The vehicle has stop lights, direction indicators and braking equipment allowing a maximum velocity of
70 km/h. The weight of the instrument is approximately 1/2 tons.
Data logging
For measurement of the resistance changes produced by the vertical
movements of the probe, the potentiometer is fed with a D.C. current in such a way that the electrical potential near the centre of the potentiometer is zero. This zero point can be displaced quite considerably. The sensitivity of the system in terms of volts per
unit vertical dispalcement is also adjustable and is maintained at
1 volt per centimeter diSplacement. The calibration can easily be checked by means of precision gauges, and the zero adjustment is usually done to make the output at either end of the profile zero. The total swing of the vertical movement of the probe is 180 mm. The output voltage is measured by means of a digital voltmeter, Digital Multimeter WM 1613. This meter gives four digit readings. The meter has BCD electrical output, which makes it possible to get a digital record of the output. For this purpose a Schlumberger DTU (data transmission unit) is connected to the voltmeter, and the out~ put from the DTU is fed into a paper tape punch Facit 4070. The DTU also has a key plug-in unit, which makes possible manual punching of ten figures and four other symbols. In this way appropriate diary information can be punched into the tape. The maximum punch rate of
the punch is 75 symbols per secondgoand the minimum cycling time
of the volt meter is 200 milliseconds, whereas the DTU admits much larger rates of transmission. The bottleneck of the datalogging
The probe.
Trigging of the data logging system is made by small rod-shaped magnets attached close to the perifery of the probe wheel and two magnetic switches diaplaced by an angle equal to one half of the angle between the magnets, giving the number of triggings per revolution of the wheel equal to twice the number of magnets. The distance along the periferi between two triggings has been found
to equal 17.1 mm. This corresponds to roughly 200 readings per
lane width, which at Optimum rate of reading (five per second) corresponds to a measuring period of 40 seconds.
If the arm system is moved manually during measurement, Optimum rate of reading is not realistic. One minute or more is more realistic. For the present (end of 1972) automatic drive of the arm system is under installation. A small electric motor will thereby drive the probe wheel directly, making possible a measuring period much closer to optimum. The arm system will be provided with a release mechanism for quick restoration to initial position in case of emergency. Voltmeters with much shorter cycling time are now available on the market, which could be used for reducing the measuring period. At higher speeds of the wheel there is however an increasing risk for vertical accelerations larger than that of
gravity so that the wheel may bounce on the road surface.
Data processing
Each profile is represented by an array of coordinates, the array being preceded by one line carrying the diary information and
succeeded by one line containing only one numerical constant, signi-fying the end of the array. These initial and terminal lines are punched manually. The computer programme, which is written in Basic Fortran, instructs the computer to c0py the first line and to store the rest of the array except the numerical constant as a vector. The computer then takes the difference between each coordi-nate value and the corresponding coordicoordi-nate of a straight line drawn between the two terminal points. The first and the last rea-dings are thereby made to be zero. Since the probe wheel rolls on the profile, each step of 17.1 mm corresponds to the length of a profile segment, and the corresponding horizontal coordinate incre-ment is calculated from the law of Pythagoras. Accumulation of these horizontal increments gives the horizontal coordinate of each point.
The computer than calculates the mean profile level and the stand-ard deviation around this level. The program primarily aims at the location of ruts and determination of rut depth. It is therefore assumed that the profile contains two minima and one maximum be-tween them. The maximum point should be found somwhere in the vicinity of the centre of the profile. The computer therefore
looks up the centre of the sequence and finds the lowest point to '
the left and to the right of this point. The computer then locates the highest point between these minima. Two linear functions are then established, corresponding to the straight lines from the
terminal points to the maximum. The vertical difference between
these straight lines and the respective minima are then found and reported as rut depths. This process is illustrated in figure 3. The computer reports from each profile its average profile level, the standard deviation around this leveel, the rut depth, the maximum height, the coordinates of each minimum and the maximum point and the total profile width. The computer program of this
simple Operation is recorded in figure 4.
In reality the traffic is often not symmetrically distributed with respect to the centre line of the road. The maximum point may then not be located in the vicinity of the centre point. It
sometimes happens that the left or right minimum.point is located so close to the centre, that the vertical coordinate of the centre point is lower than that of the other minimum. The computer then takes the centre point as a minimum. Since there is no maximum between this point and the two lowest points found, the centre point is also recorded as a maximum. In order to compensate for this complication the program has been provided with a test whether the centre point is a minimum. The dividing point is in
such a case shifted in the apprOpriate direction, until minimum point and centre point do not coincide. This extended program is
Shown in figure 5. The test is done in lines 69 and 70.
This extended program has still the shortcoming, that the terminal points are recorded as minima, if these are the lowest points. In such a case the presence of two ruts implies the existance of at least two minima and three maxima as one alternative. The
situation becomes quite complicated and the establishment of maxi-ma and minimaxi-ma maxi-may be wholly misleading.
VTI Rapport Nr 22
Instead of extending the program to further analysis the plot routine is therefore called for, and the whole profile is plotted. An example of a cross profile plotted in this way on a line prim ter is shown in figure 6. In this case the lane width was 2.5 meters, and the road, which was paved by a low viscosity bitumen mixture (road oil pavement) had received a new pavement layer narrower than the original road the year before profiling. The whole profile was therefore convex.
The cost of the computer processing has so far been approximately 2 Sw crowns per profile on the average, the price varying consi-derably if the plotting routine is included.
Operation experiences
BIFROST has for the present been in routine operation for two mea-suring seasons. Measurements have been carried out both during the summer and at temperatures close to freezing point late in
the year.
The electronic equipment does not Operate properly at low
tempera-tures, and therefore it has to be placed inside the towing vehicle during operation, and the towing vehicle has to be heated to near
room temperature for safe operation. If the vehicle and equipment
has been parked outdoors during the night the equipment requires an hour of heating before prOper Operation. It has also been found important to protect the interior of the probe from moisture. In open fields the arm system is influenced by strong winds, and in Open fields there have in exceptionally windy wether been diffi~ culties in performing prOper cross travel. The time of change from transport position to measuring position is a few minutes, and the cycling time from one measurement to the following is
Support Hydraulically controlled supports
A ' .
C
\
Sprocket chain A .\
Arm system
-Fig 1: Geometry of the arm system
A. The suspension point of the arm system B: Probe '
C: Folding joint of the arm system
VI I Ra pp or t Nr 22 Rains
220 V
M 1.['1 f"<l. Digita1{ . volt meter P 21 !- .DTU=
m J;
DTU
WE'STANS
N Power unitData transmission unit
'F ig 2. El oc k di ag ra m of th e me as ur in g sys te m
Rut depth
M1
2 .
Computeé zer o'level
Regular profile
IINPUT
q
Dim Mggam Y 30 3;X(306>sDELf 3UOEJMTPLTSC203
+.v<300).z<300)
3:17.08
3
CONTINUE
READc5.10)MTPLTs
WRITE(6:9}MTPLTS 9 FORMATCIIIZUA4) 10 FORMAT 20A&) DO 30 13 1300 READCSJII)YCI) ' .IF cyc1>~3oo.)2oiao,4o
F¥Ew4_
,4 MN
m
20 1 Fortran program for analysis
30 CONTINUE A0 M3N*I
DO 3! 1315M
DELTACI)=$QRT(S*S (Y(I+1) YCI))**2) X(!3&0 X(I*I)3X(I)+DELTA(I) 3! CONTINUE WRITEC6312)N l2 FORMAT<IX¢'ANTAL VKRDEN':I}O) ll FORMAT(F5¢I) DO ?7 lalaN
77 ZCI)=Y(I) YCI) (Y(N)'Y( ))*X(I)/X(N) DU 60 I=ItN 60 V(I}=Z(I) NHSN/Z NHEaNH+l AMIN:V(1) NUN k 00 62 I32iNH IFCVCI) AMIN)6I:62262 6| AMIN=VCI) NUN I 62 CQNTINUE VMIle MIN AMINXVCNHE) MUM=NHE NHT¢NHE+I 00 64 szHTIN IFCV I)*AMIN)63:63;64 of cross profile 63 AMIN V(I) MUMti 64 CONTINUE VMINERQMIN AMAX=V NUN§ DO ?1 IaNUN#MUM IFCVCI)~AMAX)7I:72;72 72 AMAX2VCI} maxai 7! CQNTiNUE SUMRO SUM2£0 09 78 I iaN SUM SUM*Z(§) 78 SUMQ SUM2*ZCI)*Z(I) SUaSUM/FLOATiw) 52:(SUMQ SUN*SUN/FLOAT(N})IFLQATCN) SIGN=SQRT SQ3 WRITEC6150}5UJSIGM
80 FORMATC'MEDELiAL :3X F10.i:3X: STANDARUQVVIKELSE';FIOoI) WRITg én t)X(NUN);V(NUN):XéMUM):VCMUM)JX(MAX):V(MAX)
8! FQRHATé FGRST MIN'13XJF oiaF8.I/'ANDRR MiN :4X:F8¢laF8cl/
* MAX :IOX:F$¢I:F8¢I) WRITE(&:82>X(N) 82 FORMATC PRQFILBREQQ*:2X:F8.I3 S!3~V(NUN)*X NUN}*V(MAX)/XCMAX} sex~v<mumn+vcmax>¢<x<~)-xcmuw)>x<x<~>~x<max3y WRITE 6583)StaSZ 33 F0RMAT 'SP£RDJUP :5X:F8~1:5X3F8.2) 60 T0 3 END Rapper: Nr zzuAIA IEND
*ER YUM f i 0001 0002 0003 0004 0005 0006 000? 0008 0009 0010 001! OOXB 0513 0014 0035 O ié 0017 0018 00:9 0020 002! 6022 0923 0024 0025 0026 002? 9028 0029 0030 0031 0032 0033 0034 0035 0036 0937 0035 003? 0040 0041 0042 0043 0044 0045 0046 G04? 0048 0049 0850 005! 0053 0053 0054 0035 0055 0057 0058 0859 0060 0061 0062 0363 0064 0065 0066 006? 0068 0069 0070 6071 0072 0073 0074 0075 0076 0077 0078 0079 0080 0081 0088 0083 008d 0085 0086 008? 0088 0089 0090 009! 0092 0093 0094 0095 0096 0097 0098 0099 0100 3 3 I .4? *3 F 4} 3K 12 I! 77 63 7G 69 6! 63 64 7! 90 95 78 80 81 82 83 94 97 92 DIMENJEJN Y 3UU}:A(30Q)»0£LTA(3§Q);MTPLF$C20) +:V{300):£(3 0);C(600) 52i7.08 CUNTENUE REABCS:IOJM£PLI$ hHITE(&.9)MYPLT$ FQRMAT IlI4X11994> F RMATKBOAd) ED 30 I=la306 HEAD S;1£)Y(I} IF(Y(I) JOG¢}2G140;4? N=I CONTINUE ERITEC6:45}
FORMATt xz'MER RM 380 WARDEN ) 60 70 3 WRITEC5:48) FURMATé2K:'5LUTV~RQET ST HE EN 3000 } 60 T0 3 M=N-! 30 31 ixi¢M 2F<3x5~ ¥ £+1) y<1))¢¢2)42,a1,4: aRI?E(é.43)X FQKMAT(BK:'DELTA-Y STSR E AN 3 VID 12':13) GO T9 3 DELTA<I)=S&RT£S¢S~(Y(I+£)*Y(I})#*27 x{l)=3 XC£+!)=X(I)+DELTA(I) CONTINUE HRITE(6.!2)N
F38 AT( XD'ANTAL ViRDEN 3110)
FOR f<FS.li EU 7? I=!:N 2(1)a?<1)~Y(1)*(Y(N)*Y(1))*K(11IK(N> DU 60 1:1:N VCI):Z(I} Nszxe NH33NH*I GU T0 69 NH=NH~I NHE=NH+1 GO TO 69 NHSNH+E NHE=NH+1 GU T0 69 AMIN2VII) HUME! DO 62 1:20NH IF(V I)-AMIN)61.62:62 AMIN=V(1) NUN=I QONTINUE szuzzam1w A IN=V(NHE) MUMzNHE NHT=NHE+2 DU 64 I=NHT:N 1F(V(I)-AMIN)63;63:64 mi zvcl) MUMzI CQNTINUE UMisz MIN AMAX2V(NUN) DU 72 I=NUMIMUM IFCVCI)«AMAX)71:72;?2 AMAx=V(I> MAX=I CONTINUE IF(UMINl-AMAX)90;70»9U IF<VMIN2«AMA£)95,?3:9S CONTINUE SUM=0 SUM2=0 DO 73 I=IaN SUM=5UM*Z(X) $UM2$SUM3*Z(I)*Z{I) Su=SUMIFLORT(N) $2=(SUM? SU%*$UM/FLUATCN})IFLQQT(N} SIGM=SQRT(SB) MRITEf6aEC)3U15iGM Fig 5 «- ~_am%g w
The program displayed in fig 4 developed to acccunt for
gtygggiy asquetrical profiles
F03MAT MEHELTQL :3£:F10=£;3K;'ST MD RDAVVIKELSE'aF300l)
W i?£ié:8})XCNUN}:V(NUN):KCMUM):V(MUM):K<MAXJ:9(MAX)
FURMATC'F x T MIN':3XsF8~£:F8 i/ ANDRA MIN':4K:F8~1:FS¢II
+'MAX':XOK:F3~I:F8::}
WRITE 6182§X NJ
FQKMATC'P&OFILBREQD :EK:F8.i} Si2 ? NUN§+K NUN2*V{MAX}/X{MQX)
S23 V(MUM}+V(MRX)#(XCN)~X(MUM))fCXiN) X(MAX)) WRITE(é:83)Sli$2 FORMAT( $PARUJUP':5X1F8.RJSxaF tl} IF (NU ~i)9é;93:94 IF(MQM~N)9?:92:97 60 TU 3 CONTINUE DO 96 I=£:N C(X}:X(K) KSI+N C(K)=U<I) CALL VLOTCI;C:N;2:N20) 69 TD 3
w w U?)an at nkaO . .n'5 : -r ul i m e
Lina vii : ShQWi cvasa profile
3 92? 2; {IQ-t _ _.havxag Mn. 5 > ._ ., . x I m m m kNJ' aM(1 a n y. . . r ,, ~ I. J.
RaPPort Nr 22
gata
,*
259$. g n I h .h . . "Fo .'7) -J&':~ 'l 9D.->°~'-(
1)? if .
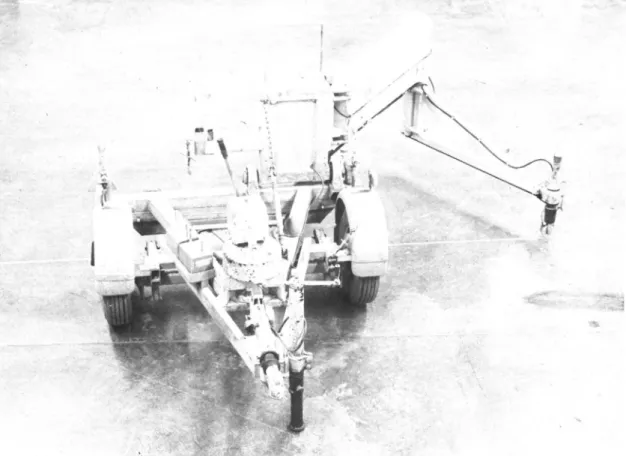
Figur 7. BIFROST in measuring position seen from the towing end.
'A:-=v:y¢y& {$okaMi¢-fx - \ ,A.
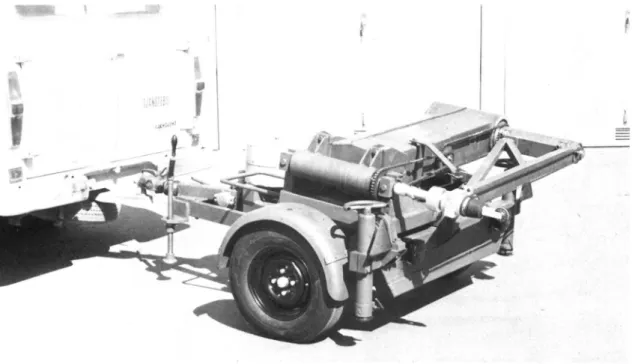
Figur 9. BIFROST in transport mode. The tilted part is actually
covered by a plastic hood. (The photo was taken 1 a state of development, when the rear supports were not yet hydraulically manoeuvered).