Master thesis in Biology
No effect of manganese coating or seed content
- a study on germination and seedling establishment
in Swedish winter wheat
No effect of manganese coating or seed content - a study
on germination and seedling establishment in Swedish
winter wheat
Kerstin Wahlquist
Supervisor: Karin Hamnér, Department of Soil and Environment, SLU Examiner: Anna Mårtensson, Department of Soil and Environment, SLU Credits: 30 ECTS
Level: Second cycle, A2E
Course title: Master thesis in Biology, A2E - Agriculture Programme - Soil/Plant Course code: EX0898
Programme/Education: Agriculture Programme – Soil and Plant Sciences 270 credits (Agronomprogrammet – mark/växt 270hp)
Course coordinating department: Soil and Environment Place of publication: Uppsala
Year of publication: 2019
Cover picture: 2019, Kerstin Wahlquist.
Title of series: Examensarbeten, Institutionen för mark och miljö, SLU Number of part of series: 2019:05
Online publication: http://stud.epsilon.slu.se
Keywords: triticum aestivum, micronutrient, deficiency, seed treatment, plant development, seedling growth
Abstract
Manganese (Mn) is a micronutrient where a great range and low concentrations have been recorded in winter wheat seeds in a Swedish survey called the Swedish envi-ronmental monitoring program on arable soils. A deficiency of Mn is common in cereals and may occur early in the season if the plant availability of Mn is low in the soil. Deficiency of Mn can lead to a reduced growth and several studies have shown that a low content of Mn in the seed can lead to early deficiency of the growing seed-ling. Seed coating products with Mn is marketed in Sweden and is recommended to use if cereals are sown on soils low in available Mn.
The aim of this thesis was to examine if Mn seed coating has an effect on germi-nation and seedling establishment in Swedish winter wheat and if the effect is influ-enced by the seed Mn content. Winter wheat seeds of the cultivar Julius were selected depending on the content of Mn in the seed and were divided into three levels, repre-senting low (0.42-0.70 µg Mn/seed), medium (1.04-1.08 µg Mn/seed) and high (1.22-1.83 µg Mn/seed) content of Mn. The seeds were coated with the product Norotec Mn (MnSO4) or with deionised water as control and were used in two experiments.
The seeds were sown on wet filter paper and in a soil where all essential mineral nutrients except for Mn had been applied. The experiments lasted for 10 days and four weeks respectively. The development of the seedlings was determined each day and at the end of the experiments, the seedlings were dried and weighed.
The results showed no differences in plant development or seedling dry weight between coated and uncoated. Nor could any difference be detected in development or seedling dry weight depending on the level of seed Mn content. Because of a lack of positive effect on seedling growth by Mn seed coating in the experiments using this method, to supply Mn, is not an obvious choice to avoid deficiency and a reduced growth. The low level of seed Mn content used in the experiments were not low enough to limit early seedling growth.
Keywords: triticum aestivum, micronutrient, deficiency, seed treatment, plant
Sammanfattning
Mangan (Mn) är ett mikronäringsämne där en stor variation samt låga koncentrat-ioner har uppmätts i höstvetekärnor i det svenska miljöövervakningsprogrammet mark- och grödoinventeringen. Manganbrist uppkommer lätt i spannmål och kan fö-rekomma tidigt på växtsäsongen om det finns en låg växttillgänglighet av Mn i mar-ken. Brist på Mn kan leda till en sämre tillväxt och flera studier visar på att en låg halt av Mn i kärnan kan leda till tidig brist i den växande plantan. Betningsprodukter som innehåller Mn marknadsförs i Sverige och rekommenderas att användas när spannmål odlas på jordar med låg tillgänglighet av Mn.
Syftet med denna uppsats var att undersöka vilken effekt manganbetning har på groning och tidig tillväxt i svenskt höstvete samt hur manganhalten i kärnan inverkar. Höstvetekärnor av sorten Julius valdes ut beroende på kärnornas halt av Mn och de-lades upp tre nivåer, motsvarande lågt (0.42-0.70 µg Mn/kärna), mellan (1.04-1.08 µg Mn/kärna) och hög (1.22-1.83 µg Mn/kärna) halt av Mn. Kärnorna behandlades med betningsmedlet Norotec Mn (MnSO4) eller med avjonat vatten som kontroll och
användes till två experiment. Kärnorna såddes på blött filterpapper samt i sand där alla näringsämnen utom Mn tillförts och experimenten höll på i 10 dagar respektive fyra veckor. Utvecklingen på de groende plantorna noterades varje dag och vid slutet av experimenten torkades och vägdes plantorna.
Resultatet visade att ingen skillnad i utveckling eller plantvikt kunde ses mellan de obetade och betade kärnorna. Inte heller kunde någon skillnad ses i utveckling eller plantvikt beroende på kärnans manganhalt. På grund av en utebliven positiv effekt av manganbetning i experimenten är denna metod, för att tillföra Mn, inte ett självklart val för att undvika brist och en minskad tillväxt. Den låga halten av Mn i kärnan som använts i experimenten var inte tillräckligt låga för att begränsa plantornas tidiga till-växt.
Nyckelord: triticum aestivum, mikronäringsämnen, brist, utsädesbehandling,
Ett flertal näringsämnen krävs för att höstvete ska kunna växa och producera kärnor. Ett av dessa är grundämnet mangan (Mn). Det har setts i flera undersökningar att höstvete växer sämre om innehållet av Mn i kärnan är lågt, speciellt om mängden Mn i jorden som höstvetet har tillgång till är liten. I det svenska miljöövervakningspro-grammet mark- och grödoinventeringen har analyser på svenskt höstvete gjorts. Dessa analyser visar på en stor spridning i halten av Mn i kärnan. Låga halter av Mn i höstvetekärnor har uppmätts och en sämre tillväxt på grund av detta skulle kunna vara ett problem i svensk höstveteodling som hittills inte fått någon större uppmärk-samhet. Det går att behandla höstvetekärnor med en näringslösning innan de ska sås genom betning. Detta görs för att mer näring ska finnas tillgängligt för den groende kärnan vilket gynnar den tidiga tillväxten. Rekommendationen från Jordbruksverket är att beta utsäde med Mn om jorden som höstvetet ska odlas i har en låg växttill-gänglighet av Mn.
I denna studie har jag undersökt om betning med Mn främjar utvecklingen och tillväxten av svenskt höstvete de första veckorna efter sådd. Jag har också undersökt om de halter av Mn som uppmätts i svenskt höstvete är så låga att utvecklingen och tillväxten försämras samt om det finns någon skillnad i effekten av en betning med Mn beroende på innehållet av Mn i kärnan.
Höstvetekärnor med olika innehåll av Mn betades med ett betningsmedel som in-nehåller Mn eller med vatten som kontroll. Kärnorna odlades under förhållanden där växttillgängligheten av mangan var mycket låg. Resultatet av studien visade att ingen skillnad kunde ses i utveckling eller plantvikt beroende på halten Mn i kärnan eller om kärnorna hade betats med Mn eller inte. Dessa resultaten går emot tidigare inter-nationella studier och det verkar inte som att de lägsta halterna av Mn i kärnan, som undersökts i denna studie, varit låga nog för att negativt påverka plantans tidiga till-växt. Eftersom det inte heller observerades någon effekt av att beta höstvetekärnorna med Mn är det osäkert om manganbetning bör rekommenderas för att undvika tidiga brister.
1 Introduction 7
2 Aim and hypothesis 8
3 Background 9
3.1 Mineral nutrients in soil 9
3.1.1 Manganese in soil 9
3.2 Functions of mineral nutrients in plants 10
3.2.1 Functions of manganese 10
3.3 The seed and mineral nutrients within the seed 11
3.3.1 Manganese in the seed 11
3.4 Seed germination, seedling establishment and the role of mineral nutrients 13
3.5 Manganese in Swedish soils and cereals 14
3.6 Manganese deficiency during vegetative growth 15
3.7 Micronutrient applications to crops 16
3.7.1 Manganese applications to crops 16
4 Material and methods 18
4.1 Selection of seed samples and experimental design 18
4.2 Preparation of the seed samples 19
4.3 Germination test 19
4.4 Seedling establishment test 21
4.5 Statistics 23
5 Results 24
5.1 Germination test 24
5.1.1 Germination and seedling development over time 24
5.1.2 Seedling dry weights 25
5.2 Seedling establishment test 27
5.2.1 Seedling development over time 27
5.2.2 Seedling dry weights 28
6 Discussion 31
6.1 Influence of Mn coating 31
6.2 Influence of seed Mn content 32
6.3 Influence of other factors 33
6.4 Evaluation of methods 33
6.5 Future research 35
7 Conclusions 36
Cereals are the biggest cash crops grown in Sweden. They can be grown in most parts in Sweden and in 2018, almost 1 000 000 hectares (ha) of cereals was grown (Olsson 2018). It is important to get a good establishment of cereals in order to be able to succeed with a high final yield of good quality. When the seed starts to ger-minate it has to rely on the seed reserves until the seedling is self-sufficient and has a root system large enough to supply the seedling with mineral nutrients. The quality of the seed is important for the early growth of the seedling, especially if the soil the seed is sown in has a low availability of mineral nutrients.
A potential risk of shortage of some micronutrients have been seen in cereals grown on arable soils in Sweden (Hamnér 2012). Manganese (Mn) is one micronu-trient where a great variability in concentrations has been found in harvested seeds. Analysed winter wheat seed samples had especially low concentrations of Mn and this could negatively affect the growth if the seeds are sown in a soil with a low availability of Mn (Eriksson 2011; Marcar & Graham 1986). Low Mn content in cereal seeds have been shown to have a negative effect on early seedling growth by several studies (Khabaz-Saberi et al. 2000; Longnecker et al. 1991; Marcar & Gra-ham 1986; Moussavi-Nik et al. 1997a).
Deficiency of Mn is often seen in winter wheat and is counteracted by supplying the plants with sufficient Mn before or when deficiency is seen (Börling 2017). The most common method to supply Mn is by foliar applications. If soils are low in available Mn, the Swedish Board of Agriculture recommend combining foliar ap-plications with Mn seed coating (Börling 2017). Seed coatings with mineral nutri-ents such as Mn are marketed both in Sweden and international and are marketed as enhancing the growth of the seedling. Swedish studies of seed coatings with several products containing Mn and other mineral nutrients show no clear effect in seedling growth and yield in several crops (Ekre 2000; Stoltz & Wallenhammar 2015; Svanström 2017). Whether the seed Mn content can have an effect of the results of Mn seed coating have not been studied in any Swedish studies which makes this question interesting.
The aim of this thesis was to better understand:
(I) How seed coating with Mn affects germination and seedling establish-ment in Swedish winter wheat.
(II) How the seed Mn content affects germination and seedling establish-ment in Swedish winter wheat.
The objectives of this thesis were to increase the knowledge on whether a low con-tent of Mn in the seed can be a limiting factor in the establishment of winter wheat and to study the effect of Mn seed coating.
Based on this, the following hypotheses were tested:
(I) Seed coating with Mn will increase the available amount of Mn for the germinating seed and will thereby enhance germination rate and early seedling growth.
(II) Low content of Mn in seeds of Swedish winter wheat will result in a reduced germination rate and early seedling growth compared to seeds with a higher Mn content.
(III) The response to Mn coating on germination rate and early growth is dependent on the seed Mn content where seeds with a low Mn content will respond to a greater extent to Mn seed coating.
3.1 Mineral nutrients in soil
Mineral nutrients are important for plants and can appear in the soil in many forms. Many mineral nutrients can be a part of soil minerals and incorporated into both primary and secondary soil minerals. These mineral nutrients are bound hard in the soil minerals and are therefore not available for plant uptake. In the long term, these soil minerals can wither, and the mineral nutrients can then become available for plants. Mineral nutrients can also be found in organic matter in the soil, adsorbed to complexes or dissolved in the soil solution (Eriksson et al. 2011). It is the mineral nutrients in the soil solution that are available for plant uptake. The concentration of mineral nutrients in the soil solution is often low and the ability for the mineral nutrients to move in the soil solution depends on the properties of the element as well as the water content (Marschner 2012).
3.1.1 Manganese in soil
The topsoil can contain as much as 3 000 kg Mn per ha, but most of the Mn is strongly bound in soil minerals or into organic complexes. The amount of Mn avail-able for the plant is therefore mainly not affected by the total content of Mn in the soil but by other factors (Eriksson et al. 2011; Marschner 2011). The most important factors regulating the availability of Mn in the soil is the redox potential, soil pH and soil organic matter. The oxidation forms Mn(II), Mn(III) and Mn(IV) are all present in soil to various extent depending on the redox state in the soil. Mn(II) is the form that is present in the soil solution and is available for plant uptake. In an aerated soil, Mn(II) can oxidise to Mn(III) and Mn(IV) which are forms not availa-ble for the plant to utilise (Eriksson et al. 2011). There are also several soil
organisms that are able to oxidise and reduce Mn. The composition of the rhizo-sphere microbiota can therefore affect the availability of Mn (Marschner 2012). pH is also a factor that has a big impact on the availability of Mn. The higher the soil pH, the more unavailable Mn gets due to precipitation to unsolvable secondary min-erals (Eriksson et al. 2011). When soil pH becomes higher than 6.5, the availability of Mn is negatively affected. A temporary decrease of pH may occur with soil ap-plied mineral fertilisers. Mineral fertilisers such as ammonia has an acidifying effect and can thereby increase the availability of soil Mn (Pedersen 2004). The soil or-ganic matter content affects the Mn availability by making complexes with Mn and an increase in organic matter decreases the availability of Mn (Marschner 2012). Also, a soil high in organic matter is often more aerated which leads to oxidising conditions (Stoltz & Wallenhammar 2011).
3.2 Functions of mineral nutrients in plants
Essential mineral nutrients are elements required in all plants to fulfil their lifecycle. These are elements that are necessary for plant metabolism and which cannot be replaced by any other elements. Over all, there are 14 elements that are essential for plants (Marschner 2012). These elements can be divided into macro- and micronu-trients depending on the amount needed by the plant and the concentrations within the plant. The macronutrients are nitrogen (N), phosphorous (P), sulphur (S), potas-sium (K), calcium (Ca) and magnepotas-sium (Mg) which are needed in large amounts, around 10-300 kg per ha depending on the element. The micronutrients, just as es-sential but needed in smaller amounts are iron (Fe), manganese (Mn), boron (B), zinc (Zn), copper (Cu), molybdenum (Mo), chlorine (Cl) and nickel (Ni). The need of micronutrients for plant growth is <1 kg per ha except for Fe and Cl where the need of these mineral nutrients is <10 kg per ha (Eriksson et al. 2011; Marschner 2012).
3.2.1 Functions of manganese
Manganese is mostly found as a divalent cation in the plant cell. The element is important in redox processes and can be oxidised to Mn(III) and Mn(IV) in the plant. The most common role of Mn in a plant cell is to act as a cofactor for many enzymes with different functions. Mn2+ is the most common form to activate enzymes and
about 35 enzymes can be activated by Mn (Marschner 2012). For many enzymes can Mn2+ be replaced by Mg2+. This is because Mgin many ways resembles Mn
(Mengel & Kirkby 1987). This replacement can occur if Mgis overrepresented within the cell or if Mn is lacking. Still, Mnis often more effective as a cofactor than
Mg (Marschner 2012). Even though Mn often is a cofactor activating enzymes, there are also three enzymes within plant cells containing Mn. One of them is superoxide dismutase (MnSOD) that protects the cells from oxidative stress. The two other en-zymes containing Mn are an enzyme present in the oxygen evolving complex in photosystem II and the enzyme oxalate oxidase. These three enzymes cannot be replaced by Mg and a deficit seriously affects the functions of these enzymes (Wil-liams & Pittman 2010).
3.3 The seed and mineral nutrients within the seed
A seed consists of different parts where the components can differ a bit depending on the species. Monocotyledonous plants have seeds that consists of three parts, an embryo, an endosperm and a seed coat. The embryo is the structure that will be the new plant when the seed has germinated. The embryo of a monocotyledon consists of a hypocotyl (embryonic shoot), a radicle (embryonic root) and a coleoptile (cov-ering the first leaves) (Bewley et al. 2013). There is no cotyledon in the seed for species within the family Poaceae. Instead, the cotyledon structure has been modi-fied to a scutellum and is located between the embryo and endosperm (Taiz et al. 2018). Depending on the species, the endosperm can be of different importance. In cereals, the endosperm is the largest part of the seed and contains a mayor part of the energy storage within the seed, mostly starchy non-living cells. The outer part of the endosperm is called the aleurone layer and differs from the rest of the endo-sperm because it consists of thick-walled living cells. The seed coat, also called the testa, consists of non-living cells and is protecting the embryo and endosperm from the external environment (ibid.).
The distribution of mineral nutrients varies between the different parts of the seed. In a study by Moussavi-Nik et al. (1997b), the content of mineral nutrients of two different wheat cultivars were examined. They found that the mineral nutrients were distributed differently depending on the cultivar and that the cultivars had dif-ferent ability to remobilise these reserves during germination. In general, 55-77 % of the mineral nutrients were situated in the seed coat, 11-37 % were situated in the endosperm, and 4-14 % were situated in the embryo.
3.3.1 Manganese in the seed
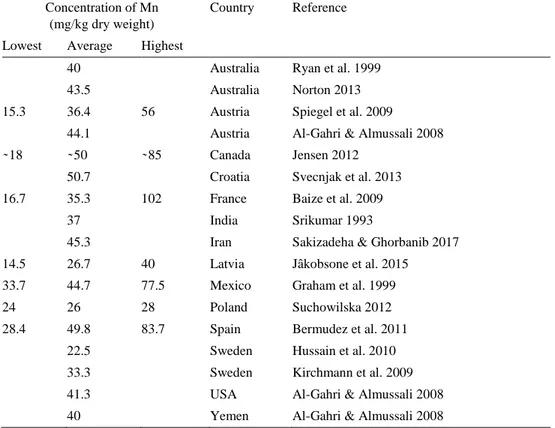
The concentration of Mn within the seed can vary greatly both between and within species, even though when they are grown on the same site. Normal concentrations found in wheat seeds can be seen in table 1. In general, wheat has higher concentra-tion of Mn than barley (Longnecker & Uren 1990). This was also seen in a large
number of cereal seeds from the Swedish environmental monitoring program on arable soils, where barley seeds on average had the lowest concentration of Mn, oats the highest and wheat in between (Eriksson et el., 2010). When analysing seeds for mineral nutrients, analyses are made on concentrations to get a unit independent of weight. However, it is the total content of Mn in the seed rather than concentration that is crucial for growth of the individual seedling. The amount of Mn needed for germination and early seedling growth probably differs between species which can be a reason for different concentrations of Mn within the seed (Hamnér 2012). Most of the Mn is situated in the seed coat. In the study of Moussavi-Nik et al. (1997b) around 64 % of the Mn could be found in the seed coat, 14 % in the endosperm and 22 % in the embryo.
Table 1. Manganese concentrations in wheat seeds, compiled from international studies Concentration of Mn
(mg/kg dry weight)
Country Reference
Lowest Average Highest
40 Australia Ryan et al. 1999
43.5 Australia Norton 2013
15.3 36.4 56 Austria Spiegel et al. 2009
44.1 Austria Al-Gahri & Almussali 2008
̴ 18 ̴ 50 ̴ 85 Canada Jensen 2012
50.7 Croatia Svecnjak et al. 2013
16.7 35.3 102 France Baize et al. 2009
37 India Srikumar 1993
45.3 Iran Sakizadeha & Ghorbanib 2017
14.5 26.7 40 Latvia Jâkobsone et al. 2015
33.7 44.7 77.5 Mexico Graham et al. 1999
24 26 28 Poland Suchowilska 2012
28.4 49.8 83.7 Spain Bermudez et al. 2011
22.5 Sweden Hussain et al. 2010
33.3 Sweden Kirchmann et al. 2009
41.3 USA Al-Gahri & Almussali 2008
3.4 Seed germination, seedling establishment and the role
of mineral nutrients
Defining germination can be difficult since it is a process were many events occurs simultaneously. Bewley et al. (2013) defined germination as following;
“Germination begins with water uptake by the seed (imbibition) and ends with the start of elongation by the embryonic axis, usually the radicle, through the structures surround-ing it”.
The dry, mature seed can be stored for a long time and will not germinate until conditions are favourable. This state is called quiescence and during quiescence the metabolism within the seed is low. The most important factors to initiate germina-tion is the presence of water, the right temperature and the presence of oxygen (Bew-ley et al. 2013). Other factors can also be needed for germination depending on the species to occur such as different chemical compounds and for some species can an additional treatment be necessary (Taiz et al. 2018).
A dry seed normally contains 5-15 % water (ibid.). When germination starts, the seed imbibes water and the seed water content increases until the seed contains about 40-50 % water. The imbibition of water is possible due to a difference in water potential between the seed and the external environment. This increase in water con-tent makes the metabolic activity increase and the metabolic activity can start within minutes after imbibition (Bewley et al. 2013). When the seed is fully imbibed, and the metabolic activity has started, the mobilisation of the seed reserves begins. The scutellum produces a plant hormone called gibberellin that works as a signal to ac-tivate cells in the aleurone layer. These cells, when acac-tivated, produces and releases hydrolytic enzymes that breaks down the endosperm cells and makes the hydrolysed energy storage and mineral nutrients mobile within the seed (Yan et al. 2014). These nutrients are then transported to the growing embryo by the scutellum (Taiz et al. 2018). The remobilisation of mineral nutrients from the seed coat during germina-tion is relatively small except for K (Moussavi-Nik et al. 1997b). Only a part of total seed content of the mineral nutrients is available for the growing embryo during germination and a part of the content might even be leached from the seed during germination (Bityutskii et al. 2002).
When the elongation of the radicle starts, the germination has come to an end and the plant enters the phase of seedling establishment. Seedling establishment is not well defined and Taiz et al. (2018) give some descriptions of when the phase of seedling establishment can be described as over:
“-the exhaustion of the seed reserves -the appearance of the first leaf
-the stage which environmental conditions begin to exert selective pressure on seedling survivorship
-the point at which the seedling is capable of self-sustained growth”
When the seedling establishment begins, there is an increase in water uptake by the germinated seed. This increase of water is due to an increased water absorption by cells for cell expansion and the water uptake increases as the seedling grows (Bew-ley et al. 2013; Taiz et al. 2018).
Most of the energy storage and mineral nutrients remains within the seed after germination and are ready to be remobilised during seedling establishment (Bewley et al. 2013). The remobilisation of energy storage and mineral nutrients is primarily to the growing parts of the seedling and the remobilisation rate increases as the seed-ling grows. In a study of Moussavi-Nik et al. (1997b) the mineral nutrients from the endosperm were completely exhausted after 10 days in wheat. Micronutrients such as K, P, Ca and Fe are the most mobile mineral nutrients during germination and seedling growth. Even after germination, when the demand of mineral nutrients by the seedling increases, the mobility of Mn, Cu and Zn are still quite low from the seed coat (ibid.). Loading mineral nutrients such as Mn into the seed coat is some-what an unnecessary process since most of the nutrients within the seed coat will not remobilise and benefit the seedling during early growth. Bityutskii et al. (2002) therefore suggest breeding for cultivars with a low micronutrient content in the seed coat to make better use of the mineral nutrient seed reserves.
3.5 Manganese in Swedish soils and cereals
The Swedish environmental monitoring program on arable soils has been conducted since 1988 on over 2 000 locations. This inventory is carried out to monitor the status and time trends for the arable soils in Sweden and how the quality of the crop is related to the soil properties (Eriksson 2018). The soil samples from the inventory show that there is a great range in Mn concentrations in Swedish arable soils. Meas-urements made between 2001 and 2007 show that soil Mn concentrations vary be-tween 90 and 9 528 mg Mn/kg dry weight in the topsoil with a median concentration of 369 mg Mn/kg (extraction with HNO3). The inventory also shows that there are
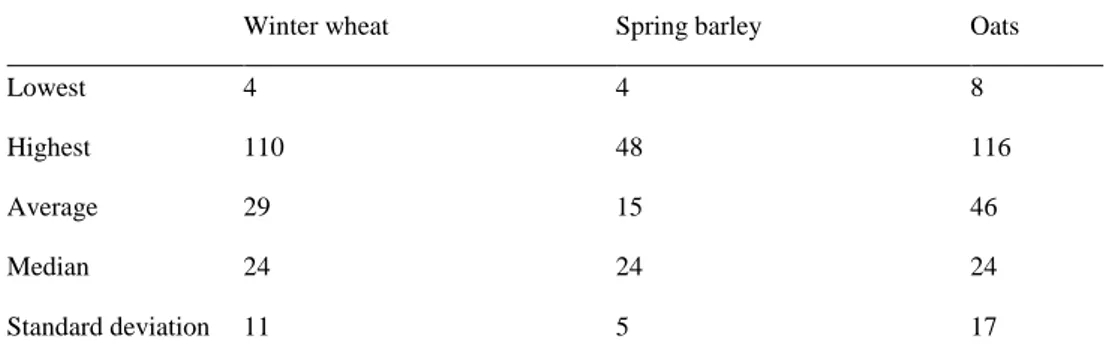
relatively small changes in Mn concentrations in soil over time since the start in 1988 (Eriksson et al. 2010). In locations where winter wheat, spring barley or oats were grown in the year of the sampling, seeds were collected. The seed samples were analysed for the most important mineral nutrients, both macro- and micronu-trients as well as other trace elements (Eriksson 2018). The Mn concentration in Swedish winter wheat, spring barley and oats were on average 29, 15 and 46 mg Mn/kg dry weight respectively, from the three different sampling periods (1988-1995, 2001-2007 and 2011-2013) (Miljödata-MVM 2019). The range of Mn con-centrations in these crops are shown in table 2.
Table 2. Concentrations of Mn in Swedish cereal seeds. Reworked from Miljödata-MVM (2019). Concentrations of Mn in the seed (mg/kg dry weight)
Winter wheat Spring barley Oats
Lowest 4 4 8
Highest 110 48 116
Average 29 15 46
Median 24 24 24
Standard deviation 11 5 17
3.6 Manganese deficiency during vegetative growth
Deficiency of Mn in the plant can occur during its entire development and can have different effects depending on when the deficiency occurs. Mn deficiency in cereals often occur early in the season and can lead to reduced growth and that plants get more sensitive to freezing temperatures. This can result in a decreased stand and lead to a potential yield loss if not compensated by tillering (Marschner 2012; Stoltz & Wallenhammar 2011; Williams & Pittman 2010).
When a plant suffers from Mn deficiency, photosynthesis is negatively affected, and the amount of chlorophyll decreases in the plant cells (Marschner 2012). Leaves of cereals can brighten and long greyish spots with a brown border can appear be-tween the nerves of the leaves (Börling 2017). Because Mn has a low phloem mo-bility and is mainly transported through the xylem directly when it is taken up by the roots, it is the youngest leaves that gets the first and most severe symptoms. This is because little Mn will be remobilised from older to younger leaves. This will also cause problems when grain filling occurs because little Mn will be remobilised to the developing seed (Pearson & Rengel 1994). Deficiency of Mn is common in ce-reals such as wheat, oats and barley. Cereal cultivars differ in their susceptibility to Mn deficiency and there are cultivars having a more efficient uptake of Mn which was concluded by Moussavi-Nik et al. (1997a). Also, dicotyledons such as sugar beets, oil seed crops and legumes are sensitive to deficits of Mn (Börling 2017).
Critical concentrations of Mn in plant tissue for optimal growth and yield has been described by many authors. In general, the critical concentration of Mn in fully expanded leaves is between 10 and 20 mg/kg dry weight depending on the crop (Marschner 2012). No critical concentration of seed Mn concentrations for germi-nation could be found in reviewed literature. For seedling growth, it has been con-cluded by several studies that a low content of Mn can negatively affect growth, development and can even result in a decreased yield, especially if sown in soils
with a low availability of Mn (Kabaz-Saberi et al. 2000; Longnecker et al. 1991; Marcar & Graham 1986; Moussavi-Nik et al. 1997a). In the study of Marcar and Graham (1986), they used wheat seeds with a content range of 0.1-6.4 µg Mn/seed. They showed that the early growth of the wheat seedling was affected by the seed Mn content and that a low content resulted in severe symptoms of Mn deficiency and a reduced seedling growth. A critical limit where a 10 % reduction of the shoot and root weight of the seedling was detected for a Mn content <5.3 µg Mn/seed for the shoot and <4.2 µg Mn/seed for the root (Marcar & Graham 1986).
3.7 Micronutrient applications to crops
When or before deficits are seen in the crop, micronutrients can be applied to sup-port the plant and its growth (Marschner 2012). Mineral nutrients can be applied in many different ways and the amount applied differ depending on the nutrient. The most common methods to apply micronutrients is as mineral fertilisers and foliar applications with liquid fertilisers (Börling 2017). Seed treatments with micronutri-ents exist but to what extent it is used depends on the mineral nutrient and the crop. Micronutrient seed treatments can positively affect the establishment, growth, yield and also the content of micronutrient in harvested seeds (Farooq et al. 2012). Seed treatments can be made by pelleting, priming or coating (also called filmcoating). Both priming and coating are methods that can be used to apply micronutrients on the seed but with different techniques. When seeds are primed, they are soaked in a micronutrient solution. Priming gets the seed to imbibe the solution, but germination is then interrupted by drying the seed. Coating of seeds is done by adding a thin layer of a micronutrient solution and often also adding a binder to get the micronu-trient to stuck to the seed (Halmer 2008).
3.7.1 Manganese applications to crops
Soil applied Mn is not recommended by the Swedish Board of Agriculture because the Mn easily and fast can become unavailable for the plant (Börling 2017). In Den-mark there have been field trials where mineral fertilisers containing Mn have been examined. Little effect in yield was observed in winter wheat when using mineral fertilisers containing Mn (Pedersen 2004). The most commonly used and effective method to supply the plant with Mn is by foliar applications. Foliar applications with Mn can be made from the time of seedling establishment and throughout the plant’s development (Farooq et al. 2012). If winter wheat or winter barley is grown on a soil with a low availability of Mn, foliar application already on the autumn can
increase the winter survival of the crop and increase the yield (Pedersen 2004). Fo-liar applications with Mn can also be necessary to apply several times during the cropping season to supply the regrowth. This is because of the difficulty to translo-cate Mn within the plant (Börling 2017).
Seed treatments with Mn have been studied in many crops and seed coating with Mn is recommended by the Swedish Board of Agriculture in winter wheat if the soil is known to have a low availability in Mn (ibid.). Priming with MnSO4 has been
shown to increase the growth and yield of wheat and barley (Longnecker et al. 1991; Marcar & Graham 1986). The establishment of the stand can also be improved by priming seeds with Mn (Farooq et al. 2012). Ullah et al. (2017) conducted a study where both priming, coating and foliar applications of Mn were studied on an alka-line calcareous soil. All Mn treatments increased the yield compared to control and the Mn concentrations in the harvested seeds. In this study, the highest yield was obtained after seed priming followed by foliar applications and seed coating. Ullah et al. (2017), also concluded that the most cost-effective way to supply the plant with Mn was by seed treatments, especially seed coating because of a low require-ment of the amount of Mn for coating.
Swedish studies conducted with seed coating products containing Mn have been made by Ekre (2000), Stoltz and Wallenhammar (2015) and Svanström (2017) on winter wheat, triticale, spring wheat, barley, oats, and spring oilseed rape. These studies do not only include coating products with Mn but also with other mineral nutrients such as B, P and Zn. The results of these studies show no clear effect of seed coating with mineral nutrients. Ekre (2000) studied coating with Mn compared with compaction after sowing (to create more reducing conditions) and foliar appli-cations of Mn in winter wheat, triticale, barley and oats. The best effect on yield in all crops was compaction after sowing and the effect of Mn seed coating was small (Ekre 2000). Some effects on germination and seedling growth could be seen by coating spring wheat, barley, oats, and spring oilseed rape seeds with micronutrients (Stoltz & Wallenhammar 2015). However, the effect of the different coating prod-ucts varied in the study and overall no clear conclusions from this study could be drawn. One of the products used in this study contained MnSO4 which was the
prod-uct Norotec Mn. No difference in germination and seedling dry weight could be shown in any of the cereals tested between uncoated and coated seeds. One excep-tion was in oats where there was a negative effect on germinaexcep-tion and seedling growth by coating the seeds with Norotec Mn. Svanström (2017) who studied dif-ferent seed coating products in spring oilseed rape did also not see an increase in emergence, growth or yield of Mn coating. Seed treatment with Mn does often not cover the plants entire need of Mn and often needs to be combined with foliar ap-plications (Börling 2017).
4.1 Selection of seed samples and experimental design
The winter wheat seed samples used in the experiments were collected from the Swedish environmental monitoring program on arable soils from the cropping sea-son 2017. Prior to the current experiments, analyses of winter wheat seeds concen-trations of the most important mineral nutrients, both macro- and micronutrients, and trace elements had been conducted. The seed samples were analysed with an ICP-SFMS (Inductive coupled plasma sector field mass spectrometer; Eriksson 2018; Eriksson et al. 2010).
The samples used were selected depending on their seed Mn concentration. Con-centrations chosen corresponded to the range of conCon-centrations in samples from 2017, where the highest concentrations were 51 mg Mn/kg dry weight and the low-est were 8 mg/kg dry weight (Eriksson, 20181). Thousand grain weight (Tgw) was
measured for the chosen seed samples whereby the Mn content of the seeds was calculated. The samples were divided into three groups depending on their Mn con-tent, low (0.42-0.70 µg Mn/seed), medium (1.04-1.08 µg Mn/seed) and high (1.22-1.83 µg Mn/seed). Selection of samples also regarded content of other nutrients to avoid potential negative effects on germination due to low content. Only the cultivar Julius was used in the experiment to exclude differences in germination rate and Mn efficiency due to different cultivars. Julius was chosen since it was the most com-mon cultivar in the dataset which also had the largest variation of Mn concentra-tions.
In table 3, the different seed samples, Mn content, Mn concentration and the different treatments can be seen.
1. Jan Eriksson, personal communication, 2018-11-20
Table 3. Experimental design. Sample Mn content (µg/seed) Mn concentration (mg/kg) Level of content Coating
1 A/B 0.42 11 Low Deionised water/Norotec Mn
2 A/B 0.54 15 Low Deionised water/Norotec Mn
3 A/B 0.70 14 Low Deionised water/Norotec Mn
4 A/B 1.04 21 Medium Deionised water/Norotec Mn
5 A/B 1.06 22 Medium Deionised water/Norotec Mn
6 A/B 1.08 20 Medium Deionised water/Norotec Mn
7 A/B 1.22 30 High Deionised water/Norotec Mn
8 A/B 1.50 30 High Deionised water/Norotec Mn
9 A/B 1.83 42 High Deionised water/Norotec Mn
4.2 Preparation of the seed samples
Two samples of 13 g from each seed sample were weighed up and treated with de-ionised water or Norotec Mn. Norotec Mn is a product marketed in Sweden for seed coating of cereals and contains MnSO4. The recommendation for Norotec Mn is 3
litres per ton of wheat which corresponds to 450 µg Mn/g seed (Norotec 2013). The seeds were put in plastic tubes and the liquids were pipetted and applied. The plastic tubes were put in a shaker for 1.5 hours to get an even distribution of the liquids. These seeds were then used for two experiments, referred to as Germination test and Seedling establishment test in the following text.
4.3 Germination test
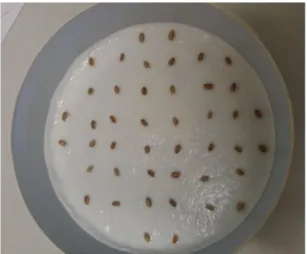
Ash free seed testing papers (Ahlstrom-Munksjö, 1731 - White, plain) with a diam-eter of 17 cm were placed on a plastic plate and wetted with 30 ml of deionised water to make the seed testing papers saturated. Forty-four seeds were placed on each plate (Figure 1) and the plates were then covered with a plastic bag to avoid evaporation. Three plates were used for each replicate, which resulted in 54 plates in total. The plates were placed in a growth cabinet with 12 hours of light (day) and 12 hours of dark (night) at the temperatures 15°C and 10°C, respectively.
Figure 1. Plate with wetted seed testing paper and seeds for germination test (Photo: Kerstin
Wahlquist).
The seeds were monitored every day for 10 days where the number of germinated seeds were counted, and the growth stage of the germinated seeds were determined. After 10 days all seedlings from each plate (Figure 2) were harvested and dried for 24 hours at 40 °C. The seeds were removed from the seedling and the seedlings were weighed.
4.4 Seedling establishment test
The sand used in the seedling establishment test was a nutrient poor, washed sand with a particle size of 0.6-0.8 mm with a pH of 7.4. The sand was mixed with a nutrient solution containing all essential nutrients except Mn and deionised water (Table 4). Five hundred g of sand were added to plastic pots with a size of 8*8*9 cm. The pots had openings at the bottom which was covered with a fabric to avoid sand to pass through but let water in from the bottom. The sand was evened out and 16 seeds were placed on the surface in each pot which can be seen in figure 3. The seeds were then covered with another 200 g of sand which corresponded to a sowing depth of approximately 3 cm. Five pots were used for each replicate, which resulted in 90 pots in total. The pots were placed in troughs with 12 pots in each trough. Five litres of water were added in each trough to support the seeds with water. The throughs were placed in growth cabinets with 12 hours of light (day) and 12 hours of dark (night) at the temperatures 15 °C/10 °C, day/night.
Table 4. Nutrient solution for the seedling establishment test.
Chemical Concentration (mg/ml) Amount per pot (mg)
NH4NO3 3.95 35 K2SO4 8.23 72 MgCl2 8.23 72 ZnCl2 0.10 0.86 FeCl3*6H2O 0.27 2.38 CuSO4*4 H2O 0.05 0.42 NaB4O7*10H2O 0.05 0.43 Na2MoO4*2H20 0.02 0.18 Ni(NO3)2*6H2O 0.01 0.11 Added as a solid CaHPO4 72
Figure 3. Pot with sand and seeds for seedling establishment test (Photo: Kerstin Wahlquist).
The pots were monitored every day where numbers of emerged seedlings and the growth stage of the germinated seeds were determined. Four weeks (28 days) after sowing, the seedlings were harvested and divided into shoot and root (Figure 4), dried for 48 hours at 40°C and weighed.
Figure 4. Seedlings on the 28th day before harvesting (left). Seedlings from one pot divided into shoots
4.5 Statistics
Collected data included developmental stage and dry weights from the germination test and seedling establishment test. All plates/pots from each sample were treated as one replicate. When comparing the dry weights of seedlings, shoots and roots, the dry weights were expressed as dry weight per plant. Not all seeds germinated, and the non-germinated seeds were excluded from the calculations of seedling dry weight.
All data was processed in Excel and used for statistics. The program used for statistics was SAS JMP 13.0.0. Statistics was made on development and seedling dry weight, comparing low, medium and high levels of Mn content and coated and uncoated seeds. To see if there were any significant differences a one-way analysis of variance (ANOVA) was done. If a significant difference was detected, Tukey’s honestly significant difference test (HSD) was used to identify differences between treatments.
To analyse correlations between seedling dry weights and nutrient contents and Tgw, a regression analysis was made. When correlating the seedling dry weights to the seed Mn content and concentration, only the uncoated seed were used. This was done to exclude differences due to a potential effect of the seed coating. The level of significance was set to 5 % (p ≤ 0.05) for all statistics.
5.1 Germination test
5.1.1 Germination and seedling development over time
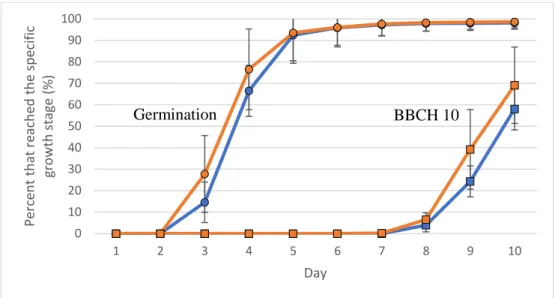
In the germination test, almost all seeds (98 %), coated or not, had geminated after 10 days. The highest growth stage the seedlings reached was BBCH 10, correspond-ing to the emergence of the first leaf from the coleoptile. The results from the ger-mination test showed no significant difference between coated and uncoated seeds in percentage of germinated seeds. The seeds started to germinate on the third day and on the third and fourth day the treated seeds seemed to have germinated in a higher rate than the untreated seeds, but the difference was not significant (Figure 5). After the fourth day, no difference in germination rate was detected between the coated and uncoated seeds.
The percent of germinated seeds when comparing the different levels of seed Mn content can be seen in figure 6. There seemed to be a difference when comparing the germination rate between the different levels of seed Mn content (low, medium and high), coated and uncoated, from the third until the sixth day. However, these differences were not significant.
On the 7th day, the first seedlings reached the growth stage BBCH 10 which can be seen in figure 5. When comparing the coated and uncoated seeds as well as the different levels of Mn content, there seemed to be a difference in percentage of seedlings to have reached BBCH 10 on the 9th and 10th day, but the difference was not significant (Figure 5 and 6).
Figure 5. Percentage of germinated seeds (circles) and the percent that reached BBCH 10 (squares)
over time when comparing uncoated (blue) and coated (orange) seeds in the germination test. No sig-nificant differences between treatments were detected. Error bars show standard deviations.
Figure 6. Percentage of germinated seeds (circles) and the percent that reached BBCH 10 (squares)
over time of uncoated (solid with black borders) and coated (dashed) seeds with low (red), medium (yellow) and high (green) content of Mn in the seeds in the germination test. No significant differences between treatments were detected.
5.1.2 Seedling dry weights
When comparing dry weights per seedling at the end of the germination test there was no differences between coated and uncoated seeds or between levels of Mn content (Figure 7). 0 10 20 30 40 50 60 70 80 90 100 1 2 3 4 5 6 7 8 9 10 Perc en t th at re ach ed th e speci fic growth stage (% ) Day Germination BBCH 10 0 10 20 30 40 50 60 70 80 90 100 1 2 3 4 5 6 7 8 9 10 Perc en t th at re ach ed th e speci fic growth stage (% ) Day Germination BBCH 10
Figure 7. Dry weight per seedling after 10 days when comparing the different levels of seed Mn content
in the seed, uncoated (A) or coated (B) in the germination test. No significant differences between treatments were detected. Error bars show standard deviations.
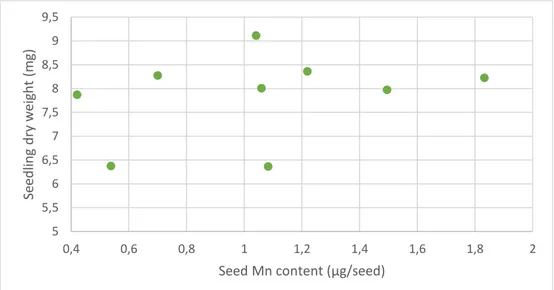
Seedling dry weights of uncoated samples was plotted against the seed Mn content (Figure 8) and seed Mn concentration (data not shown). There was a large variation between the replicates and there was no significant correlation between seedling dry weight and seed Mn content (p=0.44) or seed Mn concentration (p=0.65).
The seedling dry weights were also plotted against seed contents of other analysed mineral nutrients (P, K, Mg, Zn, Cu, Mo and Ni) as well as Tgw but no significant correlations were found.
Figure 8. Dry weights of the uncoated seedlings in the germination test plotted against seed Mn content
(Bivariate fit, p=0.44). 0 1 2 3 4 5 6 7 8 9 10
Low Medium High
Se ed ling d ry w eight (m g) A B 5 5,5 6 6,5 7 7,5 8 8,5 9 9,5 0,4 0,6 0,8 1 1,2 1,4 1,6 1,8 2 Se ed ling d ry w eight (m g)
5.2 Seedling establishment test
5.2.1 Seedling development over time
The total germination rate in the seedling establishment test was 99 %. The highest growth stage the seedlings reached was BBCH 12 which is when the second leaf is unfolded. No visible symptoms of deficiency could be detected on any plants at any time point of the experiment. No difference in total germination rate (% germinated seeds) could be detected between coated and uncoated seeds or between the differ-ent levels of seed Mn contdiffer-ent.
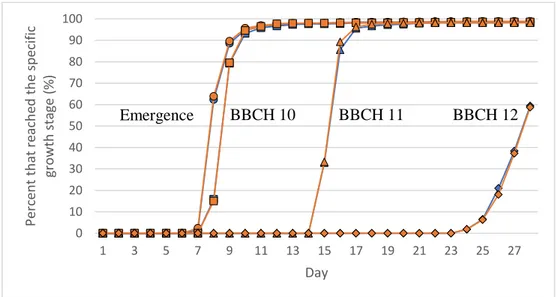
Emergence started on the 7th day. The first seedlings reached BBCH 10, 11 and
12 on the 8th, 15th and 24th day, respectively. There was no difference in the rate of
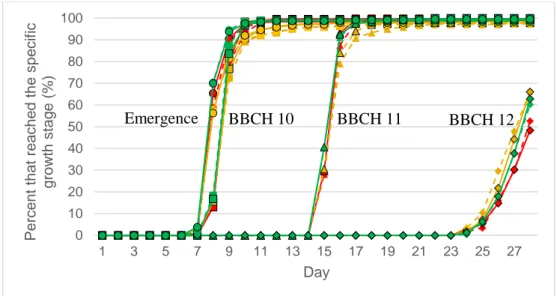
development when comparing the coated and uncoated seeds in any of the growth stages (Figure 9). The percentage of emerged seedlings and seedling reaching BBCH 10, 11 and 12 in the different levels of seed Mn content can be seen in figure 10. When comparing the different levels of seed Mn content, coated or not, there was no difference in the rate of emergence, BBCH 10 and BBCH 11. There seemed to be a difference in the percentage that reached BBCH 12 on the 26th, 27th and 28th
day between the different levels of seed Mn content. The low seed Mn content seemed to reach BBCH 12 in a lower rate but there was no significant difference any of the days.
Figure 9. Percentage of seedlings that emerged (circles), reached BBCH 10 (squares), 11 (triangles)
and 12 (rhomb) over time when comparing uncoated (blue) and coated (orange) seeds in the seedling establishment test. No significant differences between treatments were detected.
0 10 20 30 40 50 60 70 80 90 100 1 3 5 7 9 11 13 15 17 19 21 23 25 27 Perc en t th at re ach ed th e speci fic growth stage (% ) Day Emergence BBCH 10 BBCH 11 BBCH 12
Figure 10. Percentage of seedlings that emerged (circles), reached BBCH 10 (squares), 11 (triangles)
and 12 (rhomb) over time when comparing low (red), medium (yellow) and high (green) content of Mn in the seeds, uncoated (solid with black borders) or coated (dashed) in the seedling establishment test. No significant differences between treatments were detected.
5.2.2 Seedling dry weights
The seedling dry weights did not differ when comparing the coated and uncoated seeds. In addition, there was no difference in seedling dry weight between the dif-ferent levels of seed Mn content, coated or not, which can be seen in figure 11. The lowest content of seed Mn seemed to have the lowest dry weight followed by the highest and the medium concentration, but this difference was not significant. When separating the dry weight of the shoot and the root, still no difference between the coated and uncoated seeds could be detected. When comparing the different lev-els of seed Mn content, the low content showed a tendency to have both a lower shoot and root weight, but the difference was not significant (Figure 12 a, b).
0 10 20 30 40 50 60 70 80 90 100 1 3 5 7 9 11 13 15 17 19 21 23 25 27 P erc en t tha t rea c he d the s pe c if ic grow th s tag e (%) Day Emergence BBCH 10 BBCH 11 BBCH 12
Figure 11. Seedling weight of the uncoated (A) and coated (B) seeds of the different levels of seen Mn
content. No significant differences between treatments were detected. Error bars show standard devi-ations of seedling dry weight.
Figure 12. Dry weight of shoot (a) and root (b) of uncoated (A) and coated (B) seeds with different
levels of seed Mn content. No significant differences between treatments were detected. Error bars show standard deviations.
The dry weight of the seedlings was plotted against the seed Mn content (Figure 13) and seed Mn concentration (data not shown). There was a big variation between the replicates and the correlation between dry weight and seed Mn content (p=0.30) and seed Mn concentration (p=0.64) was not significant.
The dry weight was also plotted against the contents of P, K, Mg, Zn, Cu, Mo, Ni in the seed and the Tgw. There was a better correlation for some of the other
0 10 20 30 40 50 60
Low Medium High
Wei gh t (m g) A B 0 5 10 15 20 25 30 35
Low Medium High
Sh o o t d ry w eight (m g) A B (a) 0 5 10 15 20 25 30 35
Low Medium High
Roo t d ry w eight (m g) A B (b)
mineral nutrients and for Tgw than for the seed Mn content. Significant correlations with seedling dry weight for content of Mg (p=0.004; R2=0.72) and Zn (p=0.043; R2=0.47). The overall best correlation was found between seedling dry weight and Tgw (p=0.0035; R2=0.73; Figure 14).
Figure 13. Dry weights of the uncoated seedlings in the seedling establishment test plotted against
seed Mn content (Bivariate fit, p=0.30).
Figure 14. Dry weights of the uncoated seedlings in the seedling establishment test plotted against
Tgw (Bivariate fit, p=0.0035). 30 35 40 45 50 55 0,4 0,6 0,8 1,0 1,2 1,4 1,6 1,8 2,0 Se ed ling d ry w eight (m g)
Seed Mn content (µg/seed)
R² = 0,7259 30 35 40 45 50 55 30 35 40 45 50 55 Se ed ling d ry w eight (m g)
6.1 Influence of Mn coating
The results showed no difference in the rate of development between coated and uncoated seeds in neither the germination test nor the seedling establishment test. There seemed to be a difference in the percent between the coated and uncoated that reached BBCH 10 in the germination test, but the difference was not significant, and this could not be seen in the seedling establishment test.
The seedling weights of the coated and uncoated seeds were very similar, and no difference could be seen in neither the shoot- nor the root dry weight between the coated or uncoated seeds in the seedling establishment test.
Over all, no difference could be seen between the coated and uncoated seeds which was unexpected. No Mn was applied in any of the tests and a high addition of Mn as a seed coating was expected to increase the growth of the seedling com-pared to the ones that had no addition of Mn. The product used, is marketed as to enhance root and shoot biomass but this effect could not be shown in any of the tests. These results are contradicting several of studies where Mn coating and prim-ing have been used. Marcar and Graham (1986) and Longnecker et al. (1991) both saw an increase in biomass after coating or priming wheat and barley seeds with Mn. Other effects shown with Mn coating is an increase in final seed yield in barley and wheat (Longnecker et al. 1991; Ullah et al. 2017) but this was not studied in this project. Other Swedish studies where Mn seed coating products were used showed no or an uncertain effect in biomass and yield (Ekre 2000; Stoltz & Wallenhammar 2015; Svanström 2017). Although not all of them studied cereals, they all came to the same conclusion that the effect of Mn coating was uncertain. Whether Mn coat-ing products have an effect of enhanccoat-ing growth is still uncertain after this study. Also, this thesis does not cover the effect of Mn coating on winter survival of the crop and yield. However, the study executed by Ekre (2000) which included winter wheat, showed no effect on winter survival or final seed yield by coating the seed
with Mn. With this thesis and earlier studies, it is questionable whether the Swedish Board of Agriculture should recommend Mn seed coating when soils are low in available Mn.
6.2 Influence of seed Mn content
There was no difference in the rate of plant development between the different levels of seed Mn contents. In the seedling establishment test there seemed to be a differ-ence, but not significant, in time needed for the plants to reach BBCH 12. On the 27th and 28th day the samples with low content of seed Mn seemed to reach BBCH
12 in a lower rate. Further development after the 28th day would have been inter-esting to study. Would there be a difference in development rate between the differ-ent levels of seed Mn contdiffer-ent if the experimdiffer-ent had kept on for another week?
The results from the germination test showed no difference between the different levels of seed Mn content in seedling dry weights. In the seedling establishment test there seemed to be a difference between the different levels of seed Mn content in dry weights. The low content of seed Mn seemed to have both a lower shoot- and root dry weight which is in line with the hypothesis, although this was not signifi-cant. This difference could also potentially increase if the experiment had kept on longer.
In regression analyses between seedling dry weights and Mn seed content and concentration, no correlation could be seen in any of the studies. Not seeing a dif-ference in seedling-, shoot- or root dry weight depending on the seed Mn content and concentration was unexpected. Studies show that a low content or concentration of seed Mn results in a lower seedling biomass in cereals (Khabaz-Saberi 2000; Longnecker et al. 1991; Marcar & Graham 1986; Moussavi-Nik et al. 1997a). Mar-car and Graham (1986) concluded that a critical Mn level, where a reduction of 10 % in shoot- and root dry weights after 36 days in wheat is 5.3 µg/seed and 4.2 µg/seed respectively. The Mn content in the seeds used in this study were between 0.42 and 1.83 which is much lower than the critical level set by Marcar and Graham (1986). In Marcar and Graham (1986) it was shown that below the critical level, the lower the seed Mn content, the lower the seedling weight was. Although the seedling establishment test only kept on for 28 days, one might have expected that the seed-ling- shoot- and root weights would show the same pattern in this study.
Only nine different samples of seeds were used in the experiments of this thesis and to have a more accurate evaluation, more samples with the same or even lower seed Mn content would have been needed. The lowest content of seed Mn used in this study could potentially have been enough for optimal germination and seedling growth, which could be a reason for the lack of effect in seedling dry weight. There
was also no difference in seedling weight between the coated and uncoated seeds when comparing the different contents, which indicates that there was no difference in response of Mn coating depending on the seed Mn content.
6.3 Influence of other factors
In the germination test, there was no addition of mineral nutrients and no significant correlation was seen with any other factors analysed. In the seedling establishment test, all nutrients but Mn was added to the sand so that no mineral nutrients other than Mn should be a limiting factor for the seedling. Unexpectedly, better correla-tion with seedling dry weight could be seen with the Mg-, Zn content and Tgw than for the seed Mn content and concentration.
A larger seed can provide mineral nutrients to the seedling for a longer time be-fore the seedling has to become self-sufficient (Taiz et al. 2018) and studies con-ducted on wheat have shown that a larger seed weight can have a positive effect on shoot and root dry weight, which is in line with the results of this thesis (Farahani et al. 2011; Moussavi-Nik et al. 2011). No reports concerning a potential effect of seed Mg content on seedling growth could be found. For Zn, there are studies that have shown a positive effect between seed Zn content and seedling growth (Mous-savi-Nik 1998; Rengel & Graham 1995; Yilmaz et al. 1998). Therefore, the seed Zn content might have influenced the seedling dry weight in the seedling establishment test. However, these studies have been conducted on soils low in Zn which is not the case in this study. Rengel and Graham (1995) suggested a critical concentration for Zn on seedling growth of around 10 mg Zn/kg seeds which is lower than the concentrations found in the used seed samples (16-29 mg Zn/kg seeds). Whether it is the Tgw, Mg- or Zn content or a combination of these factors that affected the results in this study can’t be concluded.
The health of the seeds chosen for the study is not known and seed borne diseases could possibly affect the results. However, no signs of diseases were seen on the seedling throughout the time of the germination and seedling establishment test and is therefore not though to be factor influencing the results.
6.4 Evaluation of methods
Large set of seed samples with known Mn concentrations are scarce which made the samples from the Swedish environmental monitoring program on arable soils a motivated choice. To minimise the risks of a difference in germination due to ageing of the seeds, only seeds from one recent year was used. Also, only seeds from one cultivar was used to minimise the risk of differences in germination, seedling growth
and Mn efficiency. These requirements reduced the number of samples to choose from, from 81 different samples of winter wheat to only 20 samples of the wheat cultivar Julius from 2017. Julius had the largest variation in seed Mn concentrations, which made this cultivar the best choice.
The lowest and highest concentrations of seed Mn seen in the dataset of the mon-itoring program was 4 and 110 mg/ kg dry weight seeds respectively which means that a significantly greater difference exists but the number of samples from those cultivars were too small to make a good selection. The seed samples were chosen by their seed Mn concentrations since the seed Mn content was not known. The Tgw was not measured in the existing dataset and the seed Mn content was therefore calculated after sample selection when Tgw had been measured. If the seed Mn con-tent had been known before the sample selection, other seed samples might have been chosen to get a wider range in Mn contents. Overall, it would have been desir-able to have a bigger range of samples from the same cultivar to choose from. Also, an even larger variation of seed Mn content and more uniform seeds concerning contents of other mineral nutrients within the seed would have been desirable.
Concerning the samples used in the experiments, the samples were chosen so that no other mineral nutrients analysed had too low concentrations. However, not all essential mineral nutrients had been analysed and there is a potential risk that other mineral nutrients could have an impact on the results. The replicates within each level of seed Mn content were not grown on the same place and were chosen based on their Mn content. There are, however, varying contents of other mineral nutrients between the replicates which makes the replicates not uniform. Moreover, more uniform seeds could have been obtained if seeds were harvested from plants grown under controlled conditions and similar nutrient supply. Even though the re-sults probably would have been clearer, it would not describe how Swedish winter wheat grown on arable land would respond.
Concerning the seed coating product used in the study, only Norotec Mn was used. Norotec Mn is a product containing MnSO4 and is marketed and sold in
Swe-den and was therefore a suitable choice of product. Pure MnSO4-salt could also have
been used in this study, but the choice was Norotec Mn because it is developed for coating seeds with and has a recommendation for the amount of product to apply. The applied amount of Norotec Mn was 450 mg Mn/kg seed and this amount of Mn corresponds to other studies were seed coating products were used. In Ullah et al. (2017) the used amount of product in that study was 250 and 500 mg/kg seed which is similar to the amount used in this study. More than one product for Mn seed coat-ing could have been used, but the aim of this thesis was not to compare different products for seed coating.
Some materials used to execute the experiments were reused from other studies. For examples were the plates and pots reused and even though they were cleaned,
they could have contained some Mn and therefore been a source of error. Also, the sand used in the seedling establishment was not analysed for Mn content and could potentially contain some Mn which could have influenced the results of the study. However, if the sand or the plates and pots contained Mn, the levels would probably be very low. Also, a risk of contamination of Mn in the salts used in the nutrients solution in the seedling establishment test is possible, but also in this case the amounts should have been low with small effect of the results.
6.5 Future research
The seed Mn content varies depending on the conditions of the location, the climate of the year and the nutrient management of the crop. Years where harvested seeds have a bigger range of seed Mn content, both seeds with a higher and lower content would be interesting to study for their germination and early seedling growth. There are international studies where differences in Mn efficiency by different cultivars have been seen and it would be interesting to study how efficient Swedish cultivars are in exploiting soil Mn.
There was a significant correlation with other mineral nutrients and seedling dry weight in the seedling establishment test. It would therefore be interesting to see if there are other mineral nutrients that can have an impact on early seedling growth depending on the content in the winter wheat seeds, especially Mg and Zn. Also, it would be interesting to see if there is a coeffect of several mineral nutrients for early seedling growth.
In the experiments of this thesis there was no positive effect in seedling growth by coating seeds with Mn. Coating seeds with Mn does not seem to have a certain pos-itive effect on early seedling growth even though the seeds are sown in a soil with a low availability of Mn. This uncertainty makes Mn seed coating not an obvious choice for supplying Mn to avoid a reduced growth of the seedling.
The seed Mn content did not seem to have been limiting factor for germination or seedling growth in any of the experiments conducted in this thesis. However, lower seed Mn content has been seen in Swedish winter wheat than the seeds used for the experiments. Whether those levels are high enough to sustain seedling growth is still unclear.
The following conclusions could be drawn from the hypotheses formulated: (I) Seed coating with Mn will increase the available amount of Mn for the
germinating seed and will thereby enhance germination and early seed-ling growth.
- This could not be confirmed in this study. No difference in germi-nation, development, seedling-, shoot- and root dry weight were seen between seeds coated with Mn and uncoated seeds.
(II) Low content of Mn in seeds of winter wheat will result in a reduced rate during germination and a reduced early seedling growth compared to seeds with a higher Mn content.
- This could not be confirmed in this study. No difference in germi-nation, development, seedling-, shoot- and root dry weight were seen independent of the seed Mn content.
(III) The response to Mn coating on germination and early growth is depend-ent on the seed Mn contdepend-ent where seeds with a low Mn contdepend-ent will re-spond to a greater extent to Mn seed coating.
- This could not be confirmed in this study. No difference in response to Mn coating depending on the seed Mn content was seen in ger-mination, development, seedling-, shoot- and root dry weight.
Al-Gahri, M. A. & Almussali, M. S. (2008). Microelement contents of locally produced and im-ported wheat grains in Yemen. E-Journal of Chemistry, 5(4), pp. 838-843.
Baize, D., Bellanger, L. & Tomassone, R. (2009). Relationships between concentrations of trace met-als in wheat grains and soil. Agronomy for Sustainable Development, 29(2), pp. 297-312. Bermudez, G., Jasan, R., Plá, R. & Pignata, M. L. (2011). Heavy metal and trace element
concentra-tions in wheat grains: Assessment of potential non-carcinogenic health hazard through their con-sumption. Journal of hazardous materials, (193), pp. 264-271.
Bewley, J. D., Bradford, K. J., Hilhorst, H. W.M. & Nonogaki, H. (2013). Seeds: Physiology of
de-velopment, germination and dormancy. 3rd ed., New York: Springer.
Bityutskii, N. P., Magnitskiy, S. V., Korobeynikova, L. P., Lukina, E. I., Soloviova, A. N., Patsevitch, V. G., Lapshina, I. N. & Matveeva, G. V. (2002). Distribution of iron, manganese, and zinc in mature grain and their mobilization during germination and early seedling develop-ment in maize. Journal of Plant Nutrition, 25(3), pp. 635-653.
Börling, K. (ed.) (2017). Riktlinjer för gödsling och kalkning 2018. (Jordbruksinformation, 2017:4). Jönköping: Jordbruksverket [in Swedish].
Ekre, E. (2000). Manganbetning i stråsäd. Försök i animaliebältet 1998-2000. Meddelande från
södra jordbruksförsöksdistriktet (51). Växtodlings- och växtskyddsdagar, Växjö 6-7 december
2000. Sveriges lantbruksuniversitet, pp. 35:1-35:6. [in Swedish].
Eriksson, J. (2018). Mark- och grödoinventeringen. Available:
https://www.slu.se/institutioner/mark-miljo/miljoanalys/akermarksinventeringen/undersokningar/mark-grodoinventeringen/ [2018-11-19] [in Swedish].
Eriksson, J., Dahlin, S., Nilsson, I. & Simonsson, M. (2011). Marklära. Lund: Studentlitteratur [in Swedish].
Eriksson, J., Mattsson, L., Söderström, M. (2010). Tillståndet i svensk åkermark och gröda, data från
2007 [Current status of Swedish arable soils and cereal crops, data from the period 2001-2007] (Rapport 6349). Stockholm: Naturvårdsverket [in Swedish].
Farahani, H. A., Moaveni, P. & Maroufi, K. (2011). Effect of seed size on seedling production in wheat (Triticum aestivum L.). Advances in Environmental Biology, 5(7), pp. 1711-1715. Farooq, M., Wahid, A. & Siddique, K. H. M. (2012). Micronutrient application through seed
treat-ments: A review. Journal of Soil Science and Plant Nutrition, 12(1), pp. 125-142.
Graham, R., Senadhira, D., Beebe, S., Iglesias, C. & Monasterio, I. (1999). Breeding for micronutri-ent density in edible portions of staple food crops: Convmicronutri-entional approaches. Field Crops
Re-search, (60), pp. 57-80.
Halmer, P. (2008). Seed technology and seed enhancement. Acta Horticulturae, (771), pp. 17-26. Hamnér, K., Kirchmann, H. & Eriksson, J. (2012). Mikronäringsämnen i svensk spannmål. halter,
mängder och flöden för höstvete, vårkorn och havre (Rapport 9). Uppsala: Institutionen för mark
och miljö, Sveriges lantbruksuniversitet [in Swedish].
Hussain, A., Larsson, H., Kuktaite, R. & Johansson, E. (2010). Mineral composition of organically grown wheat genotypes: Contribution to daily minerals intake. International Journal of
Environ-mental Research and Public Health, (7), pp. 3442-3456.
Jâkobsone, I., Kantâne, I., Zute, S., Jansone, I. & Bartkeviès, V. (2015). Macro-elements and trace elements in cereal grains cultivated in Latvia. Proceedings of the latvian academy of science, 69(4), pp. 152–157.
Jensen, T. (2012). Wheat grain nutrient content. Soils and Crops Proceedings – 2012. Saskatoon: University of Saskatchewan.
Khabaz‐Saberi, H., Graham, R. D., Ascher, J. S. & Rathjen, A. J. (2000). Quantification of the con-founding effect of seed manganese content in screening for manganese efficiency in durum wheat (Triticum turgidum L. var. durum). Journal of Plant Nutrition, 23(7), pp. 855-866. Kirchmann, H., Mattsson, L. & Eriksson, J. (2009). Trace element concentration in wheat grain:
Re-sults from the Swedish long-term soil fertility experiments and national monitoring program.
En-vironmental Geochemistry and Health, (31), pp. 561-571.
Longnecker, N., Marcar, N. & Graham, R. (1991). Increased manganese content of barley seeds can increase grain yield in manganese-deficient conditions. Australian Journal of Agricultural
Re-search, (42), pp. 1065-1074.
Longnecker, N., Uren, C. (1990). Factors influencing variability in manganese content of seeds, with emphasis on barley (Hordeum vulgare) and white lupins (Lupinus albus). Australian Journal of