Department of Aquatic Resources
Trapping efficiency and retention ability of
four pontoon trap entrance types for use in
coastal cod fishing, a fishing gear
development field trial in the Baltic sea
Nils Nyquist
Trapping efficiency and retention ability of four pontoon trap
entrance types for use in coastal cod fishing, a fishing gear
development field trial in the Baltic sea
Author: Nils Nyquist, Swedish University of Agricultural Sciences, Department of Aquatic Resources, gusnyquni@student.gu.se
Supervisor: Peter Ljungberg, Swedish University of Agricultural Sciences, Department of Aquatic Resources
Assistant supervisor: Kristin Öhman, Swedish University of Agricultural Sciences, Department of Aquatic Resources
Examiner: Andreas Bryhn, Swedish University of Agricultural Sciences, Department of Aquatic Resources
Credits: 15 hp
Level: Basic level (G2E)
Course title: Independent project in biology
Course code: EX0894
Programme/education: Marine sciences, Bachelor’s programme (at University of Gothenburg) Course coordinating department: Department of Aquatic Resources
Place of publication: Uppsala Year of publication: 2019 Cover picture: Nils Nyquist
Online publication: https://pub.epsilon.slu.se
Bibliografic reference: Nyquist, N. (2019). Trapping efficiency and retention ability of four pontoon trap entrance types for use in coastal cod fishing, a fishing gear development field trial in the Baltic sea. Uppsala: Sveriges lantbruksuniversitet.
Keywords: Cod, pontoon trap, entrance type, coastal fisheries, video analysis, BORIS
As the Baltic Sea cod gets smaller both in number and size, and the grey seal popu-lation continues to increase, the need for alternative fishing methods in coastal fish-eries increases. In this project one commercially used and three experimental pontoon trap entrances are tested with the objective to investigate if there are differences in trapping efficiency and retention ability when fishing for cod. The four entrance types were installed in fish pots together with video cameras and lights. From the recorded video material the number of Enter, Exit, Approach and Turn events were logged and used to calculate trapping efficiency (Enter/Approach ratio) and retention ability (Exit/Enter ratio). There was a statistically significant difference trapping efficiency between Narrow-Short and Narrow-Long, both indicating that Narrow has a lower trapping efficiency. Due to limitations in analyses of the recorded observations, clear conclusions may not be drawn from the study's results. There is a need for further research focusing on entrance types for pontoon traps in order to develop seal safe gear with increased catch efficiency.
Keywords: Cod, pontoon trap, entrance type, coastal fisheries, video analysis, BORIS
1 Introduction 1
1.1 Background 1
1.2 Objective 2
2 Materials and methods 3
2.1 Materials 3 2.2 Field work 5 2.3 Data processing 5 2.4 Data analysis 6 3 Result 7 3.1 Entrance activity 7 3.2 Statistical analysis 9 4 Discussion 12 5 Conclusion 15 References 16 Acknowledgements 18 Appendix 1 19 Appendix 2 20
Table of contents
1
Introduction
1.1 Background
Fishing has for centuries been the primary source of income and sustenance for many coastal communities of the Baltic sea. One of the most important species is the Atlantic Cod (Gadus morhua). Increasing discharge of nutrients from expanding industry and agriculture during the last century resulted in a rapid increase in the Baltic cod stock. This led to an expansion of fisheries and increased fishing pressure in the Baltic during the 70s and 80s. The growing fleet of trawlers in conjunction with eutrophication and hydrographic variability caused a catastrophic decline in the Baltic cod stocks in the 90s (Mackenzie et al., 2011).
In order to decrease the ecological effects of trawling the fishing industry put up regulations that required cod trawls to have selective panels installed. The intention was to make sure that only cod above a certain size were captured. The change gen-erated another unexpected problem which proved to be devastating for the Baltic cod. When the larger individuals got caught in trawls the individuals that got fertile at a smaller size had increasing opportunity to reproduce which in combination with high fishing pressure led to smaller average size (Andersen et al., 2007). The change in size distribution may also have got skewed in a manner that increased intraspe-cific competition for food (Pachur & Horbowy, 2013).
Over the last 20 years the grey seal (Halichoerus grypus) population has increased rapidly in the Baltic Sea (Kauhala et al., 2015). Together with the stresses described above, this has caused additional trouble for both the cod population and the fisher-men (Lunneryd et al., 2005). Seals are spreading parasites which can be harmful for cod and may be contributing to poorer health (Mehrdana et al., 2014; Horbowy et al., 2016). Seals are also known to take fish from gillnets and hooks, which causes
increasing damage to equipment and catch as the density of seals increases (Kö-nigson et al., 2009). As a response research is being conducted to develop seal safe fishing gear for coastal fisheries, primarily pots and traps. Some progress has been made regarding design, size and bait of these types of gear. In coastal salmon fishing pontoon traps have been successful (Hemmingsson et al., 2008) and are currently tested for coastal cod fishing with promising results (Sälar och Fiske, 2015). In order to change the coastal fishing methods from gillnets and hooks to traps, they need to be more efficient and reliable. One component which has not been thoroughly ex-amined is the trapping efficiency of different types of entrances. Research has been conducted with focus on baited fish pots aimed at catching cod (Ljungberg et al., 2016) but no research is focusing on entrance types for pontoon traps. Cod pontoon trap design is based on pontoon traps used in salmon fishing. Due to differences between salmon and cod (e.g. anatomy and behaviour) the entrances used in salmon traps might both make it harder for cod to enter the trap and make it easier for cod to escape through the entrance. Therefore, further research might be profitable for coastal fisheries.
1.2 Objective
In this project one commercially used (in salmon traps) and three experimental pon-toon trap entrances were tested with the objective to investigate if there are differ-ences in trapping efficiency and retention ability and if any entrance type is more efficient than the others when fishing for cod.
2.1 Materials
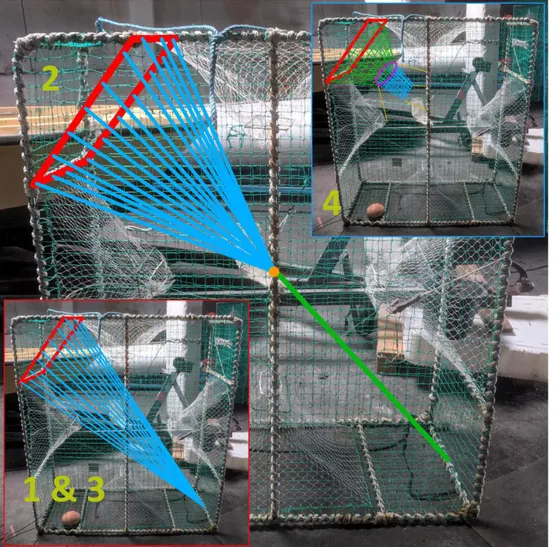
The pontoon trap entrance types were installed in fish pots instead of pontoon traps to lower cost and time requirement for this project. To prevent fish from exiting the trap through the entrance, funnel threads are connected from the end of the trap to the entrance frame, with the standard length of 2 m. To be able to compare different entrance types, fish pots of the size 170x150x60 cm were used. The netting around the pots was made of green polyethylene and had a mesh size of 40 mm (between knots). In order to make the entrances fit inside the pots they needed to be positioned diagonally (Figure 1). Three of the four original entrances in each pot were closed (not closed in Figure 1), the last one was made resealable for emptying the pot and making the gear switch easier. The entrance types tested in this experiment were:
1. Long: Standard pontoon trap entrance with square aluminium frame (45x45 cm) and funnel threads (2 m length) attached at 8 cm spacing around the frame (Red border, Figure 1),
2. Short: as standard but with 1 m long funnel threads (Figure 1),
3. Narrow: as standard but with 4 cm thread spacing around the frame (Red
border, Figure 1),
4. Funnel: an entrance type commonly used in cod pots (Blue border, Figure 1).
Figure 1: Schematic drawings of the different entrance types. Main: Short entrance (2, Short), funnel threads (light blue) with 8 cm line spacing around frame (red), connected to a plastic ring (yellow dot) at 1 m diagonal length. Red border: Standard entrance with funnel threads (light blue) connected to the entrance frame with 8 cm (1, Long) and 4 cm (3, Narrow) line spacing . Blue border: Traditional fish pot entrance (4, Funnel) with a circular metal ring of 20 cm diameter (purple ring), connected to a 20 cm long fine meshed (16 mm) monofilament funnel (light blue). It is attached to the pot with the same type of aluminium frame as the other tested entrances (red), with 35 cm of 22 mm meshed net funnel (green) between frame and ring.
To monitor events around the entrance a digital camera system was used. One Mo-bius action camera with a 128-200 GB memory card and an external battery (20 Ah) was placed in a waterproof stainless steel case with Lexan front panel, which was then attached to the pots by a plywood frame so that the camera would have the best view of the entrance. The camera was set to record video at wide angle WVGA resolution at five frames per second. A 10 W light source emitting green light was used to attract cod to the pots, the method described by Bryhn et al. (2014). The
light source was connected to 20 Ah batteries placed in a waterproof canister. The last six sets of pots were also baited with chopped herring (Clupea harengus), la-belled in Appendix 1 as Bio-bait.
2.2 Field work
In collaboration with a local fisherman the experiment was carried out in the coastal waters around Ystad, Skåne, Sweden. The first pots were set on April 29, 2019 and the last pots were hauled on May 31, 2019. The configurations of treatments were planned so that two different pots were active at one time and one pot was active twice before the equipment was moved to another pot. Up to setting number six (extracted May 24) the selection of the new pot was randomized using the ‘RAND()’-function in Excel, the last two settings were selected because of an inad-equate amount of recorded video observations of Narrow and Funnel. The pots were set at 21-35 m depth with a soak time of two to seven days with film data ranging from 51 hours and 35 minutes to 76 hours and 6 minutes in duration.
2.3 Data processing
The video material was loaded onto external hard drives and imported into the be-havioural analysis program BORIS (Bebe-havioural Observation Research Interactive
Software, Friard & Gamba 2016). Events can be either ‘State’-events (event with
duration) or ‘Point’-events (momentary events) which is specified for each event in parentheses in the list below. The analysis was structured around the following events:
1. FISH (State): fish is present (in camera frame), 2. APPROACH (Point): fish examines the entrance,
3. TURN (Point): fish swims away from pot after inspecting the entrance, 4. ENTER (Point): fish entering the pot, through entrance or other as specified, 5. EXIT (Point): fish exiting the pot, through entrance or other as specified
Duration of night was also logged (State), as well as the point when the light went out (Point). In the comments of each enter/exit event point of enter/exit and size of fish was specified and later compiled in Microsoft Office 365 Excel so that param-eters could be used in calculations and statistics. The sizes were logged as ‘Small’ (small enough to enter the pot through the netting without difficulty), ‘Big’ (too big
to be able to enter the pot through the netting) and ‘Decent’ (cod that may have trouble getting through but are able to get through the netting). These classifications are visual, without any clear reference other than the entrance and mesh size of the netting. In order to make the low number of observations more useful in statistical analysis they were divided into 24-hour parts (labelled ‘Day’ in Appendix 1). If the last part of an observation was shorter than 22 hours and 30 minutes, it was not used in the statistical analysis. Days with errors during ratio calculation (#DIV/0!) or without events were not included (Appendix 1 & Appendix 2). Therefore no data of the Funnel entrance was used in statistical analysis.
2.4 Data analysis
Each analysed observation was exported from BORIS in the form of Excel spread-sheets. The events were then divided into days (24 h) and ordered in pivot tables. From pivot tables the sum of Enter, Exit, Approach and Turn per 24-hour period and entrance type was extracted and compiled in a separate table (Appendix 1). Catch efficiency of pontoon trap entrances can be divided into Trapping efficiency (Enter/Approach ratio) and Retention ability (Exit/Enter ratio). Exit/Enter and En-ter/Approach ratios were calculated to determine ability of the entrance to keep the fish inside the pot after entering (retention ability) and the luring capability or ac-cessibility for the fish to enter (trapping efficiency) respectively.
To determine statistical distribution a Kolmogorov-Smirnov test (KS-test) was used. Confidence level and corresponding intervals presented in this report are 95% and aside from consultation with supervisors, the book Choosing and Using Statistics,
A Biologists Guide by C. Dytham (2011) was used to choose statistical tests in R (R
3.1 Entrance activity
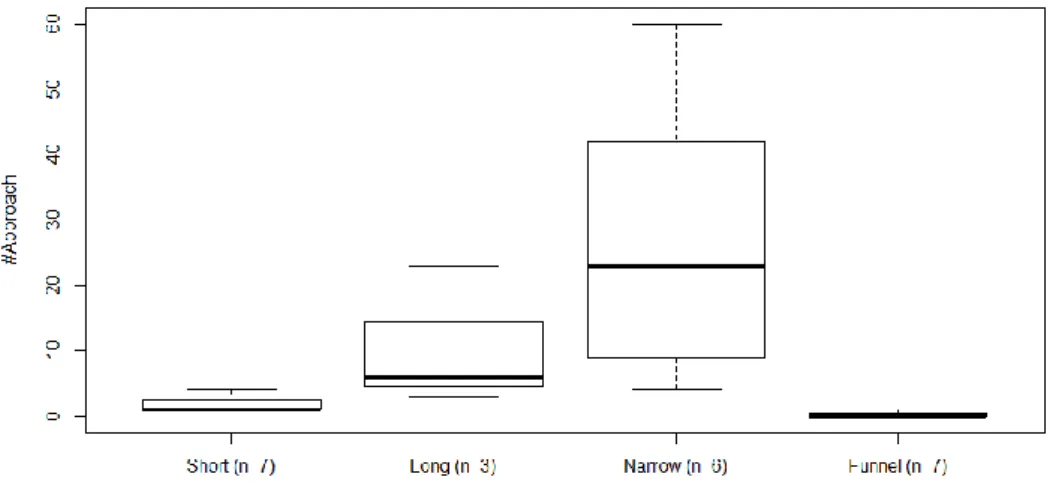
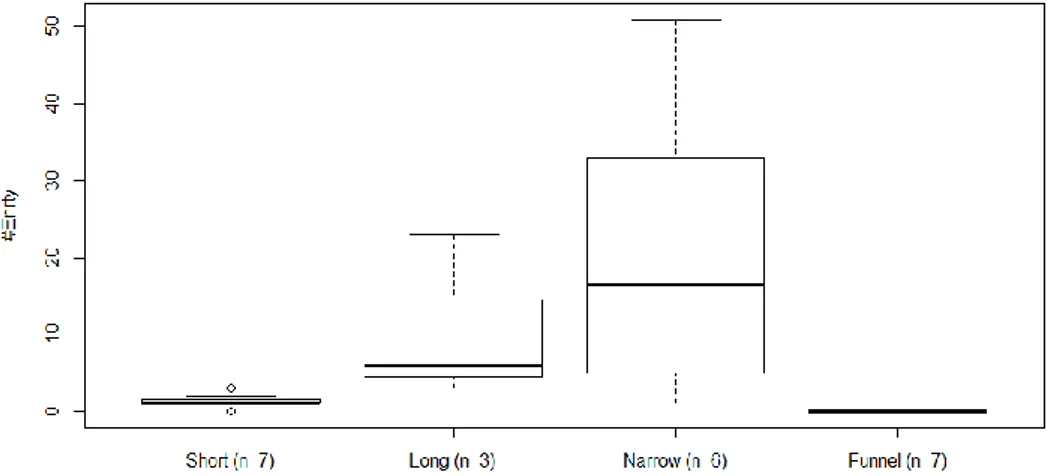
For all logged events the Narrow entrance had the highest activity (Figures 2-5 & Appendix 1). Although Narrow had a higher number of entries (Figure 4), it also had a higher number of exits (Figure 5) and turns (Figure 3). The Funnel entrance had no enter or exit but two of the days had one approach and one turn. All the cod that managed to enter the pots did also exit them through the entrance or the netting. Most of the individuals were of a size that made it possible for them to pass through the netting, which explains the uneven number of enter and exit events (Appendix 1).
Figure 2: Boxplot of the number of approaches (#Approach) for each entrance type, n in parenthesis is the total number of recorded days, including days not used in statistical analysis (Appendix 1).
Figure 3: Boxplot of the number of turns (#Turn) for each entrance type, n in parenthesis is the total number of recorded days, including days not used in statistical analysis (Appendix 1).
Figure 4: Boxplot of the number of entries (#Entry) for each entrance type, n in parenthesis is the to-tal number of recorded days, including days not used in statistical analysis (Appendix 1).
Figure 5: Boxplot of the number of exits (#Exit) for each entrance type, n in parenthesis is the total number of recorded days, including days not used in statistical analysis (Appendix 1).
The pair of pots were set into the water with active camera equipped at eight differ-ent occasions, resulting in fourteen usable observations. Two observations turned out to be unusable due to technical error (no film recorded). After completed anal-ysis of the first two observations, it was clear that the time required to analyse all observations would exceed the time available within the project. Therefore, a non-randomized selection of five additional observations was made with a spread re-garding type of entrance and date of setting. Thus, seven of the fourteen available observations were used during data analysis (Appendix 1).
3.2 Statistical analysis
The results from the KS-test shows that the output data from Exit/Enter ratio and Enter/Approach ratio may be normally distributed (p=0.187 and p=0.158 respec-tively). Parametric statistical tests were therefore used (one-way ANOVA, Table 2, and Tukey’s honestly significant difference (HSD) test, Table 3).
Exit/Enter ratio depicts the number of cod that exited the pot through the entrance (Exit) divided by those that entered the pot through the entrance (Enter). An Exit/En-ter ratio between zero and one indicates that more cod enExit/En-tered than exited the pot and that a value closer to zero indicates a better catch efficiency. In theory this means that there should not be any values higher than one but the uneven number
of enter and exit events caused by entry through the netting makes some ratios larger than one. The mean Exit/Enter ratio for the Short entrance turned out to be larger than one while Long and Narrow had a mean slightly below one (Table 1).
Enter/Approach depicts the ratio of approaching cod that entered the pot through the entrance, effectively describing the ratio of cod that approached the entrance and then turned. An Enter/Approach ratio close to one show that close to all approaching fish entered, a ratio close to zero show that almost every fish turned. Of all the sam-ples used in statistical analysis only Narrow had logged turn events. This explains the mean Enter/Approach ratio of 0.6 (Table 1).
Table 1: Results and descriptive statistics of ratio calculations. Day identifies which 24-hour piece of an observation the data is taken from. The used observations and days are displayed in Appendix 1 and Appendix 2.
Entrance Day Exit/Enter Enter/Approach Short 2 3.00 1.00 3 1.00 1.00 1 1.00 1.00 2 0.667 1.00 Mean 1.42 1.00 SD 1.07 0.00
Entrance Day Exit/Enter Enter/Approach Long 1 0.870 1.00 2 0.667 1.00 3 1.33 1.00 Mean 0.96 1.00 SD 0.34 0.00
Entrance Day Exit/Enter Enter/Approach Narrow 1 1.50 0.667 2 1.02 0.850 1 1.00 0.250 2 0.800 0.417 3 0.630 0.794 Mean 0.990 0.598 SD 0.327 0.256
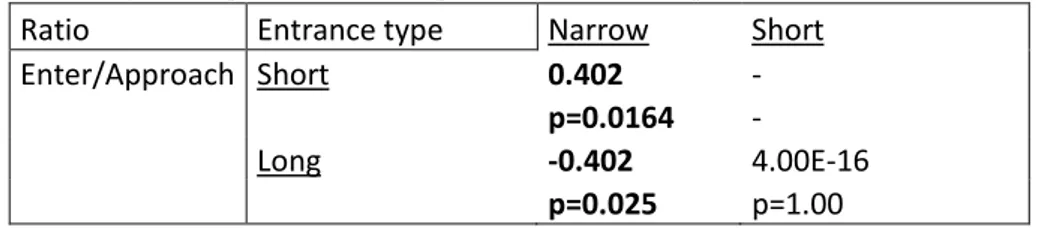
The ANOVA tests indicated a significant difference between entrance types in En-ter/Approach ratio (Table 2). Since no significant difference was noted in Exit/Enter ratio no post hoc-test (in this case Tukey’s HSD test) was performed for Exit/Enter
ratio. While comparing ratios between the different entrance types a significant dif-ference was found between Narrow-Short and Narrow-Long (Table 3). The differ-ence shown in Table 1 indicates that Long and Short entrances are better at getting cod into the pots through the entrance than Narrow.
Table 2: Results of one-way ANOVA. Significant p-values are displayed as bold.
ANOVA Exit/Enter Enter/Approach
d.f. 2 2
F-value 0.573 8.09 p-value p=0.583 p=0.00977
Table 3: Tukey’s honestly significant differences test with test statistic (difference, upper) and p-value (lower). Significant p-values and corresponding statistic are displayed as bold.
Ratio Entrance type Narrow Short Enter/Approach Short 0.402 -
p=0.0164 -
Long -0.402 4.00E-16
The overall objective of this study was to investigate if any entrance type was more efficient than the others when comparing different types of commercially used and experimental pontoon trap entrances. Furthermore, there was focus on the two dif-ferent aspects of trapping efficiency and retention ability. Although the result does not show that one entrance overall has the highest efficiency the result contributes to new knowledge in the aspect of trapping efficiency where significant differences were found between the entrance types Narrow-Short and Narrow-Long. The dif-ferences indicate that Long and Short entrances are more efficient in getting ap-proaching cod into the pots through the entrance than Narrow. However, the enter data for Short was very limited and therefore the results may speak more in favour of Long in this aspect. Even though Narrow seemed to be the entrance type not preferred regarding trapping efficiency the result in this study at the same time shows that it rendered most activity in total of all the entrance types. Notable was also that the entrance type Funnel on the contrary had very low activity and no enter or exit events at all, despite having one pot with set at the same time as one pot with
Narrow entrance.
The study by Ljungberg et al. (2016) handles a similar experiment design as this study, though focusing specifically on entrance types for cod pots. They conclude that entrance types with a higher turn rate (lower trapping efficiency) also have a higher retention ability. It may be different in this study as it is focusing on a differ-ent type of fishing gear, but cod may behave similarly regarding the differ-entrance types. More data and ability to calculate catch per unit effort (CPUE) and weight per unit effort (WPUE) are needed to make a valid comparison. Since no data from the
Fun-nel entrance could be used in this trial, no conclusion can be made about neither
trapping efficiency nor retention ability other than that more tests need to be done. Without a significant difference in Exit/Enter ratio between the entrances it is not possible to determine which entrance is the most effective.
The main strengths of the study are the results of trapping efficiency described above. Another important contribution is that the study itself addresses the need for increased knowledge about the connection between cod's natural behaviour, catch efficiency and gear development. On one hand, the extensive data collection can be seen as a strength in the study as it likely is required in field trials where uncontrol-lable conditions may vary greatly from day to day. On the other hand, it was found that the amount of data collected in this trial was too extensive to be managed within the framework of the project. That is why only seven of fourteen observations were analysed. The fact that analysis of recorded film was so time consuming could have been foreseen and the plan should have been adjusted. It could have been done by searching for software that can capture increased activity on video footage, although there are constantly moving elements in picture due to activity of currents and other organisms. The adjustment could otherwise have been made by reducing the number of filmed observations to get more time for video analysis, and perhaps also reduc-ing the number of examined types of entrances.
The selection of already collected data described above was necessary because of time restrictions, though it weakened the descriptive statistics and the statistical analysis of the study, especially as the selection was made without randomization procedures. Additionally, the cod activity in and around the pots was in general un-expectedly low which affected the amount of events in each observation. Beside the characteristics of the equipment uncontrollable conditions such as currents and weather can be expected to have affected the activity. During the field trial there were other cod pot trials carried out in the same area and even in their case the activity turned out to be lower than expected. In the future it may therefore be wise to conduct further field studies during a period when cod catch in the area is pre-dicted to be higher. As the observations in the statistical analysis were divided into 24-hour parts it was after all considered that sufficient data was available to go through with statistical analyses with the exception of Funnel.
To be able to discuss catch efficiency in general on the basis of the results, data regarding CPUE and WPUE are needed. Every cod that entered the pots in this study also escaped through the netting or through the entrance. Inadequate pot design and/or a notable proportion of the cods under minimum allowed catch size could explain why no cod was hauled up. Other studies have used the corresponding mesh size (40-45 mm) with good results on catch efficiency (Ovegård et al., 2011; Ljung-berg et al., 2016), although in these cases selection panels that covered a small part of the pot was used, while the rest of the pot had a smaller mesh size. It may be reasonable to assume that the stretch ability of the material increases when the entire pot has a mesh size of 40 mm. In that case, this could have been a contributing factor
to why no fish was hauled up during the field trial. The missing data on CPUE and WPUE limits the results, however only to some extent as the focus in this study lies on trapping efficiency and retention ability rather than the catch efficiency in gen-eral.
There are several implications for further studies and development focusing on en-trance types for pontoon traps in order to develop seal safe gear with increased catch efficiency. To continue analysing all observations recorded in this study would con-tribute to confirm, dispute or complement the present results. If there is no software to be found that can detect activity in recorded under water footage, development of such software would be preferred. Another developmental step in a new field trial could be to change the design of the pot so that no cod of allowed catch size could enter and exit through the netting. A more ambitious trial could be to install different entrance types in full scale pontoon traps with camera equipment installed by the entrance. Then it would be possible to investigate which factor has the greatest ef-fect on catch efficiency of the trap: turning behaviour or ability to escape the trap once inside. It seems to be crucial and challenging to find an entrance type that can provide an overall high catch efficiency with high trapping efficiency as well as high retention ability.
Due to limitations in analyses of the recorded observations, clear conclusions may not be drawn from the study's results. Despite this, the results showed that there were significant differences in trapping efficiency between the entrance types
Nar-row-Short and Narrow-Long where Narrow seemed to be less efficient in getting
approaching cod into the pots through the entrance than Short or Long. As the result of a closely related study concluded that entrance types with lower trapping effi-ciency also had a higher retention ability it seems to be a challenge to find an en-trance type that can provide an overall high catch efficiency. There is a need for further research focusing on entrance types for pontoon traps in order to develop seal safe gear with increased catch efficiency.
Andersen, K.H., Farnsworth, K.D., Thygesen, U.H. & Beyer, J.E. (2007). The evo-lutionary pressure from fishing on size at maturation of Baltic cod. Ecological
Mod-elling, 204(1), 246-252.
Bryhn, A., Königson, S., Lunneryd, S-G. & Bergenius, M. (2014). Green lamps as visual stimuli affect the catch efficiency of floating cod (Gadus morhua) pots in the Baltic Sea. Fisheries Research, 157(C), 187-192.
Dytham, C. (2011). Choosing and Using Statistics: A Biologists Guide (3. Ed.). West Sussex: John Whiley & Sons Ltd.
Friard, O. & Gamba, M. (2016). BORIS: a free, versatile open-source event-logging software for video/audio coding and live observations. Methods Ecol Evol, 7: 1325– 1330.
Hemmingsson, M., Fjälling, A. & Lunneryd, S-G. (2008). The pontoon trap: De-scription and function of a seal-safe trap-net. Fisheries Research, 93, 357-359.
Horbowy, J., Podolska, M. & Nadolna-Ałtyn, K. (2016). Increasing occurrence of anisakid nematodes in the liver of cod (Gadus morhua) from the Baltic Sea: Does infection affect the condition and mortality of fish? Fisheries Research, 179, 98-103.
Kauhala, K., Kurkilahti, M., Ahola, M.P., Herrero, A.; Karlsson, O., Kunnasranta, M., Tiilikainen, R. and Vetemaa, M. (2015). Age, sex and body condition of Baltic grey seals: are problem seals a random sample of the population? Annales Zoologici
Fennici, Vol. 52, pp. 103-114.
Königson, S., Lunneryd, S., Stridh, H., & Sundqvist, F. (2009). Grey Seal Predation in Cod Gillnet Fisheries in the Central Baltic Sea. Journal of Northwest Atlantic
Fishery Science, 42, 41-47.
Ljungberg, P., Lunneryd, S-G., Lövgren, J., Königson, S. (2016). Including cod (Gadus morhua) behavioural analysis to evaluate entrance type dependent pot catch in the Baltic sea. Journal of Ocean Technology. 2016, Vol. 11 Issue 4, 48-63.
Lunneryd, S-G., Hemmingsson, M., Tärnlund, S. & Fjälling, A. (2005). A voluntary logbook scheme as a method of monitoring the bycatch of seals in Swedish coastal fisheries. ICES CM, X:04.
Mackenzie, B.R., Ojaveer, H. & Eero, M. (2011). Historical ecology provides new insights for ecosystem management: Eastern Baltic cod case study. Marine Policy,
35(2), 266-270.
Mehrdana, F., Bahlool, Q., Skov, J., Marana, M., Sindberg, D., Mundeling, M., … Buchmann, K. (2014). Occurrence of zoonotic nematodes Pseudoterranova decipi-ens, Contracaecum osculatum and Anisakis simplex in cod (Gadus morhua) from the Baltic Sea. Veterinary Parasitology, 205(3-4), 581-587.
Ovegård, M., Königson, S., Persson, A. & Lunneryd, S-G. (2011). Size selective capture of Atlantic cod ( Gadus morhua) in floating pots. Fisheries Research,
107(1-3), 239-244.
Pachur, M., & Horbowy, J. (2013). Food composition and prey selection of cod, Gadus Morhua (Actinopterygii: Gadiformes: Gadidae), in the Southern Baltic. Acta
Ichthyologica Et Piscatoria, 43(2), 109-118.
R Core Team (2018). R: A language and environment for statistical computing. R Foundation for Statistical Computing, Vienna, Austria. Downloaded 2019-07-10 from: https://www.R-project.org/.
Sälar och Fiske. (2016). Verksamhetsberättelse 2015. Downloaded 2019-05-22 from: http://www.salarochfiske.se/down- load/18.7ede41a5169673587eccbc70/1552851153007/verksamhetsberattelse-2015.pdf
I would like to thank my supervisors Peter Ljungberg and Kristin Öhman for their guidance and incredible patience and fisherman Bengt Andersson for making this project possible, even though the cod pots were too big for his boat. Likewise, I would like to thank Sebastian Wolsing, Cecilia Lagging and Olov Wahlsten for the invaluable consultation regarding the statistical analyses. For the guidance of the report writing process and structuring I thank Anita Nyquist. Lastly I would like to thank Barbara Bland for getting me in contact with Peter.
Raw data
Appendix 1
Entrance Day Occation Date (pick-up) Enter Exit Approach Turn Bio-bait Exit/Enter Enter/Approach Used in statistical analysis
Short 1 1 03/05/2019 0 0 4 4 no #DIV/0! 0 no Short 2 1 03/05/2019 1 3 1 0 no 3 1 yes Short 3 1 03/05/2019 2 2 2 0 no 1 1 yes Short 4 1 03/05/2019 1 0 1 0 no 0 1 no Short 1 2 12/05/2019 1 1 1 0 no 1 1 yes Short 2 2 12/05/2019 3 2 3 0 no 0.666666667 1 yes Short 3 2 12/05/2019 1 0 1 0 no 0 1 no Long 1 1 03/05/2019 23 20 23 0 no 0.869565217 1 yes Long 2 1 03/05/2019 6 4 6 0 no 0.666666667 1 yes Long 3 1 03/05/2019 3 4 3 0 no 1.333333333 1 yes Narrow 1 1 15/05/2019 6 9 9 5 no 1.5 0.666666667 yes Narrow 2 1 15/05/2019 51 52 60 9 no 1.019607843 0.85 yes Narrow 3 1 15/05/2019 33 20 42 8 no 0.606060606 0.785714286 no
Narrow 1 2 28/05/2019 1 1 4 3 yes 1 0.25 yes
Narrow 2 2 28/05/2019 5 4 12 6 yes 0.8 0.416666667 yes
Narrow 3 2 28/05/2019 27 17 34 6 yes 0.62962963 0.794117647 yes
Funnel 1 1 24/05/2019 0 0 0 0 yes #DIV/0! #DIV/0! no
Funnel 2 1 24/05/2019 0 0 1 1 yes #DIV/0! 0 no
Funnel 3 1 24/05/2019 0 0 0 0 yes #DIV/0! #DIV/0! no
Funnel 1 2 28/05/2019 0 0 1 1 yes #DIV/0! 0 no
Funnel 2 2 28/05/2019 0 0 0 0 yes #DIV/0! #DIV/0! no
Funnel 3 2 28/05/2019 0 0 0 0 yes #DIV/0! #DIV/0! no
Data used in statistical analysis