Southern Swedish Forest Research Centre
Phenotypic differences between plus-tree
progenies of Sitka spruce (Picea sitchensis)
and a comparison with Norway spruce
(Picea abies)
Teresa López-Andújar Fustel
Master thesis • 30 credits
EUROFORESTERMaster Thesis no. 319 Alnarp 2019
Phenotypic differences between plus-tree progenies of Sitka
spruce (Picea sitchensis) and a comparison with Norway spruce
(Picea abies)
Teresa López-Andújar Fustel
Supervisor: Emma Holmström, SLU, Southern Swedish Forest Research Centre Assistant supervisor: Mateusz Liziniewicz, Skogforsk
Examiner: Johanna Witzell, SLU, Southern Swedish Forest Research Centre
Credits: 30 credits
Level: Advanced level A2E
Course title: Master thesis in Forest Science
Course code: EX0838
Programme/education: Euroforester Master Program SM001 Course coordinating department: Southern Swedish Forest Research Centre
Place of publication: Alnarp
Year of publication: 2019
Online publication: https://stud.epsilon.slu.se
Keywords: Picea sitchensis, growth, heritability, phenotypic and genetic correlations
Swedish University of Agricultural Sciences Faculty of Forest Sciences
3 Abstract
Forest productivity and economic gains are two of the most important aspects to consider when managing forests these days. The performance of these depends on rotation periods and yields providing new opportunities to maximize earnings from the forest site and plant material. The selection of new species to plant in production forests is an option to address future climate changes. The use of other species, than Norway spruce (Picea abies) and Scots pine (Pinus sylvestris), like Sitka spruce (Picea sitchensis (Bong.) Carr.) in an enabling environment can increase the overall
production in the forest.
The climatic conditions on the Western coast of Sweden are expected to be milder and warmer opening the opportunity to the use of Sitka spruce in the future. In favourable conditions in Southern Sweden, Norway spruce is able to produce around 8-10 m3*ha -1*yr-1 whereas Sitka spruce in this field trial produced 16 m3*ha-1*yr-1. The increased
use of improved plant material from different sources makes this difference even larger.
This study used a field trial established by Skogforsk within a Sitka spruce breeding program. The identification and grouping of the best Sitka spruce plus-trees based on their progenies growth was done based on initial heights measurements at the age of 2 and 6. The estimations of heritability values showed low values between 14-17% for height (age 6), dbh (age 13) and wood density (age 22). Quality traits as forking, spike knots, branch diameter and wood density scores were assessed for the previous progeny groups, however, good quality traits were not linked to any specific progeny group. Most importantly, no assessed quality traits at year 22, contradicts the early selection by height at year 6. Wood density scores followed a decreasing trend with larger dbh growths, however, it was possible to select for plus-trees with large
diameters and high density scores. Norway spruce trees, also present in the field trial, in comparison to Sitka spruce developed thinner branch diameters at breast height and higher values of wood density. Even so, Sitka spruce can be considered as a possible alternative to Norway spruce and Scots pine on the Western coast of Sweden for wood production.
4 Acknowledgements
I would like to express my sincere appreciation to my supervisors Emma Holmström and Mateusz Liziniewicz for all their support and guidance through the thesis. As well to Partnerskap Alnarp for making this Master thesis possible thanks to its funding. Thank you very much to all the people involved in the Euroforester program. It has been an awesome experience to study in one of the most exiting forestry programs in the world.
I warmly thank my family, specially my parents, for making my studies happen and for giving me love and unconditional support in every moment.
I want to mention three special persons that made my life lovely in my day to day during my studies in Sweden, Ann-Kristin, TK & Jöns-Petter. Tack så mycket!
5
Table of contents
Abstract ... 3 Acknowledgements ... 4 1. Introduction ... 7 1.1 Background ... 7 1.2 Sitka spruce ... 81.3 Growth vs quality selection ... 11
1.4 Breeding programs ... 12
1.5 This study ... 14
2. Materials and methods ... 15
2.1 Location ... 15
2.2 Inventories ... 16
2.3 Data management ... 18
2.4 Analysis ... 20
3. Results ... 22
3.1 Height and dbh growth ... 22
3.2 Quality assessments ... 24
3.2.1 Forks ... 24
3.2.2 Spike knots ... 24
3.2.3 Branch diameter at breast height ... 24
3.2.4 Branch angle value at breast height ... 25
3.2.5 Density value ... 25
3.3 Heritability ... 26
3.4 Phenotypic and Genetic Correlation between traits ... 27
3.4.1 Branch diameter and breast height diameter ... 28
3.4.2 Pilodyn values and DBH ... 28
3.5 Production in the trial ... 29
4. Discussion ... 30
5. Conclusions and management implications ... 33
References ... 34
7
1. Introduction
1.1 Background
Introduction of fast growing exotic tree species and breeding programs are two common measures to increase growth and yield in forest plantations. Forest
productivity is especially important for forest companies and forest owners in Sweden. Economic gains are directly linked to rotation periods and yields. Unimproved local material provides by natural selection adapted trees to specific site conditions (Ingvarsson et al. 2017). However, improved plant material has gained importance in the vast majority of plantations (Ruotsalainen, 2014) being able to provide a yield increase ranging from 6 to 30% on average compared to local provenances (Mullin et al. 2011; Haapanen et al., 2015). The variation in yield depends on the type of
improvement of the plant material, for example, provenances from Eastern Europe planted in Sweden can provide between 6-10% of yield increase depending on the origin. Higher yields, 10-15% of increase, come from plus-tree selection in native breeding programs. From seed orchards yields of 10-25% are obtained and from clone’s yields of up to 35% are achieved (Rosvall et al., 2001). Apart from volume production, adaptation to environmental conditions and quality traits are important characteristics to look at in breeding programs. Survival as a consequence of better adaptations to new climatic conditions can be enhanced, just like growth and quality (Haapanen et al., 2015).
Breeding material is of huge economic importance. Better survival and higher growth can reduce the costs of production and management during the rotation period. Fewer seedlings are needed due to the increase in volume growth per tree and thus fewer trees are harvested on every forest operation saving time and money (Rosvall et al., 2006). Benefits associated to faster growths are shorter rotations which in turn represent an advantage to reduce risks over the rotation period such as wind throws, snow damages or butt rot (Pfister et al., 2007). It has been shown that forest stands coming from improved material reach the optimal harvest time faster. Improved plant material from seed orchards is a relatively cheap method to enhance growth
8
resistance can also be selected to be improved as well (Rosvall et al., 2006; Ruotsalainen, 2014; Haapanen et al., 2015).
Skogforsk, the Swedish Forestry Research Institute, is focused on the production of improved plant material through breeding programs. In Sweden plus-tree selection begun around the year 1930 (Lindgren et al. 2007). Since then, long term breeding programs have been developed for Norway spruce (Picea abies), Scots pine (Pinus sylvestris), Lodgepole pine (Pinus contorta) and Silver birch (Betula pendula). For other species like Sitka spruce it has been used to obtain improved planting material that could be used in practice. Short term initiatives are important to make these
programmes profitable in a short period of time from the start (Gullberg et al. 1985). Nowadays, the share of improved seedlings used in practical forestry in Sweden is about 70% and 90% for Norway spruce and Scots pine respectively (Haapanen et al., 2015). Similar production gains were observed for the same species in Finland and Norway. In the year 2014, 215 million of Norway spruce seedlings were used in
Sweden compared with only 2 million of Sitka spruce seedlings. The volume production differences between these species aren’t large in the south of Sweden. Norway spruce yield can be of approximately 10 m3*ha-1*year-1 whereas for Sitka spruce of 12 m3*ha -1*year-1 (Bergh et al., 2005). Rotation age could also be similar for both, 55 and 50
years for Norway spruce and Sitka spruce on fertile soils, respectively. However, the genetic gain and consequently the annual mean volume production from seed
orchards is considerably higher for Sitka spruce with a 40% increase compared to just a 12% for Norway spruce. Sitka spruce can produce 20-80% more volume than Norway spruce on good sites (Rosvall et al., 2001). Future projections for the year 2050 estimate the potential demand for seedling production of Norway spruce to remain stable. Conversely, Sitka spruce is expected to multiply by 2.5 its demand up to 5 million plants per year (Almqvist et al., 2010).
1.2 Sitka spruce
Sitka spruce (Picea sitchensis (Bong.) Carr.) is a native tree species along the western coast of North America. The distribution range goes from latitude 39°N to 61°N, from
9
north California to Alaska (figure 1) (OECD, 2006). Sitka spruce is restricted to maritime climate zones similar to the Swedish western coast (Lines, 1987). These climate zones are characterized for having average annual precipitations ranging from 1000 – 3000 mm per year and abundant moisture with frequent foggy rains throughout the year, especially during winter. Sitka spruce thrives on areas with mild winters, minimum temperatures above -7°C, cool summers without droughts (Moore, 2011; en.climate-data.org, 2017) and long periods without frosts. Sitka spruce can easily adapt to a broad range of soils with good drainage such as sandy soils but not to swamps (Lines, 1987).
Figure 1. Natural distribution of Sitka spruce along the Western coast of North America. Source:
Moore, 2011.
In Europe Sitka spruce was first introduced in Great Britain during the early 19th
century and the first plantations were made by the end of the same century (Samuel et al., 2007). In Sweden, Sitka spruce was introduced during the 20th century
10
production, aircraft frames, parts of instruments and pallets (OECD, 2006; San-Miguel-Ayanz et al., 2016). Nowadays, in Europe its wood can be targeted for saw timber, pulpwood and to a minor extent instruments.
The first progeny tests in Britain were performed in 1967 (Lee, 2001). Since then, the area of Sitka spruce has increased rapidly becoming one of the most important species in the country. In 2007, up to 49% of the forest area in Great Britain, approximately over 1.4 million hectares, was forested with Sitka spruce (Moore, 2011). Its presence has also increased in other European countries like Ireland, Island, France and Denmark (Mason et al., 2011). In Sweden, up to date the use of non-native tree species have been limited in the country including Sitka spruce. Lodgepole pine (Pinus contorta), as an exception in Sweden within foreign species, has been planted on a larger scale (approx. 550.000 hectares). Even so, Sitka spruce gained importance after the storms Gudrun (2005) and Per (2007) for many forest owners (Skogsstyrelsen, 2009). The choice of Sitka spruce for their plantations was based on the determination to try a different species than Norway spruce and also by good economic and forest growth prospects (Kristensen, 2011).
Felton et al. (2010) emphasizes the term ‘risk spreading’ when approaching climate change scenarios. Climate changes that are expected to occur in Sweden will most likely impact species management. The adaptability of species to climate change is uncertain and thus new forest regeneration material adapted to climatic conditions is needed. This situation opens the possibility to use new foreign species with better developments in these new climatic scenarios (Leech et al. 2011).
In Götaland, the two main production species are Norway spruce (Picea abies) and Scots pine (Pinus sylvestris) representing a 46% and a 30% of the total forest area respectively (Skogsdata, 2017). Species diversification can help to reduce the vulnerability of homogeneous forests to cope with new threats like drought or
outbreaks of pests (Eklund et al., 2015). In addition, the integration of new species i.e. Sitka spruce will allow shorter rotations in production forests and this may have a positive impact in the reduction of risks associated to wind throw and bark beetle outbreaks. Nevertheless, shorter rotations will as well involve a reduction of the
11
number of old trees present in the forest bringing negative consequences to biodiversity (Felton et al., 2016).
Potential risks for Sitka spruce plantations
Climate change is expected to affect forest productivity of spruce forests in Sweden and Europe by increasing temperatures and changing the patterns of rainfalls i.e. drier summers (Cameron, 2015; Eklund et al. 2014). In addition, different pathways of introduction of pathogens or pests like plant’s trade or harvested wood pose a continuous threat. Among the most common pests and pathogens that can be found affecting Sitka spruce growth are honey fungus (Armillaria spp.), root and but rot (Heterobasidion spp.), bark beetle (Dendroctonus spp.), green spruce aphid (Elatobium abietinum) and pine weevil (Hylobius abietis) (Tuffen et al. 2014).
Summer droughts may increase the susceptibility of Sitka spruce to suffer biotic attacks (Sturrock et al. 2011). Warmer temperatures and mild winters will favour the presence and spread of bark beetles through spruce plantations (Ray et al. 2008). As well, outbreaks of the green spruce aphid have been connected to the previous (Straw et al. 2011). Additional consequences that might emerge are stem cracks and tree deaths which have been reported in Scotland after dry summers (Green et al. 2008). Alternative management practices have been presented to deal with the risks
mentioned above (Cameron, 2015): (1) mixture plantations combining Sitka spruce and other species like Douglas fir (Pseudotsuga menziesi) could be used to spread the risks; (2) identify and establish plantations in suitable locations for the growth of Sitka spruce i.e. locations which are expected to be wetter in the future; (3) promote uneven-aged forest plantations instead of even-aged plantations where more variability in the vegetation structure of the stand will be present.
1.3 Growth vs quality selection
Lee (1999) and Cameron et al. (2012) stated that selection in breeding programs must be aimed to increase growth and enhance quality traits simultaneously. In addition,
12
provenance selection might have a huge importance when dealing with climate change and foreign species (Shelbourne et al. 2007). For some quality traits is more difficult to enhance their quality at the same time as there might be a trade-off between them. One example is the negative correlation between breast height diameter and wood density, when one of them increases the other decreases. However, the opposite also occurs, when two traits have a positive correlation i.e. stem diameter and thickest branch diameter thus both tend to increase hand in hand (Pfister, 2007). In spite of this, selection of progenies can be made to favour thicker stem diameters without increases on branch diameters. Multi-trait enhancement has shown that selection for different quality traits can be made while keeping the quality of negatively correlated traits. One example is the combination of straight stem form and larger diameter growths which could be obtained while preserving the same wood density. Multi-trait selection programs can be very helpful to explore the correlation between traits and improve the trait selection (Cameron et al., 2012).
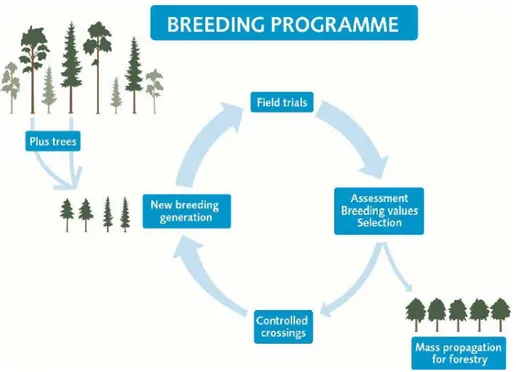
1.4 Breeding programs
Breeding programs (figure 2) objectives are to develop higher growth rates, quality traits and adaptability to changing environmental conditions. Good capabilities of adaptation to different sites are important for the selection of the regeneration material (Ruotsalainen, 2014). Seed production and flowering timing are also important qualities that should be looked for to secure long term production of seedlings (Pâques et al. 2013). The time needed by forest plantations to produce enough seeds for harvesting goes between 10 and 20 years from the establishment (Haapanen et al. 2015).
In Sweden, breeding programs frequently have in common the following four steps: selection, testing, establishment of populations and mass production (figure 2). The selection is made in natural forest stands with a wide range of genotypes based on phenotypic traits for example height, diameter or straightness. The selection of the best individuals (plus-trees) is further tested, most often by seed collection where the seeds grow to seedlings (progenies) which are planted in field trials. It is possible to
13
collect the seeds from either full-sibs (where the mother tree and the father tree are known), or half-sibs (where the mother tree is known but the father tree is unknown, collected from free-pollinated stands). Based on the progenies growth in the field trials, the best plus-trees are selected again and grafted for future crossings to create a base population to do further selections (F1 population). The selected plus-trees might be used for mass-propagation in seed orchards to produce seeds for commercial purposes (Mullin et al., 2010; Haapanen et al., 2015). This cycle is frequently repeated in consecutive generations.
Figure 2. The four main stages in breeding programmes are Selection, Testing, Establishment of
populations and Mass production. Source: Haapanen et al. (2015).
Genetic diversity is also an important aspect to consider in every breeding program and is one of the main issues connected to long term programs (Kleinschmit, 1992; Rosvall, 2006). Economic gains of breeding programs are directly linked to genetic diversity in long term programs where short term initiatives are needed to make these profitable (Gullberg et al. 1985). Variability is essential to adapt to environmental changes that occur over time and at a tree level. Heterogeneity increases the chances
14
of adaptation and therefore the use of a minimum number of plus-trees is essential (Rosvall, 2006).
1.5 This study
This study used a 22 year old field trial established by Skogforsk within a Sitka spruce (Picea sitchensis (Bong.) Carr.) breeding program. The aim of the trial was to select the best Sitka spruce plus-trees based on their progenies growth, to develop a breeding population to satisfy current seed and plant producer’s demands. The trial was one of four field trials in southern Sweden. The objective of this study was to evaluate phenotypic and genotypic variation in growth and quality properties for 288 half-sib Sitka spruce progenies representing selected plus-trees. In addition, the selection made in age 6, was compared to measurements of growth and quality at age 22.
Hypotheses
• There is a strong genetic relationship for the same traits measured in different ages on the same tree.
• The early measurement of height gives a reliable estimation of genotypic value; progenies that ranked high at the age of 6 are ranked high at the age of 22. • The wood density decreases with increasing diameter but it is possible to select
genotypes that combine robust diameter growth with high density.
• Heritability values for height, dbh, wood density (Pilodyn values) and branch diameter are sufficiently strong to allow selection of plus-trees in breeding programmes.
• Sitka spruce can be an alternative to Norway spruce and Scots pine in the Western coast of Sweden.
15
2. Materials and methods
2.1 Location
The field trial was established in Båstad Municipality in Skåne (56°23'N 12°50'E). The study area has an oceanic climate with average annual precipitations of 775mm and average annual temperatures of 7°C approximately (en.climate-data.org, 2017). The field trial was planted on a continuous slope with southwest orientation at an altitude of 190m.
Planting was done in 1996 with one year old seedlings. In total, 3834 seedlings were planted whereof 316 plus-trees Sitka spruce progenies. In addition, 60 seedlings progenies of 2 plus-trees of Norway spruce were used as a comparison and randomly planted intermixed with the Sitka spruce seedlings. The seedlings, both Sitka spruce and Norway spruce were half-sibs of selected trees. The criteria used for plus-trees selection in this field trial are today unknown. It is a common practice to do the selection based on observations of good growth and external quality properties. On the other hand, the seeds represented a wide range of genotypes as they come from different populations and individuals. In total, 26 different locations of seed sources distributed in the following four countries: Sweden, Norway, Denmark and Great Britain were used (see Table 4, Appendix).
The field trial design is a randomized single-tree plot where seedlings from the
different progenies and species are distributed randomly over the field trial (figure 3). The spacing was 1.8 x 1.8 meters. The site was divided into 30 plots in order to
facilitate the data collection. In total, 132 trees were planted per plot approximately. The management operations done in the stand was one pre-commercial thinning, to remove naturally regenerated trees and one commercial thinning in late summer 2018. In the thinning 27% of all the trees in the field trial were removed. From the harvested trees, 81% of the stumps were identified and measured for stump
diameters. The other 19% of stumps were totally covered by slash and not found or measured in the last inventory.
16
The number of planted seeds from each plus-tree, varied between 1 and 25, therefore only the plus-trees with more than 5 individuals in the last revision were included in further analysis. Some of the blocks didn´t have 132 trees due to one of the following four reasons: (1) there were some spots at the site where the machines couldn´t plant the seedlings when the plantation was made, (2) natural mortality accounted for 32% of all missing trees in the whole site, (3) as an exception, in block number 30 only half of the area was planted due to adverse site conditions, and (4) the harvested trees from the commercial thinning in late summer 2018.
Figure 3. Field trial design at Salomonshög.
2.2 Inventories
The field trial was measured the years 1998, 2002 and 2009 and a final measurement late autumn 2018, at the age of 2, 6, 13 and 22 respectively. In the first two
inventories, the heights of all the trees were measured while in the third and fourth, the diameter at breast height (DBH = 1.3 meters above the ground) was measured for
17
all trees (see Table 5, Appendix). Eventual mortality was also recorded at all revisions. In the inventory of 2018, dbh (cm) on standing trees, stump diameter on harvested trees (approximately 0.10-0.15 meters above ground (cm)), and quality assessments were recorded. A caliper was used to take the measurements of dbh and branch diameter whereas a VERTEX device and a Transponder were used to measure the heights. The following quality aspects were assessed:
• Diameter of the thickest branch closest to dbh (cm).
• Branch angle of the thickest branch (scoring value explained below). • Wood density at dbh (Pilodyn value explained below).
• Straightness (scoring value explained below).
• Number of forks and their location on the stem (butt log < 6 meters).
• Number of spike knots above 0.5 meters from the ground and their location on the stem (butt log < 6 m).
Stem damage observations were registered without specifying their origin or cause. The scoring values of the diameter of the thickest branch, the branch angle of the thickest branch and straightness were taken subjectively based on the observer. The branch angle scoring value was taken looking at the joint spot of the branch with the stem. The punctuation, in parentheses, that was applied ranked from 0 to 3: (0) branch angle 0°, (1) branch angle 1° to 44°, (2) branch angle 45° and (3) branch angle above 45°. The straightness scoring value was made from stem observations from two different planes separated by 90° from each other. The punctuation, in parentheses, that was applied ranked from 0 to 2: (0) the stem was straight on both planes, (1) the stem was straight on one plane and crooked in the other and (2) the stem was crooked on both planes. The wood density scoring value was taken by the Pilodyn tool. The Pilodyn introduces a needle into the stem of the tree giving a measure of penetration depth that can be read at the time on a scale. This measure gives an indication of the density and rank of the trees and it is not a direct measurement of the density. The fork measurement was taken for all the trees without considering the fork size. In further analysis, only the forks with diameters of at least 2/3 of the main diameter will be considered while the rest will be viewed as branches.
18
In addition, both stump diameter (cm) and dbh (cm) were measured for 100 randomly selected sample trees. Height was measured for 40 selected sample trees where 10 trees represented the thickest trees in the stand and 30 were randomly selected. To avoid the edge effect the trees growing in the borders (outer 3 – 4 rows) were excluded from sampling.
2.3 Data management
The growth comparison to Norway spruce growing in the same field trial was done. The measurements used in this study come from inventories done at the age of 2, 6, 13 and 22. In addition, the mean height growth at the age of 6 was used to see how well initial heights correlate with DBH growth for the coming years.
Dbh and height estimations
Based on the sample of stumps diameters and breast height diameters, a linear model was developed to estimate the dbh of the harvested trees. The model used was the following:
DBHest = a + b x ST;
where DBHest was the estimated dbh (cm), a and b the coefficients (a= 1.04844,
b=0.69795) and ST was the measured stump diameter (cm).
In further analysis DBHest were used to estimate production and thinning parameters.
Site index was calculated for Norway spruce where the heights of the trees corresponding to the thickest DBH were used (Johansson et al., 2013).
Height-diameter relationship was estimated according to the model developed by Näslund (1936). The relationship was used to estimate the height of trees that had only DBH measured with the following non-linear model:
Height = 1.3 + (DBH2) / (a x DBH + b)2;
where Height was the estimated height (m), DBH was the diameter at breast height (cm) and a and b the coeffients (a=0.2163, b=1.2284).
19
Volume and SI estimations
The calculations of volume in the field trial were made by using m3sk values obtained from
https://www.skogskunskap.se/rakna-med-verktyg/mata-skogen/volymberakning/ (Rytter, 1998).
SI based on dominant height was estimated using Norway spruce SI-models obtained from https://mateuszskog.shinyapps.io/site_index_sweden/ (Johansson, et al., 2013).
The thinning ratio was calculated with the following formula: Thin.Ratio = diamrem/diamsta;
where diamrem referred to the mean DBH of removed trees (15 cm) and diamsta
referred to the mean DBH of standing trees before the thinning in the field trial (16 cm).
The thinning ratio obtained was 0.95 (thinning from below). The mean dbh of removed trees was 15.11 cm and the mean dbh of standing trees before the thinning was 15.97 cm.
Heritability and genotypic correlations
The heritability of height, diameter at breast height, branch diameter and wood density (Pilodyn values) were calculated to see which traits, if any, could be used to make selections of plus-trees in breeding programmes. The calculation of genetical parameters was based on individual tree observations according to the model:
Yijk = μ + bi + cj + eijk
where Yijk referred to observation k, in plot I, for familj j, μ referred to a general mean (intercept), b referred to a random effect of plot i, j referred to a random effect of familj j, NID (0, σc2) and eijk referred to a random error term for observation ijk NID (0,
20
The estimation of the variances σc2 and σe2 and cj i.e. BLUP-values (best linear unbiasd
predictor), for half-sib families were done by means of mixed models in AsReml software (Gilmour).
The individual broad sense heritability for each trait was calculated from the variance estimates as:
H2 = 4 ∗( σ σ𝑐𝑐2
𝑐𝑐2 + σ𝑒𝑒2)
where σc2 and σe2 are genotypic and environmental variances, respectively.
Genotypic correlations representing the proportion of variance explained by genetics was calculated as well as for phenotypic correlations. The genotypic correlations (Rg)
between analysed traits were estimated according to the formula:
Rg = sqrt( σσt1t2
𝑡𝑡1 + σ𝑡𝑡2)
where σt1t2 is the genotypic covariance between traits t1 and t2, and σt1 and σt2 are the
genotypic standard deviation for traits t1 and t2, respectively.
2.4 Analysis
Plus-tree effects were analysed through their progenies where growth and quality traits were assessed. For both, Sitka spruce and Norway spruce, ten groups with approximately 10% of the progenies on each one were made from 350 different progenies. The progeny grouping was based on the mean height growth of every progeny during 1998 – 2002 (figure 4). These groups were named: G1, G2, G3, G4, G5, G6, G7, G8, G9 and G10, where G1 and G10 represent the slowest and the fastest growing groups respectively. Each of the groups represents between 25-48 plus-trees progenies.
A one-way Anova (analysis of variance) was implemented for the progeny groups to test the differences in growth and the quality assessments between them. A p-value of 0.05 was selected as significant level for all the tests. When a significant difference was
21
achieved in the Anova analysis, a Tukey test (post-hoc test) was performed to check for differences between the groups.
The differences in the quality assessments between the groups were tested for forks, spike knots, branch diameter at DBH, branch angle value at DBH and density value. Branch diameter was compared between the species selecting similar dbh values. Norway spruce DBH were comprised between 6.5cm and 9cm. Sitka spruce had a wider range of DBH and therefore only trees with DBH between 6.5 and 9 cm were selected to compare the branch diameters with Norway spruce. The Anova test and Tukey test (if Anova was significant) was performed in the following way:
• Comparison of progenies within the G10
• Comparison of progenies growth in G10 with Norway spruce progenies • Comparison of seed origins within G10 group
• Comparison between all the G (1 to 10) groups of Sitka spruce • Comparison of seed origins within all progenies
22
3. Results
3.1 Height and dbh growth
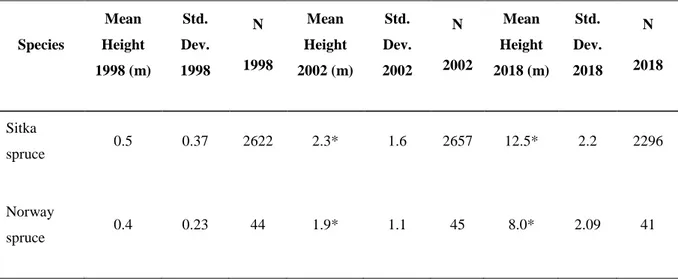
In the year 1998, the mean height of Sitka spruce and Norway spruce was 0.5m and 0.4m respectively. In 2002, the mean height raised to 2.3m and 1.9m for Sitka spruce and Norway spruce respectively. The species differences between the mean height values obtained in 1998 for every group become larger over time (table 1). The two Norway spruce progenies mean height growth was the same for the period 1998-2002. During this period, the mortality accounted for 7 trees in the whole dataset.
Table 1. Summary of heights and standard deviations. *Significant differences (p>0.05) were found
between the species.
Species Mean Height 1998 (m) Std. Dev. 1998 N 1998 Mean Height 2002 (m) Std. Dev. 2002 N 2002 Mean Height 2018 (m) Std. Dev. 2018 N 2018 Sitka spruce 0.5 0.37 2622 2.3* 1.6 2657 12.5* 2.2 2296 Norway spruce 0.4 0.23 44 1.9* 1.1 45 8.0* 2.09 41
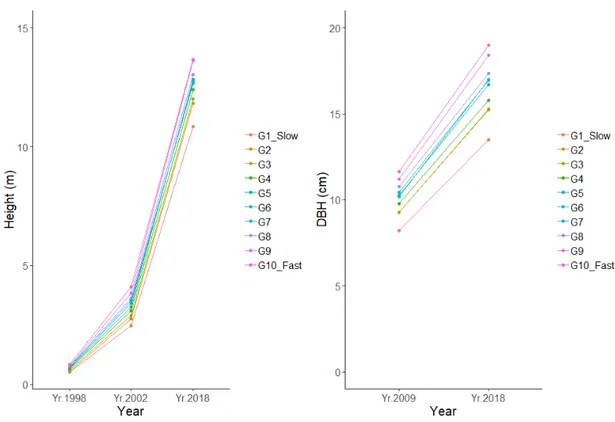
The group G10, based on the 28th best growing progenies during the period 1998 –
2002, had a mean height of 2.8m in 2002. 21 of 28 progenies in group 10 were still in the best growing tenth percentile during the period 2009-2018 based on DBH
increment. The best growing progeny group, G10, showed a larger diameter
development in the following years than the rest of the groups. Additionally, the first percentile of progenies identified during 1998 - 2002, G1, had the lowest diameter growth during the period 2009 – 2018 and the lowest mean height in the year 2018 (figure 5).
23
Figure 4. Left panel: Mean height development of Sitka spruce progeny groups for the years 1998, 2002
& 2018. Right panel: dbh development of Sitka spruce progeny groups for the years 2009 & 2018.
Figure 5. Left panel: Mean height growth for families for the period 1998-2002, sorted in growth rates
and coloured by the grouping G1-G10. Right panel: Box and whisker plot of family mean dbh increase G1-G10 for the period 2009-2018. The box represents the values between the 25th percentile and the 75th percentile where the black line is the median value of the progenies (50th percentile). The black dots are the outliers.
24 3.2 Quality assessments
3.2.1 Forks
The progeny and the seed origin weren’t significant factors (p>0.05) determining forking. In addition, Sitka spruce progenies weren’t significantly different from each other when grouped by seed origin or family (p>0.05). There was no significant difference (p>0.05) between the best group of Sitka spruce (G10) and the Norway spruce progenies; nor between G10 and the rest of Sitka spruce progenies.
In total, 6% of both species had trees with double stems and <1% with triple stems. The G10 group had 25% (7 progenies) of the progenies with at least one tree with a double stem and the rest of Sitka spruce progenies had 22% (63 progenies) of the progenies with at least one tree with a fork.
3.2.2 Spike knots
There was no significant difference between the number of spike knots present in the best group of Sitka spruce and Norway spruce. No statistical differences were found between the best group of Sitka spruce and the rest of families. In addition, Sitka spruce families weren’t statistically different from each other when grouped by origin or family.
The proportion of Sitka spruce stems with spike knots was 21% and of these, 94% had spike knots on the butt log (< 6 m). Similarly, the proportion of Norway spruce stems with spike knots on the butt log was 17%. G10, the best group of Sitka spruce, had spike knots on 57% (16 progenies) of its trees whereas from the rest of Sitka spruce trees in the field trial 65% (188 progenies) had spike knots.
3.2.3 Branch diameter at breast height
Branch diameter measurements ranged between 1 and 2.5 cm. For similar dbh values (6.5cm to 9cm) of Sitka spruce and Norway spruce, mean branch diameters were 1.3cm and 0.9cm respectively. The best group of Sitka spruce had a mean branch
25
diameter of 1.8cm and the rest of progenies of Sitka spruce had a mean branch diameter of 1.7cm.
Sitka spruce developed significantly thicker branches than Norway spruce (p<0.05) when compared in the range of DBH 6.5cm – 9cm. However, within the selected DBH range, there was no significant difference between group G10 and Norway spruce (p>0.05). However, differences were found between the Sitka spruce progenies for the whole dataset. Both the progeny (p<0.001) and the seed origin (p<0.05) were
significantly affecting branch diameter. The best seed origin was Häckeberga and the worst Skogsnäbben in accordance with the results obtained from the TukeyC.
3.2.4 Branch angle value at breast height
Sitka spruce mean branch angle value was 1.2 (316 progenies, 1583 measurements) and for Norway spruce 1.0 (2 progenies, 12 measurements). The best group of Sitka spruce had a mean branch angle value of 1.3 and the rest of the progenies of Sitka spruce 1.2. Most of the measurements showed angle values between 1 and 2 and there were no statistical differences between the best group of Sitka spruce and the rest of Sitka spruce progenies. However, significant differences were found when comparing the mean branch angle between Sitka spruce progenies. Both the progeny (p<0.05) and the seed origin (p<0.05) affect the branch angle value.
3.2.5 Density value
Sitka spruce mean Pilodyn values was 29 (316 progenies, 1573 measurements) and for Norway spruce 25 (2 progenies, 12 measurements) (figure 6). The best group of Sitka spruce and Norway spruce Pilodyn values were statistically different from each other with the Anova test (p: 8.017e-07). No significant differences in density were found between the best group of Sitka spruce and the rest Sitka spruce progenies. However, significant differences were found when comparing Sitka spruce progenies grouped by progeny (p=0.003) and seed origin (p<0.001). The TukeyC identified as the best Sitka spruce progeny nr. 304 and the worst nr. 541. Additionally, from the TukeyC test the
26
worst seed origins were identified as Trolleholm, Ekebo, Äskåsen, Skogsnäbben and
Honganvik. The rest or the seed origins weren’t different form each other.
Figure 6. Box and whisker plot of progeny Pilodin values for the best Sitka spruce group. The box
represents the values between the 25th percentile and the 75th percentile where the black line is the median value of the progenies (50th percentile). The black dots are the outliers.
3.3 Heritability
Table 2 below shows the heritability results for the measured traits. The heritability values for early measurements showed the lowest values. However, with the increase in age, this value increased. The heritability value of height at the age of 2 was 5% whereas at the age of 6 increased to 17%. On the other hand, the dbh showed the opposite trend where at the age of 12 heritability was 14% and at the age of 22 decreased to 10%. The heritability values for the branch diameter and the wood density where 22% and 17% respectively.
27
Table 2. Mean values and genetic parameters are presented for height, dbh, branch diameter and wood
density (Pilodyn values). The numbers in the subscript indicates the measurement age. The names of the traits appear in the first column abbreviated as H for height, D for dbh, DBR for branch diameter and PILO for Pilodyn values.
Trait Unit N Mean SE Min Max CVPHENO% H2 SE of
H2 CVGEN% H2 Cm 2662 68 0.47 14 176 35.1 0.0525 0.052 3.26 H6 Dm 2694 326 1.8 38 590 27.1 0.1710 0.059 4.52 D13 Mm 2696 95.6 0.58 2 208 31.3 0.1470 0.057 5.4 D22 Mm 1606 16.3 0.11 1.5 39 28.8 0.1015 0.087 4.06 DBR22 Mm 1606 1.73 0.02 0.5 15 39.2 0.2178 0.099 8.03 PILO22 Mm 1594 29.09 0.08 15 39 10.7 0.1690 0.094 1.93
3.4 Phenotypic and Genetic Correlation between traits
Early measurements of height showed 6% of correlation with Pilodyn values at the age of 22. Dbh measurements presented higher correlations than height in relation to Pilodyn values between 24-30%.
Table 3. Genetic (above diagonal) and phenotypic (under diagonal) correlations.
H2 H6 D13 D22 DBRANCH PILO H2 x NA NA NA NA NA H6 0.77 x 0.82 0.90 -0.62 0.064 D13 0.59 0.77 x 0.96 -0.72 0.2968 D22 0.42 0.61 0.91 x -0.67 0.241 DBR22 0.09 0.15 0.45 0.51 x -0.3595 PILO22 0.24 0.37 0.50 0.52 0.23 x
28
3.4.1 Branch diameter and breast height diameter
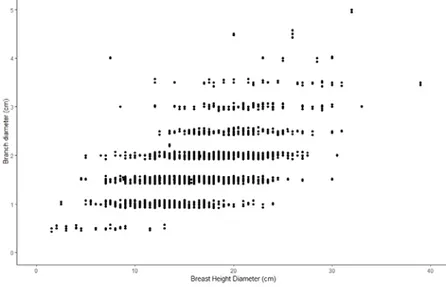
DBH is positively correlated to branch diameter (figure 7). Thus, larger tree DBH are likely found on trees with thicker branches (p: <2*e-16). However, tree DBH is not the only factor having an impact on branch diameters. The progeny and the location in the field trial were also significative, p: 0.000606 and <2*e-16, respectively.
Figure 7. Branch diameter is plotted against DBH showing a general increase of size with
increasing tree DBH.
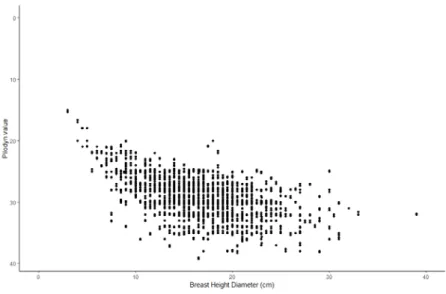
3.4.2 Pilodyn values and DBH
Pilodyn values were correlated to DBH with a P: <2*e-16. In general, higher Pilodyn
values, indicating lower density values, were obtained for higher DBH (figure 8). However, there are trees that keep a lower Pilodyn value, indicating higher wood densities, when increasing in DBH. For larger DBH over 20 cm Pilodyn values range from 25 to 35 showing that is possibility of selection of larger trees with higher density values.
29
Figure 8. DBH over Pilodyn value. Lower Pilodyn values indicate higher wood density values.
3.5 Production in the trial
Volume production and SI
The volume per tree obtained in the field trial was 0,142 m3sk. The total volume
production in the field trial was estimated to be 371.04 m3*ha-1 at the age of 22. In the
thinning of 2018, the volume removed was about 146.54 m3*ha-1 (39.49%) where 27%
30
4. Discussion
In this field trial, genetic diversity was high when considering the total number of plus-trees included, 350. The number of plus-plus-trees in groups G10 and G9 were 32 and 33 respectively. At Skogforsk a minimum number of 50 plus-trees are desired to establish new populations for testing. Other studies show higher selection intensity from nearly 1800 plus-trees (Lee, 1999). As well, the number of progeny tests was of 200 whereas for Sitka spruce in Sweden only 4 have been performed. This might be due to the importance given to this species where in Great Britain is extensively used in forest plantations and in Sweden it is not.
In this study, the correlation of measured traits at different ages show that it is possible to make an early selection based on the trees height to get higher values of dbh in the future. The selection of trees for higher wood densities using early height measurements isn´t recommended (6% of correlation). As well, dbh measurements at the age of 13 or 22 show low correlations, 29% and 24% respectively, to select for wood density. The genetic correlation obtained for the same trait was strong: height at the age of 2 was 77% correlated to the height at the age of 6 and also for the dbh at the age of 13 which was 96% correlated to the dbh obtained at the age of 22. This result is similar to other studies which studied dbh and height parameters showing that some phenotypic values in the same are correlated (Zhang et al. 2015). In addition, heritability values for height (H2= 0.17) and dbh (H2= 0.14) where low
indicating an environmental influence. Similar results were obtained for branch diameter and wood density. This result comes from one field trial and often many are needed to draw important conclusions.
Initial height measurements taken from 2 years old and 6 years old seedlings (1998 - 2002) can be used to establish a preliminary selection of fast growing progenies. The number of plus-trees used in the analyses, 350, was relatively low compared to other previous studies (Lee, 1999) where more than 1800 plus-trees were tested. This has important implications on the probability of selection of the best plus-trees possible for the site. Apart from this, the selection of the best plus-tree progenies during a period of 6 years was relatively early compared to the selection based on other traits
31
in other studies which can be made at the age of 11 or 20 years (Kleinschmidt, 1992; Lee, 2001).
Trait variability is also shown to be essential in this study. Trait variation in wood density values and branch diameters allow the selection of good quality individuals among large samples. Quality traits can be developed towards the direction that we want (Pfister, 2007). Rosvall (2006) points out three aspects that can model genetic diversity in breeding programs: (1) the size and diversity of the population sample taken from the forest, (2) the breeding program selection procedure to maintain that diversity over the breeding steps and (3) the mutation frequency which is random. Breeding programs may have different purposes for a single species but overall the objective is always to produce robust generations to be able to cope with pests, water availability or early summer frosts (Klang, 2000). Thus, when producing good plant material, quality its more likely to be better even in difficult field conditions.
Quality traits as branch size showed a positive correlation with dbh. As shown before by Pfister (2007), this could be indicative that greater dbh are expected to develop thicker branches. Cameron et al. (2012) stated that branch diameter could also be affected by the number of branches per whorl. An increase in the number of branches per whorl might produce thinner branches. This has been tested for Scots pine, Virginia pine (Pinus virginiana Mill.) (Bailey et al., 1974) and White spruce (Picea glauca)
(Merrill, et al., 1985). Few forks were present in the field trial and yet 57% of the trees in G10 had spike knots. The driving cause of forking in this field trial and the
development of spike knots aren´t known. Even so, possible reasons that could have caused them could be browsing, late frost or genetics (Klang, 2000). Overall, the amount of trees with double stems for Sitka and Norway spruce was similar as well as the trees with triple stems.
Another quality factor that could be correlated to other traits is wood density. The values of wood density presented a decreasing trend for larger diameters, however, the range of the pilodyn values for dbh sizes over 20 cm, ranged from 25 to 35 showing that it is possible to make a selection of larger trees with higher density values. In accordance with previous studies, there is a trend towards lower wood density values
32
for larger dbh sizes showing strong negative correlations between large dbh and wood density (Lee, 1999).
Production calculations in the field trial illustrated high production growths. In Southern Sweden, the actual production for Norway spruce in good sites is around 8-10 m3*ha-1*yr-1 (Bergh, 2005) whereas for Sitka spruce in this field trial was of 16
m3*ha-1*yr-1 during the first 22 years. In other field trials in Southern Sweden, Sitka
spruce had in comparison to Norway spruce around 14% of higher volume production in equal SI conditions (Tengberg, 2005). Bergh (2005) analyses the importance of water availability in Southern Sweden and describes it as the main limiting factor for growth. Sitka spruce main growth limiting factors might be late frosts and drought (Klang, 2000).
However, to be able to draw a strong general conclusion this study should be
combined with at least two or three more field trials testing the progenies of the same plus-trees that were used in this field trial. Generally, breeding programme testing comprises several field trials where the seeds of the selected plus-trees are tested in different sites. The conclusions that can be obtained from several field trials will be more reliable and therefore, further testing has to be done in order to make the final choice of plus-trees to use in the next breeding generation.
33
5. Conclusions and management implications
An early selection of the best progenies is possible if we base our decision on the first 6 years height growth development. From the 28 progenies selected at the beginning in the fastest growing group tenth percentile, 75% of them were still in the best growing tenth percentile during the period 2009-2018 based on DBH increment. Predictions on good quality traits cannot be made based on initial growth heights at the beginning of the field trial, however, the progenies in this group didn´t show significant differences with regard to the other groups.
Sitka spruce can be presented as a real alternative to Norway spruce in good sites for its growth. The Southwestern Coast of Sweden meets the environmental requirements of this specie and therefore can be suggested as good opportunity to use Sitka spruce instead of Norway spruce.
To conclude, there is still a need of management guidelines and experience on the use of this species that has to be covered in order to increase its use in forestry production in Sweden.
34
References
Almqvist, C., Wennström, U., & Karlsson, B. (2010). Improved forest regeneration material. (In Swedish with English summary). Redogörelse, 3: 1-59. Skogforsk, Uppsala. ISBN: 978-91-88277-00-8.
Bailey, J. K., Feret, P.P. & Bramlett, D.L. (1974) Crown character differences between well-pruned Virginia pine trees and their progeny. Silvae Genetica, 23: 181–185. Bergh, J., Linder, S. & Bergström, J. (2005). Potential production of Norway spruce in Sweden. Forest Ecology and Management, 204: 1–10.
Cameron, A. D., Kennedy, S. G., Lee, S. J. (2012) The potential to improve growth rate and quality traits of stem straightness and branching habit when breeding Picea sitchensis (Bong.) Carr. Annals of Forest Science, 69: 363-371.
Cameron, A. (2015) Building Resilience into Sitka Spruce (Picea sitchensis (Bong.) Carr.) Forests in Scotland in Response to the Threat of Climate Change. Forests, 6: 398-415. Eklund, A., Mårtensson, J.A., Bergström, S., Björck, E., Dahné, J., Lindström, L.,
Nordborg, D., Olsson, J., Simonsson, L. & Sjökvist, E. (2015). Sveriges framtida klimat - Underlag till Dricksvattenutredningen (SMHI). Klimatologi Nr 14. ISSN: 1654-2258. En.climate-data.org (2017). Climate Båstad. [online] Available at: https://en.climate-data.org/europe/sweden/skane-laen/bastad-8916/. [Accessed 12 Feb 2019].
Felton, A., Ellingson, L., Andersson, E., Drössler, L. & Blennow, K. (2010) Adapting production forests in southern Sweden to climate change: Constraints and
opportunities for risk spreading. International Journal of Climate Change Strategies and Management, Vol. 2 Issue: 1 pp. 84- 97. https://doi.org/10.1108/17568691011020274. Felton, A., Gustafsson, L., Roberge, J.M., Ranius, T., Hjältén, J., Rudolphi, J., Lindbladh, M., Wesliend, J., Rist, L., Brunet, J. & Felton, A.M. (2016) How climate change
adaptation and mitigation strategies can threaten or enhance the biodiversity of production forests: Insights from Sweden. Biological Conservation, 194: 11–20.
Green, S., Hendry, S.J.; Redfern, D.B. (2008) Drought damage to pole-stage Sitka spruce and other conifers in north-east Scotland. Scottish Forestry, 62: 10–18.
Gullberg, U. & Kang, H. (1985) A model for tree breeding. Studia Forestalia Suecica 169. 8 pp. ISSN: 0039-3 150, ISBN: 91-576-2290-6.
Haapanen, M., Jansson, G., Bräuner, U., Steffenrem, A. & Stener, L. (2015). The status of tree breeding and its potential for improving biomass production: A review of
35
breeding activities and genetic gains in Scandinavia and Finland. Skogforsk, Uppsala. ISBN: 978-91-88277-00-8.
Ingvarsson, P.K. & Dahlberg, H. 2017. The effects of clonal forestry on genetic diversity in wild and domesticated stands of forest trees. Scandinavian Journal of Forest
Research. DOI: 10.1080/02827581.2018.1469665
Johansson, U., Ekö, P.M., Elfving, B., Johansson, T. & Nilsson, U. (2013) Nya
höjdutvecklingskurvor för bonitering. Sveriges lantbruksuniversitet. Fakta Skog, 14. Klang, F. 2000. The influence of silvicultural practices on tree properties in Norway spruce. Swedish Univ. of Agric. Sc., Southern Swedish forest research centre, Doctoral thesis, Silvestria 128, 33pp. ISBN-91-576-5862-5.
Kleinschmidt, J. (1992) Use of spruce cuttings in plantations. Forestry Commission Bulletin 103. HMSO, London. ISBN: 0 11 710305 5.
Kristensen, E. (2011) Överlevnad, tillväxt och skador i planteringar av sitkagran (Picea sitchensis) efter stormen Gudrun. Examensarbete nr 181. Institutionen för sydsvensk skogsvetenskap (SLU).
Lee, S.J. (1999) Improving the timber quality of Sitka spruce through selection and breeding. Forestry, 72: 123–146.
Lee, S.J. (2001) Selection of parents for the Sitka spruce breeding population in Britain and the strategy for the next breeding cycle. Forestry, 74: 129–143.
Leech SM, Lara Almuedo P, O’Neill G. 2011. Assisted migration: adapting forest management to a changing climate. The Journal of Ecosystems and Management, 12:18–34.
Lindgren D, Karlsson B, Andersson B, Prescher F. 2007. The Swedish seed orchard program for Scots pine and Norway spruce.
Lines, R. (1987) Choice of seed origins for the main forest species in Britain. Forestry Commission Bulletin 66. HMSO, London. ISBN: 0 11 710204 0.
Mason, W.L. & Perks, M.P. (2011) Sitka spruce (Picea sitchensis) forests in Atlantic Europe: Changes in forest management and possible consequences for carbon sequestration. Scandinavian Journal of Forestry Research, 11: 72–81.
Merrill, R.E. & Mohn, C.A. (1985) Heritability and genetic correlations for stem diameter and branch characteristics in white spruce. Canadian Journal of Forestry Research, 15: 494–497. https://doi.org/10.1139/x85-081.
36
Moore, J. (2011). Wood properties and uses of Sitka spruce in Britain. Forestry Commission Research Report. Forestry Commission: Edinburgh. ISBN: 978-0-85538-825-6.
Mullin TJ, Andersson B, Bastien JC, Beaulieu J, Burdon RD, Dvorak WS, King JN, Kondo T, Krakowski J, Lee SJ, et al. 2011. Economic importance, breeding objectives and achievements. In: Plomion C, Bousquet J, Kole C, editors. Genetics, genomics and breeding of conifers. Abingdon: CRC Press; p. 40–127.
Mullin, T., Hallander, J., Rosvall, O. & Andersson, B. (2010) Using simulation to optimise tree breeding programmes in Europe: An introduction to POPSIMTM. Arbetsrapport Nr
711. Skogforsk, Uppsala. ISSN: 1404-305X.
Näslund, M. (1936). Skogsforsöksastaltens gallringsforsök i tallskog. Meddelanden från Statens Skogsforsöksanstalt, 29: 1-169.
OECD (2006) Section 5 - Sitka Spruce (Picea sitchensis (Bong.) Carr.), in Safety Assessment of Transgenic Organisms. OECD: Paris, Volume 2.
https://doi.org/10.1787/9789264095403-6-en.
Pâques LE, Foffová E, Heinze B, Lelu-Walter MA, Liesebach M, Philippe G. 2013. Larches (Larix sp.). In: Pâques LE, editor. Forest tree breeding in Europe. Dordrecht: Springer Science+Business Media; p. 13–122.
Pfister, O., Wallentin, C., Nilsson, U. & Ekö, P.M. (2007) Effects of wide spacing and thinning strategies on wood quality in Norway spruce (Picea abies) stands in southern Sweden. Scandinavian Journal of Forest Research, 22(4): 333-343.
Ray, D., Wainhouse, D., Webber, J., Gardiner, B. (2008) Impacts of Climate Change on Forests and Forestry in Scotland. Forest Research Report, Forestry Commission: Scotland, UK.
Rosvall, O., Jansson, G., Andersson, B., Ericsson, T., Karlsson, B., Sonesson, J. & Stener, L.G. (2001) Genetiska vinster i nuvarande och framtida fröplantager och
klonblandningar. Redogörelse, 1. Skogforsk, Uppsala. ISSN: 1103-4580.
Rosvall, O., Peichen, G. & Simonsen, R. (2006). Den gamla skogen står i vägen för den nya. Utvecklingskonferens. Redogörelse, 2: 94–104. Skogforsk.
Rytter, L. 1998. Löv- och lövblandbestånd - ekologi och skötsel. Skogforsk, Redogörelse nr 8.
Ruotsalainen, S. (2014) Increased forest production through forest tree breeding, Scandinavian Journal of Forest Research, 29:4, 333-344. DOI:
37
Samuel, C.J.A., Fletcher, A.M. & Lines R. (2007) Choice of Sitka spruce seed origins for use in British forests. Forestry Commission Bulletin 127. HMSO: Edinburgh. ISBN: 978 -0-85538-727-3.
San Miguel-Ayanz, J., De Rigo, D., Caudullo, G., Houston Durrant, T., Mauri, A. (2016) European Atlas of Forest Tree Species. European Commission. ISBN: 978-92-79-36740-3.
Shelbourne CJA, Low CB, Gea LD, Knowles RL. 2007. Achievements in forest tree genetic improvement in Australia and New Zealand 5: genetic improvement of Douglas-fir in New Zealand. Australian Journal of Management, 70:28–32.
Skogsdata (2017) Aktuella uppgifter om de svenska skogarna från Riksskogstaxeringen: Skogsmarkens kolförråd. Institutionen för skoglig resurshushållning. SLU
Publikationsservice, Uppsala. ISSN: 0280-0543.
Skogsstyrelsen (2009) Regler om användning av främmande trädslag. Meddelande 2009/7. ISSN: 1100-0295.
Straw, N., Fielding, N., Green, G., Price, J., Williams, D. (2011) Defoliation and growth relationships for mid-rotation Sitka spruce attacked by the green spruce aphid, Elatobium abietinum (Walker). Forest ecology and management, 262: 1223–1235. Sturrock, R.N., Frankel, S.J., Brown, A.V., Hennon, P.E., Kliejunas, J.T., Lewis, K.J., Worrall, J.J., Woods, A.J. (2011) Climate change and forest diseases. Plant Pathology, 60: 133–149.
Tengberg, F. (2005) En jämförelse av sitkagranens (Picea sitchensis) och den vanliga granens (Picea abies) produktion. Examensarbete nr 62. Institutionen för sydsvensk skogsvetenskap (SLU).
Tuffen, M. & Grogan, H. (2018) Current, emerging and potential pest threats to Sitka spruce plantations and the role of pest risk analysis in preventing new pest
introductions to Ireland. Forestry, 92: 26–41.
Zhang, F.Q., Xu, B., Yang, H.X., Zhang, W.H., Zhu, B.Z., Wang, Y.X., Liao, H.Q. & Pan, W. (2015) Genetic parameters and prediction of breeding values in Castanopsis hystrix A.DC. for growth and form traits. Silvae Genetica, 64: 81-90.
38
Appendix
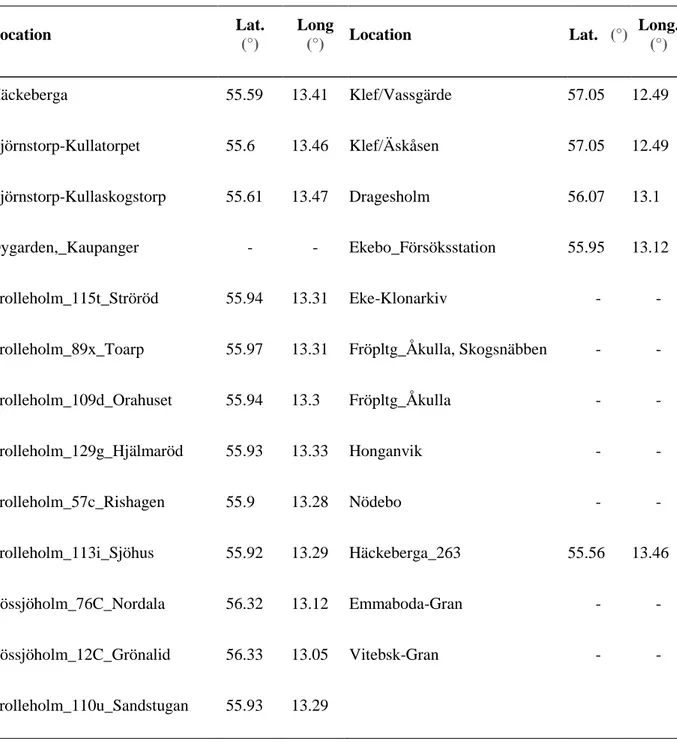
Table 4. Seed origins. (-) unknown.
Location Lat. (°) Long (°) Location Lat. (°) Long. (°) Häckeberga 55.59 13.41 Klef/Vassgärde 57.05 12.49 Björnstorp-Kullatorpet 55.6 13.46 Klef/Äskåsen 57.05 12.49 Björnstorp-Kullaskogstorp 55.61 13.47 Dragesholm 56.07 13.1 Öygarden,_Kaupanger - - Ekebo_Försöksstation 55.95 13.12 Trolleholm_115t_Ströröd 55.94 13.31 Eke-Klonarkiv - - Trolleholm_89x_Toarp 55.97 13.31 Fröpltg_Åkulla, Skogsnäbben - - Trolleholm_109d_Orahuset 55.94 13.3 Fröpltg_Åkulla - - Trolleholm_129g_Hjälmaröd 55.93 13.33 Honganvik - - Trolleholm_57c_Rishagen 55.9 13.28 Nödebo - - Trolleholm_113i_Sjöhus 55.92 13.29 Häckeberga_263 55.56 13.46 Rössjöholm_76C_Nordala 56.32 13.12 Emmaboda-Gran - - Rössjöholm_12C_Grönalid 56.33 13.05 Vitebsk-Gran - - Trolleholm_110u_Sandstugan 55.93 13.29
39
Table 5. Summary of the growths in height and dbh for all the inventories and the growing
groups.
Growth Rate
Mean Height (m) Mean DBH
(cm) Mean Height Growth – Period 1998-2002 (m) Nº Progenies 1998 2002 2018 2009 2018 G1 0.4 1.9 10.9 5.6 12.5 2.0 48 G2 0.5 2.3 11.8 7.2 14.2 2.2 25 G3 0.5 2.3 12.0 6.7 14.6 2.3 36 G4 0.5 2.3 12.4 6.9 15.4 2.5 36 G5 0.5 2.4 12.8 7.3 16.6 2.6 33 G6 0.5 2.6 12.8 7.5 16.5 2.7 34 G7 0.5 2.5 12.7 7.1 16.2 2.8 37 G8 0.6 2.7 13.0 7.7 17.2 2.9 34 G9 0.6 2.7 13.6 7.8 18.5 3.1 33 G10* *Fastest group 0.6 2.8 13.7 7.8 18.7 3.3 32 Species Sitka spruce 0.5 2.4 12.6 7.1 16.0 348 Norway spruce 0.4 1.9 8.0 4.1 7.6 2