The role of the perceived
servicescape in a supermarket
The case of ICA MAXI, Jönköping, Sweden
Master’s thesis within International Marketing
Author: Egle Cicenaite, Maria Maciejewska
Tutor: Prof. Adele Berndt
Master’s Thesis in Business Administration
Title: The role of the perceived servicescape in a supermarket. The case of ICA MAXI, Jönköping, Sweden
Author: Egle Cicenaite, Maria Maciejewska
Tutor: Prof. Adele Berndt
Date: 2012-05-14
Subject terms: Mehrabian & Russell Stimulus-Organism-Response model, Bitner’s framework of servicescapes, environmental factors in a supermarket, customers in Sweden, ICA MAXI
Abstract
Introduction: As many buying decision are made in retail stores, it is interesting to investigate which factors, such as noise, lighting, music, colour, layout or visual communication have a significant influence on customers’ behaviour in a supermarket. Since only a few studies have been conducted among customers in Sweden, this paper examined their behaviour in the supermarket.
Purpose: The purpose of this study was to examine the role of the various environmental factors in the supermarket as well as how the perceived servicescape influences customers’ behaviour in the store.
Method: The research approach used was that of a single case study, based on survey instrument (personal interviews and electronic collection) in order to collect data on facets in regards to the perceived servicescape and customers’ behaviour in the supermarket. A supermarket chain – the ICA group, precisely ICA MAXI in Jönköping was used for this purpose. The collected data was analysed with the means of factor analysis and multiple regression methods in order to obtain factors that can influence customers’ behaviour in the supermarket.
Findings and
Conclusion: The conducted study showed that lighting, noise, colours, signs and symbols as well as space/function conditions such as layout and equipment are the factors that create emotionally pleasant environment in the supermarket. Thus, these factors influence customers’ moods, attitudes or certain beliefs about the supermarket. Moreover, customers may feel happier, more satisfied or relaxed in the supermarket, which lead to arousal – stimulation or excitement. Furthermore, the environmental factors explain the approach behaviour such as exploring the supermarket, spending more time on browsing the products which, consequently, refer to an increased number of items bought.
Acknowledgments
This research would not be completed without the great help and support from the people who contributed their time in different ways to our research.
We specially would like to thank our supervisor as well as our fellow-students for their suggestions and benevolent attitude.
Furthermore, we are kindly grateful for the respondents in Jönköping, Sweden who spent their time to take part in our survey. We want to say thank you as well to managers of ICA MAXI, Jönköping, Sweden for allowing us to collect the data in the supermarket.
Last but not least, we highly appreciate our families for their warm and effortless support and encouragement to our study.
Jönköping May, 2012
Table of Contents
1
Introduction ... 7
1.1 Background ... 7 1.2 Problem ... 9 1.3 Purpose ...10 1.4 Research questions ...10 1.5 Delimitations ...11 1.6 Definitions ...112
Literature Review ... 12
2.1 Servicescapes ...122.2 Dimensions of the perceived servicescape ...14
2.2.1 Ambient conditions ...14
a) Music ...14
b) Noise ...15
c) Lightning ...15
d) Colour ...16
2.2.2 Signs, symbols and artifacts ...17
a) Visual communication (Signage, personal artifacts) ...17
2.2.3 Space/function conditions ...17
a) Layout, equipment and furnishing ...17
2.2.4 Connected stimuli ...18
2.3 Internal responses: cognitive, emotional and physiological ...18
2.3.1 Cognition and environment ...18
2.3.2 Emotion and environment ...18
2.3.3 Physiology and environment ...19
2.3.4 Variations in internal responses ...19
2.4 Individual behaviours ...19
2.4.1 The M-R Stimulus-Organism-Response model ...19
2.4.2 Environmental stimulus (S) ...20
2.4.3 Emotional states (O) ...20
2.4.4 Behaviour responses (R) ...22
2.4.5 Studies based on the M-R model ...22
3
Methodology ... 23
3.1 The research design ...23
3.2 Quantitative research method ...23
3.3 Descriptive research ...24
3.4 The target population ...24
3.5 Sampling technique ...24
3.6 Data collection ...25
3.7 Questionnaire ...26
3.7.1 Pre-Test ...26
3.8 Data analysis...27
3.9 Trustworthiness and relevance of information ...27
4
Findings ... 28
4.1 Reversing negatively worded questions ...29
4.3 Descriptive statistics ...31
4.4 Analysing the significant differences ...32
4.4.1 T-test ...32
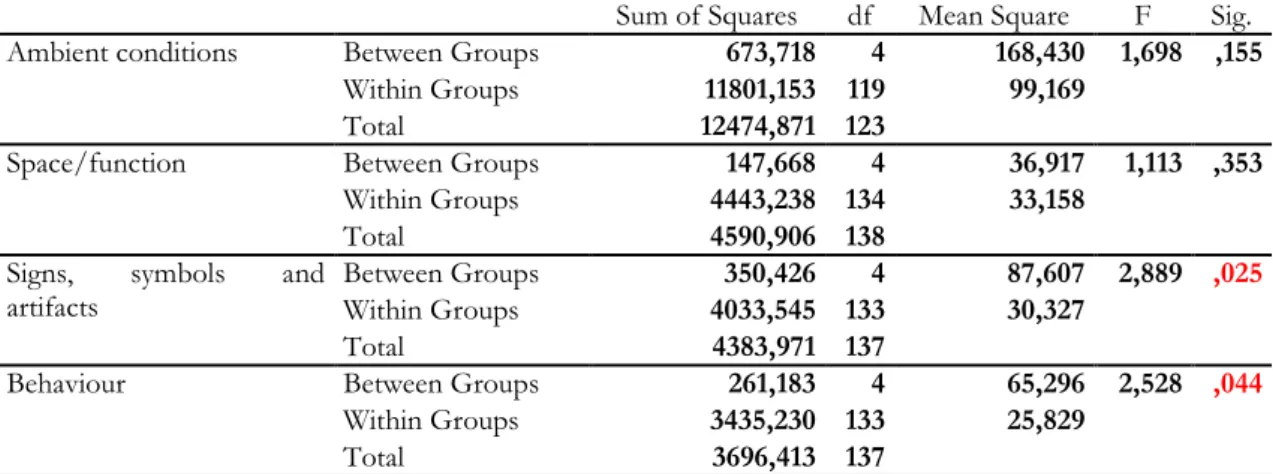
4.4.2 One-way ANOVA ...33
4.5 Factor analysis ...38
4.6 Multiple regression ...42
4.6.1 Correlations and multicollinearity ...43
4.6.2 Evaluating the regression model of customers’ behaviour in ICA MAXI ...44
4.6.3 Evaluating contribution of the dependent variable in customers’ behaviour in ICA MAXI ...45
5
Analysis ... 45
6
Conclusion ... 49
6.1 Managerial implications ...50 6.2 Limitations ...51 6.3 Future research ...517
References ... 53
8
Appendices ... 57
Figures
Figure 1. A Framework for Environment-Behaviour Relationship ...13
Figure 2. The Mehrabian and Russell (1974) model ...20
Graphs
Graph 1. The food industry segmentation - Sweden ... 8Graph 2. Retail Food Market in Sweden ... 8
Graph 3. Scree Plot ...75
Tables
Table 1. Donovan and Rossiter’s (1982) study ...22Table 2. Demographics ...29
Table 3. Cronbach’s Alphas ...30
Table 4. Correlations ...30
Table 5. Descriptive Statistics ...31
Table 6. T-tests for gender and ‘ambient conditions’, ‘space/function’, ‘signs, symbols and artifacts’, ‘behaviour’, and the statement ‘How often do you visit ICA MAXI?’ ...33
Table 7. T-tests for nationality and ‘ambient conditions’, ‘space/function’, ‘signs, symbols and artifacts’, ‘behaviour’, and the statement ‘How often do you visit ICA MAXI?’ ...33
Table 8. One-way ANOVA – age and ‘ambient conditions’ ...34
Table 9. One-way ANOVA – age and ‘space/function’ ...34
Table 10. One-way ANOVA – age and ‘signs, symbols and artifacts’ ...34
Table 11. One-way ANOVA – age and ‘behaviour’ ...35
Table 12. One-way ANOVA – disposable income and ‘ambient conditions’, ‘space/function’, ‘signs, symbols and artifacts’, and ‘behaviour’ ...35
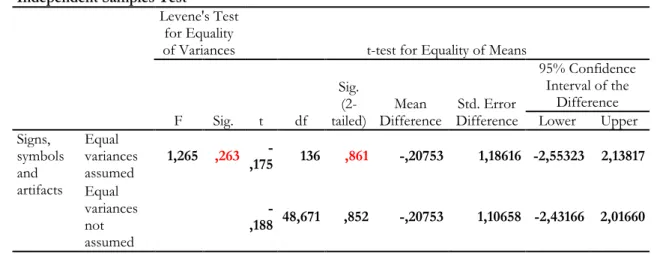
Table 13. T-test – monthly disposable income and ‘signs, symbols and artifacts’ ...36
Table 14. T-test – monthly disposable income and ‘behaviour’ ...36
Table 15. One-way ANOVA – monthly disposable income and the statement ‘How often do you visit ICA MAXI?’ ...37
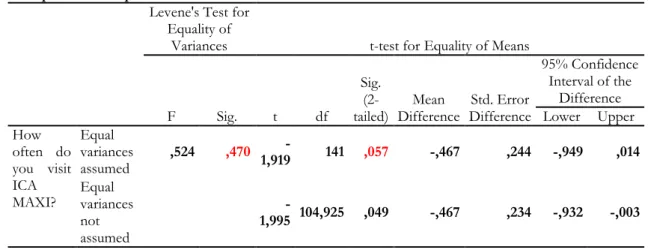
Table 16. One-way ANOVA – age and the statement ‘How often do you visit ICA MAXI?’37 Table 17. T-test – age and the statement ‘How often do you visit ICA MAXI?’ ...38
Table 18. One-way ANOVA – age and the statement ‘I would prefer if ICA MAXI would play music’ ...38
Table 19. KMO and Bartlett’s Test ...39
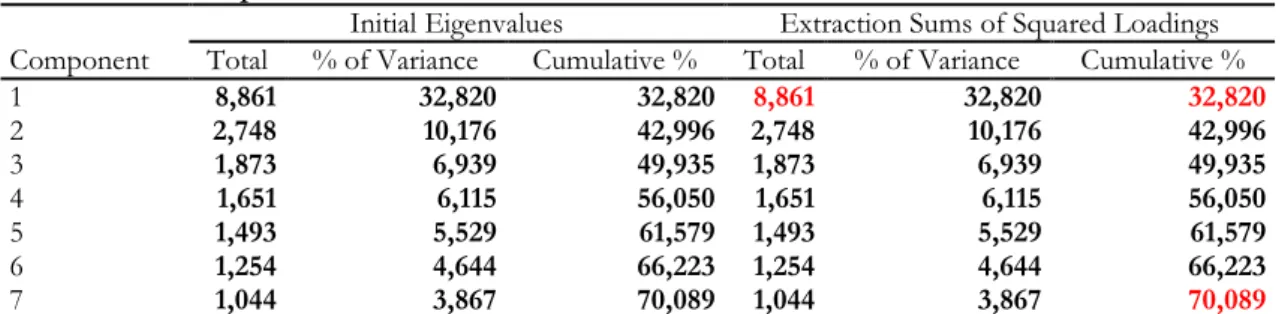
Table 20. Eigenvalues ...39
Table 21. Rotated Component Matrix ...40
Table 22. Factors retained ...40
Table 23. Cronbach’s Alphas for all factors ...41
Table 24. Multiple regression – variables entered ...43
Table 25. Multiple regression - correlations ...43
Table 26. Coefficient – multiple regression ...44
Table 27. Multiple regression – R and R square ...44
Table 28. Multiple regression - ANOVA ...44
Appendices
Appendix 1 – Tables ...58
Table A. 1. Item-Total Statistics – ‘ambient conditions’...57
Table A. 2. Item-Total Statistics – ‘space/function’...57
Table A. 3. Item-Total Statistics – ‘signs, symbols and artifacts’ ...58
Table A. 4. Item-Total Statistics – ‘behaviour’ ...58
Table A. 5. Item-Total Statistics – all factors ...58
Table A. 6. T-test – gender and ‘ambient conditions’ ...59
Table A. 7. T-test – gender and ‘space/function’ ...60
Table A. 8. T-test – gender and ‘signs, symbols and artifacts’ ...60
Table A. 9. T-test – gender and ‘behaviour’ ...60
Table A. 10. T-test – gender and ‘behaviour’ (detail information) ...61
Table A. 11. T-test – gender and the statement ‘How often do you visit ICA MAXI?’ ...62
Table A. 12. T-test – nationality and all factors ...62
Table A. 13. T-test – nationality and the statement ‘How often do you visit ICA MAXI?’ ..63
Table A. 14. One-way ANOVA – age and ‘ambient conditions’ (detail information) ...63
Table A. 15. One-way ANOVA – age and ‘space/function’ (detail information) ...63
Table A. 16. One-way ANOVA – age and ‘space/function’ (detail information) ...64
Table A. 17. One-way ANOVA – age and ‘space/function’ (detail information) ...64
Table A. 18. One-way ANOVA – age and ‘signs, symbols and artifacts’ (detail information)66 Table A. 19. One-way ANOVA – age and ‘signs, symbols and artifacts’ (detail information)66 Table A. 20. One-way ANOVA – age and ‘signs, symbols and artifacts’ (detail information)66 Table A. 21. One-way ANOVA – age and ‘behaviour’ (more details) ...68
Table A. 22. One-way ANOVA – age and ‘behaviour’ (more details) ...68
Table A. 23. One-way ANOVA – age and ‘behaviour’ (more details) ...68
Table A. 24. One-way ANOVA – monthly disposable income and ‘signs, symbols and artifacts’ and ‘behaviour’ ...70
Table A. 25. One-way ANOVA – monthly disposable income and ‘signs, symbols and artifacts’ (detail information)...71
Table A. 26. One-way ANOVA – monthly disposable income and ‘signs, symbols and artifacts’ (detail information)...71
Table A. 27. One-way ANOVA – monthly disposable income and ‘behaviour’ ...72
.Table A. 28. One-way ANOVA – monthly disposable income and ‘signs, symbols and artifacts’ ...72
Table A. 29. One-way ANOVA – monthly disposable income and the statement ‘How often do you visit ICA MAXI?’ (detail information) ...73
Table A. 30. One-way ANOVA – age and the statement ‘How often do you visit ICA MAXI?’ (detail information) ...73
Table A. 31. One-way ANOVA – age and the statement ‘I would prefer if ICA MAXI would play music’ (detail information) ...74
Table A. 32. Eigenvalues – Factor analysis ...74
Appendix 2 - Questionnaires...75
In Swedish (a paper version)...75
1
Introduction
This chapter aims at giving the reader an overview of the paper. Short background information and the problem are presented. Furthermore, the purpose of the thesis as well as the research questions are discussed. Finally, delimitations and definitions end the chapter.
1.1
Background
The global food and beverage sector, which includes farming, food production, distribution, retail and catering, in 2008 was valued at $5,7 trillion. Hence, it can be said that this industry is one of the main contributors to growth of all economies. The forecast for 2014 is an increase of 3,5 per cent to reach a value of $7 trillion. The largest share in the global food and beverage industry is Europe where generated revenues reached $1,4 trillion in 2007, and over 4 million workers were employed (IMAP, 2010).
The retail food industry in 2008 was valued at $3,9 trillion. It is expected to increase 4,8 per cent between the years 2008 and 2013 to reach a value of $5 trillion. Hypermarkets, supermarkets, and discounters contributed 48,8 per cent of total revenues (IMAP, 2010). Based on this fact, it can be concluded that the food and beverage sector as well as the retail food industry have a big growing potential in the near future.
When it comes to the Swedish retail food industry, it cannot be characterized by a low degree of internationalization since in 1999 Dutch giant Ahold took over 50 per cent interest in the ICA group. Subsequently, successive consolidations occurred which resulted in a Nordic, rather than domestic, focus to marketing (USDA Foreign Agricultural Service, 2010).
The Swedish food retail industry grew by 2,2 per cent in 2009 to reach a value of $30,6 billion. The forecast for 2014 is an increase of 7,5 per cent since 2009, to reach a value of $32,9 billion. What is more, 64,8 per cent of the industry’s overall value of the Swedish food retail industry (which is $19,8 billion) is generated by hypermarkets, supermarkets, and discounters sales (Dataminor, 2010). Therefore, it can be said that the Swedish food retail industry follows the same trend as the worldwide food industry. Graph 1 presents the Swedish food retail industry segmentation in details.
Graph 1. The food industry segmentation - Sweden
Source: Dataminor. (2010). Food Retail in Sweden (reference code 0181-2058) [Brochure].
The Swedish food retail market is the most concentrated market in Europe, and is dominated by chains of either hypermarkets or supermarkets. The three most powerful groupings have 86 per cent of a total market share. While the six largest chains are taken into account, the total market share increases to 98 per cent. The strongest chain is the ICA group which has almost half of the market share. However, a worldwide expansion trend of hard discount stores can be noticed as well in Sweden. The first hard discount store in Sweden – Danish Netto was introduced in 2002, followed by German Lidl in 2003. Graph 2 shows the Swedish retail market in details.
Graph 2. Retail Food Market in Sweden
Source: Gullstrand, J., & Jörgensen, Ch. (2011). Local Price Competition: The Case of Swedish Food Retailers [Working Paper].
Over the last decades the retail food industry has undergone changes. Fierce competition as well as technological change have had a significant influence on the current shape of the industry. Supermarkets have transformed from small, independently owned establishments
64,8% 16,7%
16,6%
0,5% 0,3% 1,1%
The food retail industry segmentation
Hypermarkets, Supermarkets & Discounters
Convenience Stores & Gas Stations
Food and Drinks Specialists Drug Stores & Health and Beauty Stores
Cash & Carries & Warehouse Clubs Other 49% 20% 16% 8% 3% 2% 2%
Retail Food Market in Sweden
ICA Group Coop Axfood Bergendahls Lidl Netto Other
to large, administratively centralized chains (Davis, Freedman, Lane, McCall, Nestoriak & Park, 2009).
According to the Food Marketing Institute in 2010 the total supermarket sales was $562 746 billion. In 36 149 supermarkets ($2 million or more in annual sales) 3,4 million employees were employed (FMI Facts). The above mentioned figures confirm that supermarkets have become a crucial entity in the entire economy due to the considerable number of employees and immense sales value that power the economy.
Supermarkets are not just buildings filled with products on the shelves. The supermarket consists as well of a certain atmosphere inside the store. There are many factors such as noise, lighting, music, colour, layout or visual communication that can be taken into consideration in order to build an environment as customer-friendly as possible. Since the suitable environment of the supermarket can influence customers to spend more time inside the store, this can lead to an increased number of items bought. Therefore, many marketers are trying to adapt supermarkets’ interiors to increase customer satisfaction, loyalty, and by doing so, to increase the sales volume.
1.2
Problem
Wysocki (1979) claims that retailers can manipulate the atmosphere of the supermarket by creating a particular layout (Eroglu & Machleit, 1990; Wakefield & Blodgett, 1994; Ang & Leong, 1997; Lin, 2004; Countryman & Jang, 2006; Ballantine, Jack & Parsons, 2010), lightning (Birren, 1969; Taylor & Sucov, 1974; Areni & Kim, 1994; Countryman & Jang, 2006; Quartier, Christiaans & Van Cleempoel, 2008), colour (Bellizzi & Hite, 1992; Valdez & Mehrabian, 1994; Babin, Hardesty & Suter, 2003; Yildirim, Akalin-Baskaya & Hidayetoglu, 2007; Ballantine et al., 2010), and music (Yalch and Spangenberg, 1988; Yalch & Spangenberg, 1990; Yalch & Spangenberg, 1993; Herrington & Capella, 1996; Oakes, 2000; Mattila & Wirtz, 2001; Ballantine et al., 2010; Jain & Bagdare, 2011; Morrison, Gan, Dubelaar & Oppewal, 2011). According to Vida, Obadia and Kunz (2007) the atmosphere of the supermarket also consists of smells (Morrison et al., 2011), physical environment, sales promotions, shelf space, food sample stations, and visual communication (Davis, 1984; Wener, 1985; Bitner, 1992; Ang & Leoing, 1997). These determinants can influence both customers’ emotions and their behaviour in the supermarket. According to Kotler (1973), designing an efficient buying environment in order to invoke specific emotional effects, may result in enhancing the chance of a purchase. Additionally, Hansen and Deutscher (1977) state that shopping hours, parking access, prices, services or product diversification are objective variables of the atmosphere of the store.
Many studies have been conducted in relation to the effect of the store environment and customers’ behaviour, however only a few of them were made among customers in Sweden. Taken into consideration the fact that the choice of the supermarket might precede brand choice and that many buying decision are made in the retail store, the lack of attention in both environmental psychology and marketing is surprising. For instance, the biggest supermarket chain in Sweden, the ICA group, does not play background music in their stores. However, researchers (such as Yalch & Spangenberg, 1990; Oakes, 2000; Ballantine et al., 2010) found out that background music results in customers’ interest as well as arousal. In addition, according to Yalch and Spangenberg (1990), people tend to spend more time in the supermarket when background music is played. Thus, the environment of the supermarket has big potential to be a powerful and an effective
marketing tool if marketers would better understand how to utilize it. Since marketers and retailers want their customers to spend more time in the supermarket, it is necessary to create a relaxed and comfortable environment. What is more, the environmental factors are considered to be crucial elements that determine success for the marketers. Even if one has not been in a particular supermarket, one’s first impression may have a great influence on buying intentions (Nguyen & Leblanc, 2002). Moreover, since buying decisions made in the supermarket can be influenced by the environmental factors, retailers and marketers should take as much advantage as possible (Converse & Spencer, 1942).
The authors discovered plethora of studies upon the environmental factors and its affect on customers’ behaviour, which were conducted in various countries worldwide. However, not many studies concerned customers in Sweden. Since the lack of studies within this field in Sweden is surprising, the authors decided to examine the perception of the customers in Sweden towards the environmental factors in the supermarket.
1.3
Purpose
Retailers spend large amounts of money every year to build, design and refurbish stores. However, so far marketers are not engaged in systematic research that enables them to inspect the appropriate mix of the environmental factors that affect customers’ behaviour in supermarkets (Baker, Levy & Grewal, 1992). Thus, this paper extends the current literature review with the express purpose of providing results of quantitative research that can be utilized by marketers to understand which and how environmental factors influence customers’ behaviour in the supermarket.
Moreover, the Mehrabian and Russell (1974) Stimulus-Organism-Response model, which helps to understand how different environmental factors influence customers’ behaviour in the supermarket, is going to be examined. Furthermore, another model that is going to be applied is the Bitner’s (1992) framework of servicescapes. This model has been used extensively in various studies, since it presents a framework of understanding the environment and behaviour relationships. The factors going to be examined are ambient (music, lightening, colour, noise), space/function (layout, equipment, furnishing) and signs,
symbols and artifacts (visual communication such as: signage, personal artifacts) (Zeithmal,
Bitner & Gremler, 2009).
The paper will focus on the strongest supermarket chain in Sweden – the ICA group, in precise ICA MAXI in Jönköping. The authors decided to conduct the study among ICA MAXI customers in Jönköping, since it is the largest supermarket of the ICA group in this city.
1.4
Research questions
Based on the problem discussion and in order to fulfil the thesis purpose, the authors formulated the following research questions:
1. What is the role of the perceived servicescape in the supermarket?
2. How does the perceived servicescape influence customers’ behaviour in the supermarket?
1.5
Delimitations
This paper presents a literature review on the environmental factors that influence customers’ behaviour only in supermarkets. The paper will analyse customers of the ICA group, since this supermarket chain has almost 50 per cent of the market share in Sweden. Other retailing stores will not be taken into consideration. Precisely, the empirical research is going to be conducted among ICA MAXI customers in Jönköping, Sweden. The role of the perceived servicescape that influences customers’ behaviour in the supermarket is going to be presented. Moreover, the way it influences the customers’ behaviour is going to be examined. Since this paper will focus only on customers’ perspective, the way employees respond to the environment is not going to be taken into account. Based on the Bitner’s (1992) framework of servicescapes, only ‘ambient conditions’, ‘space/function’ and ‘signs, symbols
and artifacts’ factors are going to be examined upon this study.
1.6
Definitions
Axfood AB (Axfood) is a retailer and wholesaler of food products in Sweden. Axfood sells food products through both its subsidiaries and a collaboration of 650 proprietor-run stores (Dataminor, 2010).
Coop Norden oversees the operation of approximately 1 100 discount stores, supermarkets,
and hypermarkets throughout the Nordic region (Dataminor, 2010).
Food retail market can be defined as the retail sales of all products, packed and unpacked, as
well as beverages (Dataminor, 2010).
Grocery store is “a retail store that sells a variety of products, including some perishable items
and general merchandise” (FMI Glossary).
Hypermarket is defined as “a combined supermarket and discount store, at least 200 000
square feet (18 580,6 square meters) or larger, that sells a wide variety of food and general merchandise at a low price” (FMI Glossary).
ICA AB (ICA) is a Sweden based retail group that operates chain grocery stores in Sweden, Norway, and Latvia. The company is a joint venture group (Hakon Invest and Royal Ahold of the Netherlands) (Dataminor, 2010).
Lidl (Lidl & Schwarz Stiftung) operates a chain of 6 800 grocery stores throughout Europe
(in Germany it operates 3 100 stores). Main products in the stores are mostly under Lidl’s own brand. Lidl expanded to Denmark, Sweden, Hungary, Norway, Poland, and Slovenia (Dataminor, 2010).
Perceived servicescape upon this paper includes such factors as music, noise, lightening, colour,
visual communication (signage, personal artifacts), and layout, equipment and furnishing.
Servicescape is “the physical surroundings of a service company. It includes the exterior and
interior design, ambient conditions such as temperature, noise, odour, as well as tangible parts of the service such as business cards, brochures, and other communication material” (Reimer & Kuehn, 2005, p. 786).
Supermarket is “a conventional grocery store, but not a warehouse club or mass merchant,
with annual sales of $2 million or more per store” (FMI).
Visual communication consists of such elements as name, logo, retail identity, institutional
signage, directional signage, departmental signage, category signage, POS signage, and lifestyle graphics situated in the supermarket. Visual communication program includes “a range of messages, from large and bold directives, used sparingly to provide cues to the gross organization of the space, to the smaller, more specific, and plentiful messages that describe actual merchandise” (Dunne & Lusch, 2008, p. 461).
2
Literature Review
The second chapter presents the theoretical framework that the method as well as the analysis are based on. The literature review contains the Mehrabian and Russell (1974) Stimulus-Organism-Response model and the Bitner’s (1992) framework of servicescapes with the description and a role of ‘ambient conditions’, ‘space-function’ and ‘signs, symbols and artifacts’ factors.
The Mehrabian and Russell (1974) Stimulus-Organism-Response model (the M-R model) states that individuals respond emotionally to various environmental stimuli. The stimulus factors are physical features and can be described as store layout, colour, lightning, music, noise, sales promotions, shelf spacing, etc. According to the authors of this theory, an emotional response leads to an ‘approach – avoidance’ behaviour which includes “emotional evaluations of the environment, evaluations of the service experience, long-term patronage decisions, attitudes toward others in the environment, spending behaviour, shopping time and exploration of the environment” (Herrington & Capella, 1996, p. 27). Emotional states that are induced by the physical environment are pleasure and arousal. Pleasure refers to the degree where individual feels good, happy or satisfied in the environment. Arousal refers to the extent to which an individual feels stimulated, excited or active. Approach behaviour refers to the extent to which an individual is free to act or willingness to move such as propensity to buy (Baker et al., 1992). Avoidance behaviour, conversely, can be seen as a desire to leave the environment (Tombs & McColl-Kennedy, 2003). ‘Approach – avoidance’ behaviour will be described in more details further in sequence – while analyzing individual behaviours in the Bitner’s (1992) framework of servicescapes (paragraph 2.4).
2.1
Servicescapes
Customers quite often rely on physical evidence or tangible cues in order to evaluate a company or services provided before the purchase. General elements of the physical evidence consist of company’s physical facility or, so called, the servicescape and other forms of tangible communication. The servicescape elements that influence customers include facility exterior design (e.g. signage, parking, surrounding environment, landscape) and facility interior design (e.g. layout, equipment, signage, music and lighting) (Zeithaml et al., 2009).
According to Zeithaml et al. (2009) the servicescape has an effect on the customer’s experience. It does not matter whether experience is mundane (e.g. bus ride), spectacular
(e.g. long adventure) or personally meaningful (e.g. child birth in a hospital), in all cases, the servicescape will affect the flow of the experience that leads to customers’ satisfaction and their emotional connection with the company delivering that experience. That is why, many companies rely on the servicescape in order to communicate and create customers’ experiences.
Many articles offer various terms to define the servicescape. For example, Baker (1987) refers to the servicescape as “physical environment”, Turley and Milliman (2000) as “marketing environment”, Roy and Tai (2003) as “store environment” (Harris & Ezeh, 2008, p. 392). These different definitions have been used in the literature for many years. However, this paper will focus on the Bitner’s (1992) definition of the servicescape that refers to a design of physical environment which elicits internal reactions from customers such as approach or avoidance (cited in Harris & Ezeh, 2008, p. 392).
Retailers want customers to spend a lot of time in supermarkets. In such cases, while shopping, customers also explore physical surroundings of the store. It goes without saying that the perceived quality of the servicescape is playing a substantial role in affecting whether customers are satisfied, which influences how long they stay in the supermarket. For example, while doing shopping, customers observe the layout as well as interior design of the supermarket, which might influence how long they are willing to stay in the store and if they return (Wakefield & Blodgett, 1996).
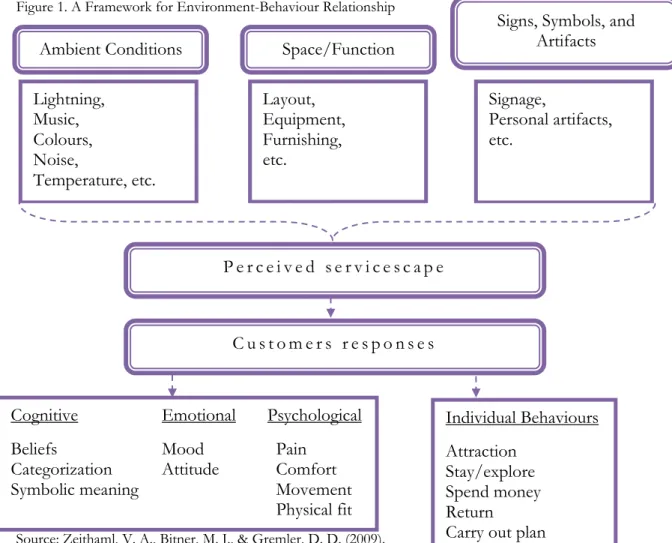
Figure 1. A Framework for Environment-Behaviour Relationship
Source: Zeithaml, V. A., Bitner, M. J., & Gremler, D. D. (2009). Services Marketing. Integrating Customer Focus Across the Firm (5th ed.).
Ambient Conditions Space/Function
Signs, Symbols, and Artifacts Lightning, Music, Colours, Noise, Temperature, etc. Layout, Equipment, Furnishing, etc. Signage, Personal artifacts, etc. P e r c e i v e d s e r v i c e s c a p e C u s t o m e r s r e s p o n s e s
Cognitive Emotional Psychological Beliefs Mood Pain
Categorization Attitude Comfort
Symbolic meaning Movement
Physical fit Individual Behaviours Attraction Stay/explore Spend money Return
The Bitner’s (1992) servicescapes model is one of the most extensively used typologies of the service environment and its affect (Tombs & McColl-Kennedy, 2003). The framework (see Figure 1) explains how different environmental factors influence internal responses and external behaviours of customers. It suggests that various environmental factors are perceived by customers and they may respond cognitively, emotionally or physiologically. Internal responses influence customers’ behaviour and can be explained by the Mehrabian and Russell (1974) Stimulus-Organism-Response model (Bitner, 1992). Below, each part of the framework is going to be described.
2.2
Dimensions of the perceived servicescape
Bitner (1992) classifies three dimensions of the physical environment that influence customers’ holistic perception of the environment (e.g. perceived quality) and their internal responses (e.g. satisfaction with the environment) as well as external responses (e.g. approach-avoidance). Those dimensions are: (1) ambient conditions, (2) space/function, (3) signs,
symbols and artifacts.
In this study ‘Ambient conditions’ consist of such factors as noise, lighting, music and colour. They influence the way people think, feel and respond to the particular factors. Spatial layout
and functionality consist of factors such as layout, equipment, furnishings, and play an
important role since, generally speaking, a main function of supermarkets is to accomplish exact purposes and needs of customers. Layout refers to how the equipment is placed, and functionality refers to how easy it is to navigate in the supermarket. According to Zeithaml et al. (2009) layout may influence customers’ satisfaction, their searching behaviour as well as the supermarket performance. Finally, ‘signs, symbols and artifacts’ provide cues for customers and can be used as labels, for directional purposes and to inform about the behaviour in the supermarket.
2.2.1 Ambient conditions
a) Music
When it comes to music, three dimensions can be taken into consideration, namely: (1) physical dimension, which consists of volume (loudness), pitch (succession of notes occurring overtime throughout a song), tempo (speed or rate of the rhythm), rhythm (pattern of accents given to beats or notes), (2) an emotional tone, and (3) the degree to which a customer likes the background music – a preferential dimension (Mattila & Wirtz, 2001; Jain & Bagdare, 2011). Various researchers tackled music played in the retail store in relation to the influence on a customer, however, the results of their studies are mixed. In a study conducted by Ballantine et al. (2010), the authors find that medium volume music with well spaced sound sources has the desired result in increasing interest as well as arousal. Moreover, they state that music can also have a negative effect on customers when it is not used correctly. It is shown by Smith and Curnow (1966) that loud music causes that customers spend less time in the store. Additionally, d’Astous (2000) claims that loud music is irritating (cited in Ballantine et al., 2010). Furthermore, slow tempo and low volume make retail patrons shop and spend more money in comparison with fast tempo and high volume music (Herrington & Capella, 1996).
Yalch and Spangenberg (1990) show that shoppers spent more time in the store than they planned while background music was played (cited in Morrison et al., 2011). Additionally, Yalch and Spangenberg (1993) show that customers can spend more money when the music closely matches their musical tastes (cited in Herrington & Capella, 1996). The Morrison et al. (2011) study shows that music and aroma influence on both customers’ arousal by increasing pleasure levels, and customers’ behaviour – money and time spend in the store, satisfaction as well as approach behaviour.
Other studies have confirmed that the influence of music can differ when it comes to a customer’s age. Yalch and Spangenberg (1988) claim that younger customers perceived that they had shopped longer when instrumental easy-listening (background music) was played, whereas elder customers thought that they had spent more time shopping when foreground music was played (Top 40). Therefore, the authors state that unfamiliar music may have adversely impact on customers’ time perception (cited in Mattila & Wirtz, 2001). Moreover, according to Linsen (1975) people like hearing music while shopping as they feel that the store with background music care about their shoppers. Furthermore, they can feel that time spend while shopping as well as in the checkout queue is shorter (cited in Herrington & Capella, 1996).
Music is able to evoke behavioural and affective responses in customers. Milliman (1982; 1986) shows that in order to create pleasurable atmosphere in the store, background music should be smoothing (cited in Baker et al., 1992). In addition, the result of one of his experiment confirms that while slow tempo music is played in the retail store, customers spend more money. The other experiment conducted in the restaurant environment shows that customers spend more time on consuming food while slow tempo music than in the fast-music condition (cited in Mattila & Wirtz, 2001).
Jain and Bagdare (2011) find that pleasurable shopping experience brings desired customer responses: (1) cognitive (e.g. spending, expectations, perceptions of time), and (2) behavioural (e.g. patronage, recommendations, speed or purchase decisions). Moreover, music effect on shopping experience is moderated by the store profile, customer profile, ambient factors as well as time of purchase.
Oakes (2000) provides an extension of the Bitner’s (1992) model of servicescapes, namely musicscape. This framework focuses only on one of the ambient conditions – the musical variable. Unlike the servicescape, musicscape examines only customers response and behaviour in the certain environment.
b) Noise
Noise, or loudness of a sound can be seen very annoying and irritating among customers. Kryter (1985) presents two components of loudness such as amplitude or height of sound waves and frequency of sound waves. Too much noise is associated with negative stimulation. Moreover, Kryter (1985) states that too much noise can lead to irritability, decreased concentration or tension. Conversely, silence can be also seen very problematic (cited in Lin, 2004).
c) Lightning
The first studies upon lightning in the retail environment confirm that customers are drawn towards light (Taylor & Sucov, 1974). Other studies show that light can draw attention to
products. Moreover, bright light causes products to be examined and touched more often than under dim lightning. Therefore, following Magnum (1998), lightning seems to emphasise the attractiveness of a product in the store (cited in Quartier et al., 2008). Additionally, Mehrabian and Russell’s (1974) study present that individuals are attracted by light sources. According to Baker et al. (1994), and Sharma and Stafford (2000), soft incandescent lighting is associated with a higher quality environment, whereas bright fluorescent lighting gives a discount image. In addition, researches present that people tend to be more positive and have lower levels of boredom in places with windows, in comparison to places without windows. Moreover, Areni and Kim (1993) claim that brighter stores encourage to analyze products more, but do not affect time spend in the store and sales (cited in Countryman & Jang, 2006).
The influence of lightning in terms of its ability to arouse customers was investigated by Mehrabian (1976). He states, that on the one hand, an individual who is aroused, becomes stimulated and alert. On the other hand, a person can feel relaxed, calm or even sleepy in non-arousing environments. Moreover, in the first case, the aroused person will exhibit “increased heart rate, muscle tension, and lowered skin temperature” (Areni & Kim, 1994, p.118). According to Birren (1969), really bright light is recommended in order to stimulate purchases. Retail shop managers are recommended to employ soft lightning to reduce customer stimulation (such as arousal), and thus, slow the pace at which they move in the store. Therefore, managers can manipulate lightning in order to influence the time that customers spend while shopping (cited in Areni & Kim, 1994).
d) Colour
According to Ballantine et al. (2010), limited colour pallet has a stronger impact on customer than a wide range of colours. Furthermore, using many colours at once may cause low effectiveness at highlighting displays.
Colour can influence customer’s evaluation-related affect – affective tone as well as activation-related affect – arousal. Valdez and Mehrabian (1994) claim that blue (short wavelength, ‘cool-coloured’) environments are perceived to evoke better feelings than orange (long wavelength, ‘warm-coloured’) environments (cited in Babin et al., 2003; Yildirim et al., 2007). Thus, it can be concluded that interiors painted in ‘cool’ colours will evoke more positive effects in customers, which may result in increase purchase decisions. Stone’s experiments (2003) show that stimulating colours which can interact with other in-store factors are red colours, and blue colours are calming colours. Additionally, Canter (1974) mentions that red colours make things seem nearer and blue colours make them farther away (cited in Yildirim et al., 2007). Moreover, warm colours are associated with higher blood pressure, eyeblink frequency and respiratory rate (Gerard, 1957), inaccurate judgements of length, size (Goldstein, 1939), time (Smets, 1969), as well as speed of movement (Nakshian, 1964). Emotionally, red colours are associated with elated mood states (Schaie & Heiss, 1964), and arousal (Cahoon, 1969). Cool colours have been found to have the opposite effects. When it comes to the retail store, colours are used mainly to draw customers’ attention. Based on Bellizzi et al. (1983) study, warm colours environments draw customers’ attention, however, customers find warm colour environments as unpleasant, tense, negative as well as less attractive than cool colour environments (cited in Bellizzi & Hite, 1992).
2.2.2 Signs, symbols and artifacts
a) Visual communication (Signage, personal artifacts)
Items in the physical environment may serve either explicit or implicit signals in order to communicate about the place to its users. Among explicit communicators, signs displayed on the exterior and interior of a structure can be found. For example, labels such as the name of the company or department, signs for directional purposes (such as entrances or exits) as well as signs which communicate behaviour or rules (e.g. no smoking) (Bitner, 1992).
Davis (1984) and Wener (1985) find this dimension as very complex since it includes numerous items in the environment that give different signals. Wener and Kaminoff (1982), and Nelson-Schulman (1984) state that different signs decrease perceived crowding and stress. Bitner (1992) claims that signs, symbols and artifacts affect approach behaviour (cited in Ang & Leoing, 1997).
2.2.3 Space/function conditions
a) Layout, equipment and furnishing
When it comes to the spatial layout, one of the most important attribute is the effect of crowding. According to Eroglu and Machleit (1990) and Wakefield and Blodgett (1994), the spatial layout should minimize crowding that leads to a positive impression among customers (cited in Countryman & Jang, 2006). Empirical researches conducted by Harrell and Hutt (1976) and Hui and Bateson (1990 – 1991) find out that when layout is crowded, customers experience stress (cited in Ang & Leong, 1997). The furniture placement in the supermarket should assign to spatial movement, function as walls or communicate as boundaries. For instance, changes in ceiling heights can influence spatial perception more than changing the place of furnishings. According to Ching (1996), high ceilings are associated with a feeling of spaciousness while low ceilings convey feelings of cosiness and intimacy (cited in Lin, 2004).
The width of the aisle is another in-store factor that has an impact on the customer. Large open spaces encourage customers to wandering around and make them more comfortable. However, too little or too much space has a negative outcome (Ballantine et al., 2010). Following Thang and Tan (2003), decorations as well as display of merchandise, ease of movement in the store or layout have an important affect on the store preference (cited in Ballantine et al., 2010).
When it comes to layout, the main task is to guide the customer throughout the store, thus it fails to be recognized as a positive attractor cue (Ballantine et al., 2010).
Product display features in connection with other factors such as space, colour or lightning can draw the customers’ attention. If the spacing of merchandises in a display is too small, then products seem to be cluttered and cause a negative impact on customers (Ballantine et al., 2010).
2.2.4 Connected stimuli
Since the customer does not perceive only one cue (only colours or music) in the store, a combination of factors has a greater influence on a shopper. For example, the combination of fluorescent, bright lights and popular background music is perceived by the customers as a discount image, on the other hand soft lights and classical background music are associated with a prestige image and customers are aware to expect higher prices in this store. Studies suggest that bright light in connection with warm colours create a discount store concept (Babin et al., 2003). Moreover, low-image stores are perceived to have grid layout, uncooperative as well as sloppily dressed salespeople. High-image stores, on the other hand have the opposite features – cooperative and nicely dressed sales people and open layout (Grewal & Baker, 1994).
2.3
Internal responses: cognitive, emotional and physiological
According to the Bitner’s (1992) framework of servicescapes, customers respond to the environment either cognitively, emotionally or physiologically. Perceptions of the servicescape might lead to a certain beliefs or emotions that influence individuals’ behaviour. Thus, cognitive, emotional and physiological responses will be presented independently.2.3.1 Cognition and environment
The perceived servicescape might cause cognitive responses that have an effect on people’s beliefs about a place and products found in that place. According to Broadbent, Bunt and Jencks (1980) and Rapoport (1982), the servicescape can be seen as a part of nonverbal communication (cited in Bitner, 1992). For instance, specific cues in the environment such as interior design or decor may influence customers’ beliefs whether the store is expensive or successful. Bitner (1990) in a customer study finds out that decor in travel agent’s office influences customers’ attribution for the travel agent’s behaviour (cited in Bitner, 1992). What is more, the perception of the servicescape helps customers to distinguish companies by the way it is categorized. Research shows that in the restaurant industry, customers distinguish them according to ‘fast food’ or ‘elegant’ restaurants (Zeithaml et al., 2009). In relation to the field of this paper, it can be said that customers classify supermarkets for example into those that have relatively high prices and variety of products, offer great customer service and those that have comparatively lower prices and low diversification of products.
2.3.2 Emotion and environment
In addition to cognitive responses, the perceived servicescape can also elicit emotional responses (Zeithaml et al., 2009). For example, when being in a particular place, one can feel happy and relaxed, whereas other places can make one depressed or gloomy. Therefore, the environmental factors such as music, colours, lighting, decor may have a very powerful and unexplainable influence on customers’ moods in the particular place. Environmental psychologists Mehrabian and Russell (1974) classify emotional responses to environment into two dimensions such as pleasure/displeasure and degree of arousal (cited in Bitner, 1992). For example, places that cause feeling of pleasure are ones where people spend more time and money, while unpleasant places are usually avoided. Likewise, an arousing environment is seen positively, unless the excitement is connected with
unpleasantness. Moreover, unpleasant places that are high in arousal such as too noisy or confusing are usually avoided as well (Bitner, 1992). According to Obermiller and Bitner’s studies, people who buy products in emotionally pleasant environment evaluate products more positively (cited in Bitner, 1992).
2.3.3 Physiology and environment
The perceived servicescape can elicit physiological responses as well. Too much noise or inappropriate temperature in the place may cause physical discomfort, the quality of the air can result in a difficulty to breathe, low lighting might decrease ability to see products and refer to eyes’ pain. All physical responses may influence customers’ behaviour whether they stay and enjoy the environment of the store (Zeithaml et al., 2009).
2.3.4 Variations in internal responses
As it was explained above, people respond to the environment in three ways – cognitive, emotional and physiological – and those responses affect the way people behave in the particular place. However, it should be also taken into consideration that not all individuals act the same way. Cultural and personality differences, temporary conditions such as the purpose for being in the store or mood can result in variations, or in other words, how people respond to the servicescape (Zeithaml et al., 2009).
Arousal seeking is one personality trait that influences how people respond to the servicescape. Usually, arousal seekers take pleasure in and look for high levels of stimulation, while other people rather choose lower levels of stimulation and are arousal avoiders. In addition, the purpose for being in the particular environment can also influence customers. Of course, when it comes to supermarkets, it goes without saying that people do shopping there. However, some individuals may come just to buy milk or bread, whereas others can spend hours and enjoy the shopping. A person who is in the supermarket for a couple of minutes, probably will be less affected by the environment. Finally, cultural differences may also affect customers’ responses in the particular environment. For instance, in China there is a strong cultural preference for a red colour. However, Western countries would not use this colour in that extent. Moreover, Americans prefer to shop in more quiet and orderly supermarkets, while Indians like more chaotic environment (Zeithaml et al., 2009).
2.4
Individual behaviours
According to environmental physiologists Mehrabian and Russell (1974), there are two forms of individual’s behaviour: (1) approach and (2) avoidance. In this section, approach – avoidance behaviour will be described more precisely.
2.4.1 The M-R Stimulus-Organism-Response model
The Stimulus-Organism-Response (S-O-R) paradigm relates features of the environment (S) to approach-avoidance behaviour (R) in the environment. There are two assumptions in this model: (1) persons’ emotions and feelings determine what they do as well as how they do it, and (2) persons respond with various sets of emotions to a certain environment and
respond either by approach or avoid the environment (Tai & Fung, 1997; Ward, Davies & Kooijman, 2007).
The Mehrabian and Russell’s (1974) model has been widely used by various researchers (e.g. Donovan & Rossiter, 1982; Donovan, Rossiter, Marcoolyn & Nesdale, 1994; Tai & Fung, 1997; Foxall, 1997; Ward et al., 2007; Kenhove & Desrumaux, 1997; Spangenberg, Sprott, Grohmann & Tracy, 2006; Kearney, Kennedy & Coughlan, 2007).
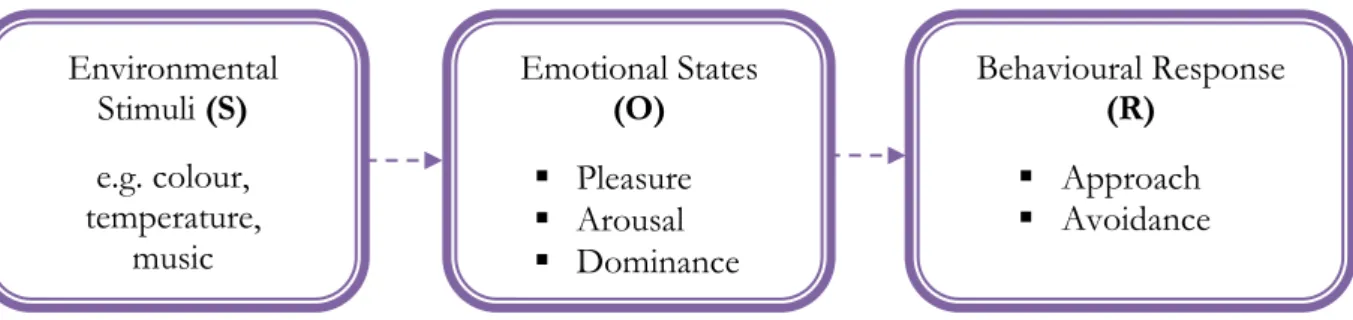
Mehrabian and Russell (1974) adopted a Stimulus-Organism-Response (S-O-R) approach (see Figure 2). This model proposes a measure of the environment (S) in terms of “information rate – a measure of novelty and complexity” (Donovan et al., 1994, p. 284).
Figure 2. The Mehrabian and Russell (1974) model
Source: Tombs, A., & McColl-Kennedy, J. (2003). Social-servicescape conceptual model. Marketing Theory, Vol. 3, No. 4, p. 447-475.
Figure 2 shows that environmental stimuli (S) have an effect on customer behaviour (R) by organism (O) which is mediated by the customers’ internal state (Quartier, Vanrie & Cleempoel, n.d.). In other words, environmental factors are said to have an influence on emotional states (O) – pleasure, arousal and dominance. The emotional states component has an influence on the (R) factor, namely on the approach-avoidance behaviour (Kearney et al., 2007). All components are presented in more details below.
2.4.2 Environmental stimulus (S)
Stimuli can be defined as those determinants that have an influence on an individual’s internal states (Chang, Eckman & Yan, 2011). Store image and atmosphere components can be describe by using environmental stimuli such as design, odours, music, colours, or layout (Dennis & Newman, 2005). However, it is worth to mention, that it is not effortlessly to measure the stimuli factors, since in the certain environment there are many stimuli involved (Tai & Fung, 1997).
2.4.3 Emotional states (O)
Organism refers to “internal processes and structures intervening between stimuli external to the person and the final actions, reactions, or responses emitted” (Chang et al., 2011, p. 235). According to the M-R model, there are three emotional states (PAD). Pleasure refers to “the extent to which a person feels good, joyful, happy or satisfied in the environment”. The term arousal relates to “the extent to which a person feels excited or stimulated, alert
Environmental Stimuli (S) e.g. colour, temperature, music Emotional States (O) Pleasure Arousal Dominance Behavioural Response (R) Approach Avoidance
or active in a situation” (Tai & Fung, 1997, p. 317). Based on this model, it can be said that every environment determines different emotional states in the individual.
In the Mehrabian and Russell’s (1974) study, pleasure was measured by respondents’ verbal evaluation of their responses to environment as following (Soriano, Foxall & Pearson, 2001): Happy → Unhappy, Pleased → Annoyed, Satisfied → Unsatisfied, Contented → Melancholic, Hopeful → Despairing, Relaxed → Bored.
Arousal was indicated by respondents’ feelings of being (Soriano, Foxall & Pearson, 2001): Stimulated → Relaxed, Excited → Calm, Frenzied → Sluggish, Jittery → Dull, Wide-awake → Sleepy, Aroused → Unaroused.
Dominance was verbally assessed as the extent to which respondents report feeling (Soriano, Foxall & Pearson, 2001):
Controlling → Controlled, Influential → Influenced, In control → Cared-for, Important → Awed, Dominant → Submissive, Autonomous → Guided.
Mehrabian and Russell (1974) state that (1) pleasure could be crucially related to approach-avoidance behavioural measures, (2) arousal could be negatively related in unpleasant environments and positively related in pleasant environments, and (3) dominance could be positively related to approach behaviour. However, the dominance dimension state has been deleted in subsequent studies based on the M-R model since there is a lack of empirical support (Tai & Fung, 1997; Sweeney & Wyber, 2002).
Based on Donovan and Rossiter (1982) findings, pleasure is a significant factor of approach-avoidance behaviour when it comes to the store. Pleasure may result for example in spending more than anticipated (Sweeney & Wyber, 2002). Baker et al. (1992) claim that both pleasure and arousal have a positive impact on the willingness to buy (cited in Sweeney & Wyber, 2002). An example when arousal might be evoked is using fast tempo music, additionally customers can feel pleasure while observing pleasant video images (Dennis & Newman, 2005).
2.4.4 Behaviour responses (R)
Responses are the final results of the process and represent the final customers’ decisions (Chang et al., 2011). Responses can be divided into two types: (1) approach, and (2) avoidance behaviour. More precisely, a customers response is the extent to which customers either approach or avoid perceived stimuli. As far as shopping behaviour is concerned, approach can be measured for example by (1) spending, (2) time in a store, (3) intention to revisit, or (4) prices number of items bought (Dennis & Newman, 2005).
2.4.5 Studies based on the M-R model
The first who applied the Mehrabian and Russell (1974) model to the retail store environment were Donovan and Rossiter (1982). According to Kearney et al. (2007) this study made a significant contribution to the literature as the relationship between behavioural intentions, emotional states and the store environment have been established. Donovan and Rossiter’s (1982) study shows that only two dimensions, namely pleasure and arousal, are able to predict customers’ behaviour in the retail store (Mattila & Wirtz, 2001). Table 1 presents response taxonomy in Donovan and Rossiter’s (1982) study in the retail environment.
Table 1. Donovan and Rossiter’s (1982) study
Approach Avoidance Relation
The desire to physically stay
in the environment The desire to leave the environment Store patronage intentions The willingness to explore
the environment Tendency inanimate to with remain the surroundings
The degree of in-store searching and the range of merchandise to which the customer allows themselves to be exposed The desire to communicate
with others in the store Tendency to avoid any interaction with others The interaction with the sales staff and other customers The degree of enhancement
that the environment gives to solving problems
The degree of hindrance that the environment gives to solving problems
Satisfaction and repeat shopping frequency, as well as the amount of time and money spent in the store
Source: Tombs, A., & McColl-Kennedy, J. (2003). Social-servicescape conceptual model. Marketing Theory, Vol. 3, No. 4, p. 447-475.
When it comes to an arousal state, studies present different results. According to Sherman, Mathur and Smith (1997), arousal increases spending and purchases intentions. Interestingly, Milliman’s (1982) research shows that arousal has the opposite effect and Smith and Curnow (1966) do not find any effect. Moreover, Sherman et al. state that arousal increases also visit duration, on the other hand Smith and Curnow (1966) find the opposite. In Donovan and Rossiter’s (1982) study conducted in the retail stores, it is confirmed that arousal has a positive effect on dependent variables in the pleasant environment in the retail store. However, Donovan’s (1994) research in discount stores does not confirm this relationship (cited in Kaltcheva & Weitz, 2006). Thus, it can be concluded that pleasantness has a positive effect on customers’ buying behaviour, however, the impact of arousal differ across studies.
3
Methodology
The third chapter aims to describe the chosen method – quantitative research. Relevant theories, used as the framework for the method, are provided in order to gain a deeper understanding of the chosen research method. Therefore, secondary and primary data collection, non-probability sampling technique and data analysis are presented. Moreover, the population is defined and the structure of the questionnaire is provided. Finally, validity and reliability of the research are discussed.
3.1
The research design
According to Green and Tull (1970), a research design is the specification of methods and procedures for acquiring the information needed. It is the over-all operational pattern or a framework of the project that stipulates what information is to be collected from which source by what procedures (cited in Beri, 2008, p. 61). Malhotra and Birks (2007) describe the research design as a framework or blueprint for conducting a marketing research project. The research design specifies which procedures are necessary to be carried out in order to solve a research problem. It indicates precise details and the practical aspects of implementing approach to a problem. In simple words, the research design can be described as a work plan. The plan which identifies what has to be done in order to solve the research problem. The function of the research design is to ensure that the evidence obtained enables us to answer the initial question as unambiguously as possible (Vaus, 2005, p. 9). A good research design guarantees an effective and efficient research project. In addition, it gives a direction for a researcher and creates so-called time table. The time table ensures that different procedures will be completed within a certain time limit.
3.2
Quantitative research method
According to Creswell (1994), a quantitative research is an explanation of a phenomenon by gathering numerical data and analyzing it based on mathematical methods. Creswell’s definition basically states that numerical data is collected in the quantitative research and can be analyzed by using statistics (cited in Sukamolson, n.d.). The main purpose of the quantitative research is to come up with objective and valid descriptions of the phenomenon.
In the thesis, the quantitative method was chosen, since it is used to explain some kind of phenomenon. In relation to the purpose of this thesis, the phenomenon is – what is the role of the perceived servicescape that affect customers’ behaviour in the supermarket? What is more, the quantitative research method is widely used while examining customers’ attitudes and opinions. Since the authors wanted to investigate customers’ perception of the servicescape in ICA MAXI, the quantitative research method was justified to be used in this study. Additionally, one of the main advantages of using quantitative research is its clarity, since numbers can be easier to understand and interpret in comparison with hundreds of coding categories. Moreover, quantitative studies are usually designed around the use of measures where validity and reliability have been already established (Taylor, 2005).
3.3
Descriptive research
Descriptive research is used to draw a picture of the topic and describe characteristics of the phenomenon. In other words, it describes and interprets the present (Taylor, 2005). Descriptive research can be also used to investigate and solve many current problems which may occur in a company (e.g. a decrease in sales). Solutions of those problems can be very useful for the directions in the future as well as relevant information how to reach designated goals. Usually descriptive research gives an adequate description of the phenomenon that supposed to be studied (Taylor, 2005). Descriptive research is mainly used when specific research questions or hypotheses are formulated. Additionally, it is a pre-planned and structured research (Malhotra & Birks, 2007).
3.4
The target population
A population is elements which share several common set of characteristics. In order to obtain primary data, the population should be precisely defined, as imprecise definition of the population can result in an ineffective as well as misleading research (Malhotra & Birks, 2007).
In this research, the target population was customers of ICA MAXI in Jönköping, Sweden. More precisely, the population consisted of female and male ICA MAXI customers aged from 18 years old. The authors did not make distinction when it comes to nationalities, as the main objective of this research was to examine the role of the perceived servicescape that can influence customers’ behaviour regardless of cultural differences. Since the questionnaire was available in both English and Swedish versions, all ICA MAXI customers could be potential respondents.
3.5
Sampling technique
The research was a cross-sectional study, which means it involved the collection of information from any given sample of population elements only once. The cross-sectional study is one of the most often used descriptive design in marketing research.
There are two sampling techniques: probability and non-probability techniques. In probability techniques units are selected by chance. In this technique, it is possible to specify the probability of selecting a particular sample of a given size. The second techniques is non-probability sampling. This sampling technique relies on the personal judgment of the researcher more than on the chance to select sample elements. Among non-probability techniques Malhotra and Birks (2007) enumerate: (1) convenience sampling, (2) judgemental sampling, (3) quota sampling, and (4) snowball sampling.
In this research, two non-probability sampling were used, a judgemental and a snowballing sampling in precise. In the judgemental sampling, the units were selected based on the researchers’ judgement about which units would be the most suitable, useful or representative in the research. In the snowball sampling, initial respondents who possess the desired characteristic of the target population were selected. After filling in the questionnaire, they were asked to send the link to the questionnaire to people who might also have the desired characteristic. Therefore, subsequent respondents were selected based on the referrals (Babbie, 2007). When it comes to personal interviewing, the judgemental
sampling was used, whereas the snowball sampling was implemented as a method of collecting the responses via electronic collection.
3.6
Data collection
In the thesis, both primary and secondary data were retrieved. According to Malhotra and Birks (2007), primary data is data collected by a researcher for a specific purpose of addressing the research problem at hand. Moreover, primary data is used when available secondary data is insufficient to fulfil the scientific research purpose (Ghauri & Grønhaug, 1995). Primary data in comparison with secondary data is more expensive to obtain and more time-consuming while collecting as well as analyzing (Malhotra & Birks, 2007). Secondary data is data collected for purposes other than the research problem at hand. It is used not only in order to find information to solve the research problem but as well as to understand and explain the problem (Ghauri & Grønhaug, 1995). Secondary data used in this paper was external data. The authors gathered the theoretical framework found in books, journal articles, online databases etc.
Since the authors attempted to examine the role of the perceived servicescape in the supermarket, more precisely in ICA MAXI in Jönköping, and the approach was conducted from customers’ perspective, obtaining primary data required interaction with ICA MAXI customers.
Primary data was collected based on a survey, a structured questionnaire, created by means of Qualtrics. As the authors of this paper decided to conduct both personal interviews and electronic collection, non-probability sampling techniques described above seem to be justified. When it comes to personal interviews, street interviews were used. The responses from ICA MAXI customers in Jönköping were collected by the authors in the middle of April 2012. The second technique that was conducted was electronic collection. The Qualtrics link was mailed via the Internet, and shared in social media tool, Facebook in precise. In order to ensure that the right people participated in the survey, a filter question was asked.
In order to obtain more answers from Swedish respondents, the authors decided to collect data using both versions of the questionnaire among ICA MAXI customers – Swedish and English. Collecting data via personal interviews does not require an advanced level of the language as in the other methods such as focus groups or depth interviews. Since the authors do not speak Swedish fluently, the questionnaire was translated into Swedish by Swedish speaking persons. The questionnaire was created in both languages, as the authors assume that younger generations have a satisfactory knowledge of English language and it is easier for them to fill in the questionnaire via Qualtrics link, whereas elder customers might feel more comfortable while filling in the printed version of the questionnaire translated into Swedish.
The authors decided to collect a total sample size of at least 100 responses from ICA MAXI customers, from both personal and electronic collection. The number of responses was also conditioned by the recommended number of answers while conducting factor analysis in SPSS.