Solidification Study of Gray Cast Iron in a Resistance Furnace
Rubén Lora
1, a, Attila Diószegi
1,bLennart Elmquist
1,c1
Jonkoping University, School of Engineering, Materials and Manufacturing - Castings, PO Box 1026, SE-551 11 Jonkoping, Sweden.
a
Ruben.Lora@jth.hj.se, bAttila.Dioszegi@jth.hj.se, cLennart.Elmquist@jth.hj.se
Keywords: Gray cast iron, interrupted solidification, primary grains, thermal analysis, DAAS.
Abstract. Solidification of hypoeutectic gray cast iron has been investigated in a resistance furnace. A cylindrical shaped sample with three thermocouples, two inside and one in the surrounding, was solidified and compared to samples quenched at different stages during the solidification interval. An additional sample in the series has been produced to reveal the primary grain structure using Direct Austempering After Solidification (DAAS) treatment. The present paper collect for the first time under the same experimental procedure the solidification of a hypoeutectic gray cast iron where both the growth of the primary and eutectic phase are observed. An increase of the secondary dendrite arm spacing (SDAS) was observed until the end of the solidification interval. A comparison of the measured solidified fractions of the phases with those predicted using Fourier Thermal Analyses evidenced the quenching effectiveness. The eutectic cell size is in agreement with the literature. The method presents good consistency.
Introduction
The metallographic structure, soundness and consequently the properties and service performance of castings depend on their solidification behavior. During the solidification of hypoeutectic gray cast iron, two main events can be differentiated, the precipitation of the primary phase and the eutectic phase [1-4].
The primary phase begins at the liquidus temperature with the nucleation of austenite that grows in the form of dendrites, who develop and form the solidification units named primary grains or crystals [1,5,6]. Nucleation of the crystals takes place at the mold wall and in the inner melt originating the columnar and equiaxed grains respectively. Each grain is composed of one dendrite and has the same crystallographic orientation all over [6,7]. The dendrites grow mainly in extension until they collide or impinge with each other producing a solid network that work as the skeleton of the material. After this point coarsening is the main growth mechanism [1,8].
During the dendritic growth, segregation modifies the composition of the interdendritic melt. When the eutectic composition is reached, carbon precipitates as graphite and the eutectic solidification starts [1]. The dendritic growth is still present during part of the eutectic solidification in such a way that their temperature intervals overlap [5]. The eutectic solidification unit is the eutectic cell (EC), which is formed through a cooperative growth of austenite and graphite [1,2,6]. The eutectic cells overgrow and envelope the dendritic network. Their volumetric growth cease when coherence is achieved between cells. During the growth of the eutectic phase the graphite flake morphology characteristic of gray iron is defined.
In the current work the development of a method that combines interrupted solidification, natural solidification, DAAS treatment, different etching techniques and Fourier Thermal Analysis (FTA) to study the solidification of hypoeutectic gray cast iron is described. The method permits the characterization and quantification of the primary phase in terms of the primary grain structure, evolution of secondary dendrite arm spacing (SDAS) and evolution of solid fraction of primary austenite. The eutectic phase is characterized and quantified in terms of the development of eutectic cells size and number of eutectic cells. The method provides a good scenario for the relation of all these parameters.
All rights reserved. No part of contents of this paper may be reproduced or transmitted in any form or by any means without the written permission of TTP, www.ttp.net. (ID: 193.11.5.30-22/11/10,19:03:25)
Material
An industrial grade hypoeutectic gray iron melt was produced with a chemical composition as shown in Table 1. Cylindrical samples of ø50x100mm were cast in sand molds. This base geometry was then machined and re-melted to produce 400g cylindrical samples of ø42x42mm.
Table 1. Average chemical composition of the used material.
Element C Si Mn P S Cr Mo CE
Wt% 3.31 1.89 0.64 0.018 0.073 0.140 0.214 3.956
Experimental Equipment
Re-melting was done in a vertical tube programmable resistance furnace. The top and bottom of the chamber were closed and water-cooled. Argon gas was introduced from the top to produce a neutral atmosphere. The material was placed in a Al2O3 crucible supported by a graphite rod. The
bottom lid could be remotely removed to allow the sample to fall into the quenching media.
The sample for thermal analysis was equipped with one thermocouple (TC) at the center (Central TC), one at the inner crucible wall (Wall TC) and one at the outer crucible wall (Outer TC). The three TC were held in place from the top lid. All TC were type S (Pt / Pt+10%Rh). A 2-holes alumina tube was used to isolate the TC wires from each other leaving the soldering point exposed. The TC assembly was placed inside a protective glass tube which was the one in direct contact with the melt. The cooling curves were logged simultaneously by a commercial data acquisition system at a sampling rate of 75 Ss-1 and a resolution of 24 bits. Figure 1 illustrates the furnace setup.
Experimental Procedure
The experimental material was re-melted by a heating cycle of 90 minutes from room temperature to 1475°C. After a holding time of 30 minutes, the furnace was switched off. This process was performed in eight samples. One for thermal analysis (referred to as “As-Cast”), six for quenching (A-F) and one for DAAS treatment. The DAAS and quenching samples did not include thermocouples, instead the cooling curve obtained from the Central TC of the As-Cast sample was used as reference for the six quenching positions and for the DAAS shake-out. The As-Cast sample was left to cool down to room temperature under the natural cooling conditions of the furnace. For quenching, the samples were dropped directly from the furnace into a flowing salt-water media. The DAAS treatment was done by removing the sample from the furnace at about 980°C, transferring it to a furnace held at 900°C, kept there for 30 minutes and then austempered in a molten salt bath held at 360°C for 90 minutes [6].
Sample Investigation, Image Analysis and Measuring Techniques
Size, weight and volume of all samples were collected and the density calculated. All samples were cut, polished and, except for the DAAS sample, color etched with a reagent consisting of 10g NaOH, 40g KOH, 10g picric acid and 50ml distilled water at 110°C for an average of 2 minutes.
The DAAS sample was etched with a solution having 100ml ethanol and 4g picric acid (Picral 4%) to reveal the grained primary structure.
Quantitative measurements were carried out on the fraction of solidified primary austenite (fγ), Secondary Dendrite Arm Spacing (SDAS), number of primary grains, eutectic cells (EC) size and number of EC. Measurements were performed in both the columnar and the equiaxed zone. Both zones were divided in ten different segments, see Figure 2. Twenty pictures per measurement variable were taken.
FTA was used to calculate the fraction of solid and the release of latent heat of solidification. From this calculation the fγ at every quenching position
was also obtained. The FTA allows the use of two thermocouples only if the temperature field is symmetric [9,10]. Therefore, a commercial simulation software was used to design a sample geometry that could generate a symmetric thermal field in our experimental setup having the hotspot fixed in the geometrical center of the sample. The thermocouple data used for the analysis was collected from the Central TC and the Wall TC. Such data refer to the equiaxed zone.
To quantify the fγ of each sample, first the corresponding pictures were edited in a commercial pixel based image software to have the primary austenite on the picture painted in a solid color and the rest painted in a color contrasting with that of the austenite. Then, the pictures were loaded in a commercial image analysis software and the percentage of colored austenite area in all pictures was measured. The average of the results from the pictures in the equiaxed zone correspond to the reported fγ of the sample.
The SDAS is measured in each of the corresponding pictures using an image analysis software where a vector is drawn from the center of a secondary arm to the center of another non consecutive secondary arm that belongs to the same primary arm. The vector is drawn parallel to the primary arm. The length of the vector is then divided by the number of secondary arms that it touches minus one, considering that it only cover half of the first and last secondary arms. The reported results are the average of the measurements in the equiaxed zone.
To obtain the number of primary crystals, pictures of the etched DAAS sample were taken keeping the position of the camera and the sample fixed and varying the orientation of the light source in every shot to get the reflections of all grains. The individual contributions of the pictures were assembled, the columnar to equiaxed transition (CET) identified and the grains counted.
The EC size (size understood as diameter) in the equiaxed zone was measured by drawing three vectors per eutectic cell rotated about 60° between each other, passing through the center and covering the maximum width of the cell on each direction. Only cells completely inside the picture were considered. The average of all measurements is the EC size reported for the sample.
For the acquisition of the number of EC, partially overlapping micrographs were taken over the whole cross section of the sample. The pictures were then assembled together in a commercial software where all EC in the equiaxed zone were counted.
The reported density of equiaxed EC and equiaxed γ' grains per unit volume (see Table 2) were calculated by Eq.1 and Eq.2 respectively:
.
(1)
.
(2)
Results and Discussion
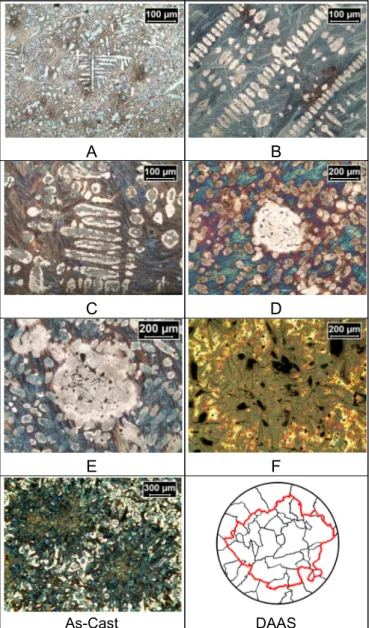
The quenching position A (see Figure 3, Bottom) was chosen to investigate the pre-coherence state of the growth of the primary phase. Quenching positions B and C were selected to study the changes experienced in the primary structure after coherence of the columnar and equiaxed grains (where CET is defined). The coherence point was identified at the maximum temperature difference during primary solidification between the Central TC and the Wall TC according to [11]. Results from samples A, B and C show not only an increase in fraction of austenite (fγ) but also an increase in SDAS, see Table 2.
The quenching position D corresponds to the maximum undercooling of the eutectic phase, were initial nucleation of eutectic cells is expected. Quenching position E was selected at the point of maximum recalescence of the eutectic and position F was chosen at the end of solidification. In samples D, E and F the variations in fγ and SDAS during the eutectic phase and the changes in EC size towards the final condition observed in the As-Cast sample were studied.
The calculated fγ corresponds to the equiaxed zone due to the nature of the FTA method and the position of the thermocouples chosen for the analysis. Therefore the results presented for the measured fγ are also from the equiaxed zone. Measurements of fγ in the columnar zone were collected for future use with the intention of comparing them with results from a FTA that would try to predict the columnar zone by involving the Outer TC in the calculation. The measured fγ reached a maximum at the beginning of the eutectic nucleation (sample D) and then remained approximately constant, which is in line with the predictions of the FTA, see Figure 3. More quenching positions would be necessary to examine the growth of the primary phase during the overlapping of the primary and the eutectic solidification ranges.
The measured and calculated fγ are consistent, however differences between them were observed, see Table 2 and Figure 3. This differences could illustrate the efficiency of a quenching that allows some further growth during quenching conditions before completely stopping the solidification. This extra fγ measured would also require an extra level of undercooling which could have been facilitated by the quenching process.
Table 2. Results of experiments. All results correspond to the equiaxed zone.
Sample Time [s] Calc. fγ [%] Measured fγ [%] SDAS [µM] EC Size [µM] No. EC [m-3] No. γ' grains [m-3] A 999 2.47 11.97 17.99 - - - B 1079 11.01 33.95 24.79 - - - C 1160 18.73 36.12 32.35 - - - D 1343 32.25 41.31 41.67 479.87 - - E 1455 32.25 40.98 43.34 709.91 - - F 1874 32.25 36.69 53.58 1284.71 - - DAAS 2276 - - - 1.310E7 AS-CAST - 32.25 38.94 54.88 1586.28 4.008E8
A consistent increase of SDAS was observed until the end of solidification, see Figure 4. This could be the result of a coarsening that not only consist in the thickening of the dendrite cross section but also in the re-melting of the dendrite arms due to instabilities in the liquid-metal interface [12]. A process that could happen continuously during the whole solidification interval.
The eutectic cell size increased during the whole eutectic solidification range, which express good consistency of the experiment. These results are in agreement with other findings in the literature [13,14].
Characterization of the macrostructure was possible by means of DAAS treatment. The CET was identified and the number of and equiaxed grains obtained. A columnar zone thickness of 7,8mm was measured. The number of EC per unit volume is in the range of those presented in the literature [13,14]. A lower value than those in the literature was expected since our material is un-inoculated and re-melted.
Fig. 3. Bottom; Cooling curves from the as-cast sample and quenching positions. Top; Measured fraction of solid and calculated fraction of solid and latent heat release
from the Fourier Thermal Analysis.
Summary
Consistent results were obtained in terms of SDAS, eutectic cells size and measured fraction of primary austenite from the interrupted solidification experiments. The macrostructure was successfully characterized by means of DAAS treatment. The Fourier Thermal Analysis was implemented for the calculation of solid fraction and release of latent heat. Future work should be considered to use this method to study several cooling rates and to more deeply relate the identified variables.
Acknowledgements
References
[1] L. Elmquist: Factors Influencing the
formation of Shrinkage Porosity in Grey Cast Iron. Licentiate Thesis. Göteborg,
Sweden: Chalmers University of Technology, 2008. pp. 1, 8-11, 24-26. [2] P. Beeley: Foundry Technology, 2nd ed.
Oxford: Butterworth-Heinemann, 2001, ISBN: 0-7506-4567-9, pp. 1, 51-69.
[3] D.M. Stefanescu et al: Cast Iron, ASM Handbook, Volume 15, ASM International, 1998, pp. 168-176.
[4] L. Elmquist, A. Diószegi: Influence of
Solidification on the Primary Austenite Structure of grey Cast Iron, Research
Report 2008:1, ISSN 1404-0018, Sweden: Jönköping University, 2008.
[5] R.H. Heine, C.R. Looper: On Dendrites
and Eutectic Cells in Grey Iron, Modern
Casting, vol. 56, no. 4, Madison: University of Wisconsin, 1969, pp. 185-191.
[6] G.L. Rivera, R.E. Boeri, J.A. Sikora:
Solidification of Gray Cast Iron, National
University of Mar de Plata, Argentina, 2003.
[7] T.S. Piwonka: Casting, Metals Handbook, 2nd Ed., ASM International, 1998, pp. 727-730.
[8] I.L. Svensson et al: Component Casting
with Simulation, Jönköping University,
Jönkoping, Sweden, 2002, pp.1-4, 3 – 5-11.
[9] E. Fras, W. Kapturckiewicz, A. Burbielko, H.F. López: Numerical Simulation and Fourier
Thermal Analysis of Solidification Kinetics in High-Carbon Fe-C Alloys, Metallurgical and
Materials Transactions B, Volume 28B, 1997, pp. 116.
[10] A. Diószegi, I.L. Svensson: On the Problems of Thermal Analysis of Solidification, Material Science and Engineering A, Vol.413-414, 2005, pp. 474 – 479.
[11] Guocai Chai: Dendrite Coherency During Equiaxed Solidification In Aluminum Alloys, Doctoral Dissertation, Chemical Communications, Stockholm University, 1994. ISBN 91-7153-215-3, pp. 16-17.
[12] D. M. Stefanescu: Science and Engineering of Casting Solidification, Kluwer Academic/lenum Publishers, 2002, ISBN: 0-306-46750-X, pp. 176-177.
[13] A. Diószegi: Evaluation of eutectic growth in grey cast iron by means of inverse modelling. International Journal of Cast Metals Research, 2003, volume 16, pp. 301-306.
[14] A. Diószegi, K.Z. Liu and I.L. Svensson: Inoculation of Primary Austenite in Grey Cast Iron. International Journal of Cast Metals Research. Vol. 20, no. 2, 2007, pp. 68-72.
A B
C D
E F
As-Cast DAAS
Fig. 4. From A to As-Cast, micrographs from experiment. DAAS, macrostructure.