Master Thesis
HALMSTAD
UNIVERSITY
Master's programme in Renewable Energy System, 60
credits
Analysis of Simris Hybrid Energy System
Design and Working and Checking the Effect
of Using High Capacity Factor Wind Turbine
Dissertation in Engineering Energy, 15
credits
Halmstad 2019-06-03
Naem Akthar
i | P a g e
MASTER THESIS, 15 HP
Analysis of Simris Hybrid Energy System design and Working and
Checking the Effects of Using High Capacity Factor Wind Turbine
Author:
Supervisor:
Naeem Akhtar
Associate Professor Fredric Ottermo
Examiner: Jonny Hylander
Faculty of Engineering, University of Halmstad
ii | P a g e
Abstract
The world is entering the future where integration of renewable energy sources within the power grid will play an important role when facing the challenge of reducing global warming. The intermittent generation characteristics associate with renewable energy sources can be handled by the implementation of microgrids. A Microgrid is a group of energy source (e.g. wind, solar etc) that are located in the same local area that can operate independently in the event of electricity outage and can also be connected to the national grid in case of energy demand exceeds than the energy produced in the same local area. The implementation of microgrid in an electrical distribution system must be well planned to avoid problems. The EU has set high goals to reduce the non-renewable energy sources by 2030. EU has started some local energy systems (microgrids) and Simris is a part of it.
This study is about a microgrid project at Simris in the south-east of Sweden. The village of Simris has 140 households supplied by a wind turbine of rated power 500kW and a solar power plant of 440 kW rated power. This project is run by E. ON within the framework and collaboration of Interflux, in which several network operators within the EU participate to investigate flexibility options in
local energy systems.
The aim of this study is to find different scenarios in which the Simris microgrid can be run in islanded-mode. Four different scenarios were investigated, and simulation was done in MATLab. After simulation the results were discussed in the “Analysis and Results” section and the size of the wind turbine, the solar park (PV)and the battery were suggested for each of the scenarios. A short calculation was also included between the installation cost of the suggested wind turbine and the needed battery size. The cost of bat-tery is much higher than the cost of wind turbine, so its beneficial for the economy of the microgrid to have a wind turbine of 1000 kW rated power and battery size 35 MWh rather than using the same old wind turbine of 469 kW rated power and upgrade the battery to 462 MWh.
iii | P a g e
Sammanfattning
Världen går mot en framtid där integrationen av förnybara energikällor inom elnätet kommer att spela en viktig roll när vi står inför utmaningen att minska den globala uppvärmningen. Den intermittenta kraftgenereringen som vi associerar med förnybara energikällor kan hanteras genom implementering av mikronät. Ett Mikronät är en grupp av energikällor (t.ex. vind, sol osv) som ligger i samma lokala område, som kan fungera oberoende i händelse av elavbrott och även kan anslutas till det nationella nätet om energibehovet överstiger producerad energi i samma lokala område. Utformandet av mikronät i ett elektriskt distributionssystem måste vara väl planerat för att undvika problem. EU har satt höga mål för att minska de icke förnybara energikällorna fram till 2030. EU har startat upp några lokala energisystem (mikronät) och Simris är en del i detta.
Denna studie handlar om ett mikronätprojekt hos Simris i sydöstra Sverige. Byn Simris har 140 hushåll som försörjs av ett vindkraftverk med nominell effekt 500 kW och en solcellspark på 440 kW nominell effekt. Detta projekt drivs av E. ON inom ramen för, och i samarbete med, Interflux, där flera nätoperatörer inom EU deltar för att undersöka flexibilitetsalternativ i lokala energisystem.
Syftet med denna studie är att hitta olika scenarier där Simris mikronät kan köras i öläge. Fyra olika scenarier undersöktes och simuleringen gjordes i MATLab. Efter simulering diskuterades resultaten i avsnittet "Analys och resultat" och storleken på vindturbinen, solparken (PV) och batteriet föreslogs för var och en av scenarierna. En kort beräkning inkluderades också mellan installationskostnaden för den föreslagna vindturbinen och den nödvändiga batteristorleken. Kostnaden för batteriet är mycket högre än kostnaden för vindkraftverk, så det är fördelaktigt för mikronätets ekonomi att ha en vindturbin med 1000 kW nominell effekt och batteristorlek 35 MWh istället för att använda samma gamla vindturbin på 469 kW nominell effekt och uppgradera batteriet till 462 MWh.
iv | P a g e
Table of Contents
1) Introduction ………..…....…....………...1
2) Aim ………..3
3) Wind turbines……….…...……….….………4
2.1)
Power curves……….………...6
2.2)Power coefficient (C
p)………..………...….……….7
2.3)
Betz law……….……..………….………9
2.4)
Capacity factor………...………10
4) Methodology……….…………. 12
3.1) Technical data………...12
3.2) Scenarios……….………...……….15
3.2.1) Scenario 1……….……….………16 3.2.2) Scenario 2.……….….……….…...16 3.2.3) Scenario 3……….………...……….18 3.2.4) Scenario 4……….………...185) Analysis and Results
………...………..……...………196) Conclusions
………..………...………...281 | P a g e
1) Introduction
At the Paris climate conference in 2015 it was decided to take urgent actions on the international scale to restrict the global warming well below 2 °C. The main cause for global warming is the greenhouse gas emissions from the usage of conventional non-renewable fuels. These fuels are mostly used in transportations, industry and household applications like heating and cooking. For reducing the emission of the greenhouse gas and reducing the global warming certain actions have already been taken in the European Union for achieving the goals of cutting their emissions by 40% by 2030 (European Commission 2018). According to the International Energy Report in 2015, the two-thirds of the global greenhouse gas emission comes from the energy sector. The numbers provided in the report is suggesting about measures must be taken in the energy sector are crucial for achieving the aforementioned goals successfully (International Energy Agency (IEA). As a result, during the past years certain low-carbon energy production technologies have been developed and implemented. Also, International Energy Agency (IEA) have conducted some projections on the future energy scenarios and states that the conventional fossil fuels are continuously decreasing in favour of renewable energy sources. By 2040, the 40% of the total global primary energy demand will be fulfilled by renewable energy resources. Cost reduction and rapid deployment of the new technologies are the main reasons for achieving this goal. On comparing on the global scale, solar production technology is developing quite rapidly due to deployment in China and India, the second is the wind energy. It’s because in the EU the renewable energy production completely relies on wind energy (international Energy Agency 2018). According to Swedish Environmental Institute report 2011, until 2040 the bioenergy and hydropower energy will remain the dominating energy sources of the energy mix in Sweden but there will be largest increase in the wind power and solar power production sources (IVL Sweden Environmental Institute 2011). The goal for Swedish government is that by the year 2040 all the energy produced comes from the renewable energy sources.
By 2040 the global population will be increased from 7.4 billion to approximately to 9 billion and ultimately the energy demand will increase subsequently, and electricity will play an important role in fulfilling this energy demand. The total world-wide investments in electricity generation sources exceeded that of oil and gas for the first time during 2016, which verifies that there will be substantial transformation in the energy sector (International Energy Agency 2018). During the following years there will be significant increase in electricity generation from the renewable sources particularly from non-hydropower renewable sources like solar and wind sources. On a global scale the electricity generation from renewable energy sources is expected to exceed from that of coal by the year 2040. This increase in using renewables for electricity generation is due to the international environmental policies and the regulations to reduce greenhouse gas emissions. In the following years the expected annual rate of increase at 2.8% for renewable electricity generation in comparison to that of 0.4% for coal-based electricity generation (U.S. Energy Information Administration 2017).
In the International Energy Outlook 2017 (IEO2017) Reference case,
“total world energy consumption rises from 575 quadrillion British thermal units (Btu) in 2015 to 736 quadrillion Btu in 2040, an increase of 28%. Most of the world’s energy growth will occur in countries outside of the Organization for Economic Cooperation and Development (OECD), where strong, long-term economic growth drives increasing demand for energy. Non-OECD Asia (including China and India) alone accounts for more than half of the world’s total increase in energy consumption over the 2015 to 2040 projection period. By 2040, energy use in non-OECD Asia exceeds that of the entire OECD by 41 quadrillion Btu in the IEO2017 Reference case (Figure 1)”.
2 | P a g e Fig 1: World Energy Consumption by country grouping (7)
To realize the potential of renewable energy sources as distributed generation we must take a system approach which views generation and associated loads as subsystems or “microgrids” (2,9). A Microgrid is a group of energy source (e.g. wind, solar etc) that are located in the same local area that can operate independently in the event of electricity outage and can also be connected to the national grid in case of energy demand exceeds than the energy produced in the same local area. Microgrids usually consist of renewable power generation sources such as wind turbines and solar panels that is also accompanied by some sort of energy storage devices, invariably a battery or bank of batteries and a point of common coupling that can connect and disconnect the microgrid from the main grid (9,10). The microgrids are controlled locally by the community even though it can function by exporting energy to the national grid (3,4).
The benefits of microgrids have encouraged the government and the energy supplying companies around the world to take steps towards the development and implementations of microgrids (5). Similar is the case with microgrids in Sweden as many energy supplying companies are working on microgrids. The German energy supply company E.ON is currently working on impleme
3 | P a g e
nting a local microgrid as part of the project Interflex (E.ON Energidistribution 2018a). This is developed within the research and innovation programme, Horizon 2020, within EU. Projects implemented within the Interflex-context explore the operation of smart-grids and flexibility options, such as demand-side response, energy storage, smart-charging of vehicles, etc (European Commission 2017).
Fig 2: An example of Microgrid (26)
The above figure is an example of a microgrid, in which a wind turbine, load(houses) and battery are shown.
The E. ON has implemented one such microgrid project in a small village, Simris, in the very south of Sweden. This microgrid system consists of solar PV-panels, a wind turbine, a backup biodiesel generator and a battery storage system. This project was started in 2017 and has a 3 years’ probation period. As of now the Simris microgrid is dependent on the Swedish national grid for some percentage of the energy usage.
2) Aim
The aim of this project to suggest a suitable wind turbine and a battery system to make the Simris microgrid self-sufficient in energy production and storage and to run it in fully island mode and not to be dependent on the Swedish national grid for providing the electricity.
Suggestion and simulation of different scenarios in a simulation software called as MATLab were conducted. Analysing the simulation and suggest the best scenario for the Simris micro-grid to run in island mode. And give an idea about the cost of updating and installing wind turbine and battery.
4 | P a g e
3) Wind turbines
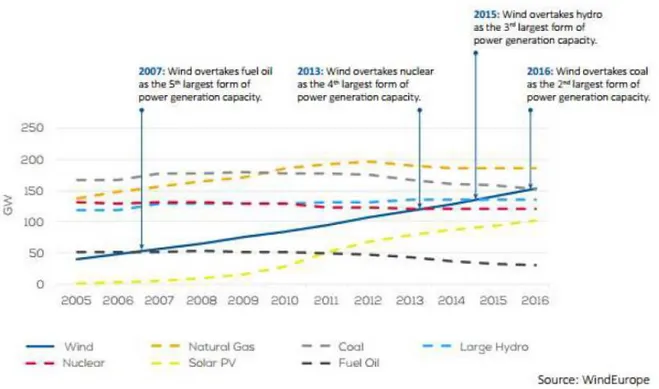
Wind power is one of the most important sustainable energy sources along with solar, hydro etc. This sustainable source has showed its development and commercial potential in the recent past years. As shown in the fig below, from 2005 to 2016, wind energy has surpassed hydro in 2015 and coal in 2016 to become the second largest form of power generation in Europe. According to the statistics, in 2016, wind energy fulfilled 10.4% of Europe’s electricity demand with approximately 300 TWh produced (WindEurope 2017) (11).
Fig 3: Cumulative power capacity in the EU 2005-2016 (11)
During the year 2016, the wind power that were installed in Europe was 13.9 GW and out of this amount around 12.5 GW were installed in the European Union (12). The details on wind power installed in the EU is given in the figure below:
5 | P a g e Fig 4: EU market shares for new wind energy capacity installed during 2016 (12)
A wind turbine or wind energy converter is a device that converts the kinetic energy of the wind to electrical energy.
Humans have been using wind turbine (wind mills) for about more than 4000 years. With the time passing there were technological advancements in wind turbines and the wind turbines became more efficient in producing power (12).
Wind turbines are of the following three general types:
1) Based on the orientation of axis of rotation into vertical or horizontal axis of rotation. 2) Based on the component of aerodynamic forces (lift or drag) that powers the wind turbine 3) Based on the capacity of electricity generation into micro, small, medium or large turbines.
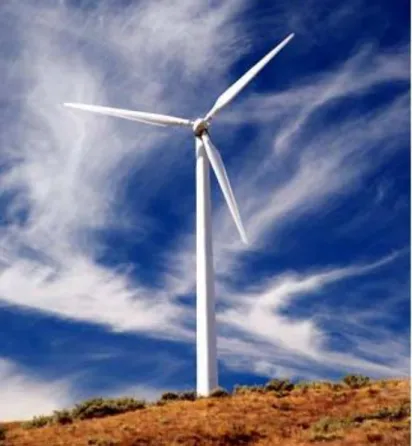
According to study related to comparison of different turbines, horizontal axis of rotation with three rotor blades are the most used wind turbines around the globe (13). A 3-bladed wind turbine is shown in the figure below:
6 | P a g e Fig 5: 3 bladed wind turbine (27)
2.1) Power curves
7 | P a g e From the figure above, we can get some general information regarding the Power output vs the wind speed. This information can be summarized as:
Cut-in speed: The lowest air speed at which the blades of the turbines start rotating and produce power. Rated output power: The maximum power that the turbine can produce.
Rated output speed: The air speed at which the turbine produces maximum power. Cut-out speed: The air speed at which the turbine stops producing power (17).
2.2) Power coefficient (C
p)
It is the measure of the wind turbine efficiency often used by the wind power industry. It is the actual power produced by the wind turbine to the total wind power flowing into the turbine blades at the specific wind speed (14)
C
p=
𝑃𝑜𝑤𝑒𝑟 𝑝𝑟𝑜𝑑𝑢𝑐𝑒𝑑 𝑏𝑦 𝑡ℎ𝑒 𝑤𝑖𝑛𝑑 𝑡𝑢𝑟𝑏𝑖𝑛𝑒𝑇𝑜𝑡𝑎𝑙 𝑤𝑖𝑛𝑑 𝑝𝑜𝑤𝑒𝑟 𝑓𝑙𝑜𝑤𝑖𝑛𝑔 𝑖𝑛𝑡𝑜 𝑡ℎ𝑒 𝑡𝑢𝑟𝑏𝑖𝑛𝑒 𝑏𝑙𝑎𝑑𝑒𝑠= 𝑃𝑜𝑢𝑡
𝑃𝑖𝑛
The power coefficient shows the combined efficiency of the various components of the wind power sys-tem includes, turbine blades, gear train, the generator, shaft bearings and the power electronics. The power coefficient is calculated or measured by the manufacturer and is usually specified at various wind speeds. The power output of a turbine can be calculated if the power coefficient of the turbine at a given wind speed is given. The operating conditions such as wind speed, turbine rotation speed, turbine blade angle and other parameters determines the power coefficient of the specific wind turbine. It is a measure of a particular wind turbine's overall system efficiency. The figure below shows how power coefficient varies with wind speed (4,17).
8 | P a g e Fig 7: Showing Power coefficient, Cp and Electric power against wind speed
The Power coefficient varies with the wind speed and it’s impossible to get it 1 or 100%. As it would mean that all the power (kinetic energy converted per unit time) is converted to electrical power. No electrical or mechanical losses and no wind is coming out of the down side of the turbine.
In the above figure the power coefficient and the power output of a specific turbine is shown against wind speeds. The power coefficient varies significantly with the wind speed and is maximum between the range of 8 m/s to 10 m/s of wind speeds (17).
The blue line shows the power output of the turbine as a function of wind speed. When the turbine reaches maximum power, which is about 2350 kW in this case, the power output becomes constant as shown in the graph. It is because the turbine blades are turned to keep them from spinning too fast that can damage the turbine blades. The blades are allowed to spin at a constant value by the turbine control system. At some point the blades are stopped due to safety and the power rapidly becomes zero, this maximum velocity is known as cut-out velocity. When the turbine reaches maximum power the power coefficient begins to fall off rapidly (19), it’s because the power output has to be kept constant while the wind power into the turbine is increasing rapidly. Power input into the turbine increases rapidly so for keeping the power output constant the power coefficient has to get smaller (17).
9 | P a g e The power into the turbine blades increases with the cube of the wind velocity. For capturing power above the maximum limit would just put too much stress on the wind turbine blades. The power coeffi-cient given by the manufacturer for the specific turbine are based on certain ideal or standardized condi-tions and is helpful in comparing with other turbines. In reality, the blades get dirty, formation on ice on them, their surface gets wear or damaged which changes the power coefficient of the turbine. The wind also changes the power coefficient of the turbine due to the capricious, gusty, changing direction and speed of it. All this means that turbines rarely operate at the exact power coefficient quoted by the man-ufacturer (17,18).
2.3) Betz law:
According to Betz law the maximum percentage of changing kinetic energy of the wind to mechanical energy by using wind turbine is 59.3 %. This is due to the wind on the back side of the rotor must have a high enough velocity to move away and allow more wind through the plane of the rotor. The ideal turbine will slow down the wind by 2/3, according to the Betz law.
The figure below shows the air going towards the turbine with speed “V” with cross-sectional area of “A1”
and after passing through the turbine the speed of air becomes “Vd” with cross-sectional area of “A2”.
After converting the wind’s kinetic energy into mechanical energy, it implies that Vd < V and A2 >A1.
For maximum energy taken from the wind then the ratio of the velocities of downstream and upstream should be 1/3 (15,21).
10 | P a g e
2.4) Capacity Factor:
It is the ratio of the actual power produced over a given period of time to the maximum possible power output over that period (19).
Capacity factor = 𝐴𝑐𝑡𝑢𝑎𝑙 𝑃𝑜𝑤𝑒𝑟 𝑃𝑟𝑜𝑑𝑢𝑐𝑒𝑑 𝑀𝑎𝑥𝑖𝑚𝑢𝑚 𝑝𝑜𝑠𝑠𝑖𝑏𝑙𝑒 𝑃𝑜𝑤𝑒𝑟 𝑂𝑢𝑡𝑝𝑢𝑡
The Danish wind form Horns Rev 2, that was inaugurated in 2009, has a total capacity of 209.3 MW. It has an average annual production of 875 GWh/year and a capacity factor of 47.7 %.
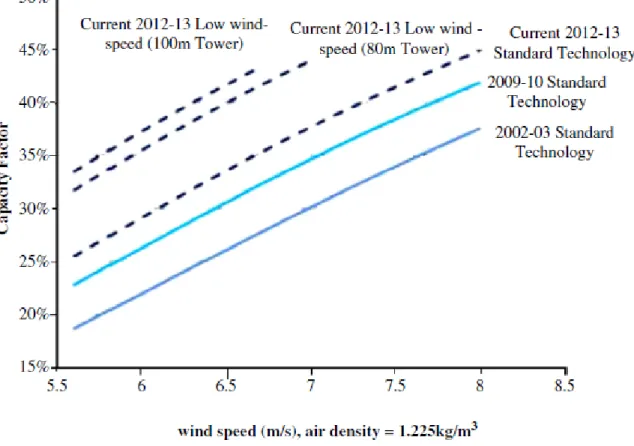
The higher the capacity factor the better the project. For wind turbines the capacity factor is variable due to the natural variability of the wind. The capacity factor is determined by the availability of wind, the swept area of the turbine and the size of the generator. The typical value of capacity factor for the wind turbine varies between 25 and 45%. The graph shown below shows the increase in capacity factor for wind turbines over time. (18,19)
11 | P a g e In the graph above the technological advancements in turbine changes the capacity factor of the turbines. In the year 2002-03 the maximum capacity factor that was possible was 35%, in the year 2009-10 about 40% was achieved. The swept area covered by the turbine rotors and the hub height of the wind turbine plays significant role in increasing the capacity factor of the wind turbines. The dashed lines shown are different wind turbines with different hub heights. All the turbines have the same rated power i-e 1.62 MW.
Table 1: Turbine type, hub height and rotor diameter
Turbine type Hub height (m) Rotor diameter (m)
Standard technology 80 82.5
Low wind speed 80 100
Low wind speed 100 100
All these turbines can reach the capacity factor of around 45% but at different wind speeds. It’s because the higher the hub height the faster it reaches to its maximum capacity factor and the bigger the rotor swept area the faster it reaches to its maximum capacity factor.
12 | P a g e
4) Methodology
3.1) Technical data:
The wind turbine installed at Simris has a rated power of 500 kW and its Enercon E-40/5.40. The two-year production of this wind turbine is 2763 MWh. The solar plant installed at Simris has a rated capacity of 440 kW and it produces around 938.86 MWh in the two years (E. ON Energidistribution 2018a). The battery installed is of capacity of 800 kWh. The data that was provided by the E-ON was for two years but there was missing data for 5 days which in total hours become 17400 hours. The yearly production and consumption of the grid can vary year to year. The table below shows the overview of the production and consumption in Simris.
Table 2: Simris: power production and consumption (E. ON Energidistribution 2018a)
Plant Rated Power 2 Year Production/Consumption Wind Power Plant 500 kW 2763 MWh
Solar Power Plant 440 kW 938.86 MWh
Consumption 3962 MWh
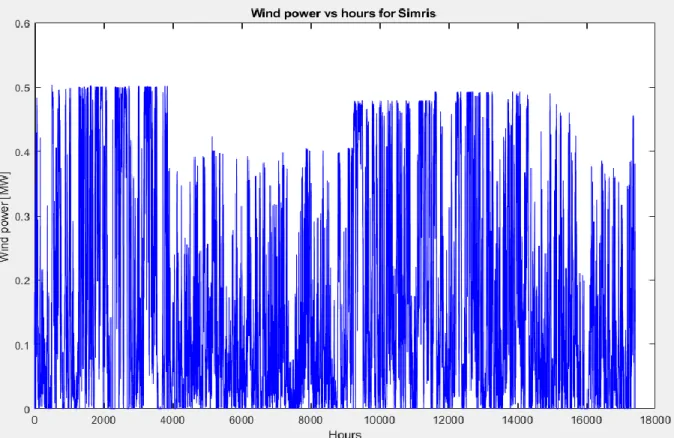
The power production from the wind turbine and the solar power plant over the period from 16th
September 2015 to 15th September 2017 around 17400 hours in total. The production from the solar
panels us higher in the summer while the production from the wind turbine is slightly higher during the winter season. The following figures show the power production for the two years from the solar panels and the wind turbine and the total power production for the two years.
13 | P a g e Fig 10: Wind power production
14 | P a g e Fig 12: Total power production
The power consumption in the town of Simris by the households and companies over the simulation period of 2 years is shown in the figure below. The power consumption is higher during the winter months as compared to the rest of the year. According to the data received, the total power consumption for the 2 years is 3962 MWh (E. ON Energidistribution 2018).
15 | P a g e Fig 13: Total load consumption
According to the data provided, the power consumption is slightly higher than the total power production. And the Simris is dependent on the Swedish National Grid to fulfil their demands for the power consumption. It is evident from the figure that the variation of the power production is quite different from the consumption, on both long term (seasonal) and short term (hours-days).
3.2) Scenarios:
The aim of this project thesis is to run the Simris Hybrid Energy System into island mode and for this purpose four scenarios are discussed, and simulation is performed in MATLab. The four scenarios are given below:
1) Taking load is equal to production and using fractions of energy produced by wind turbine and solar panels and checking the size of the battery needed.
2) Using a 2.350 MW modern wind turbine with better capacity factor (however only using a frac-tion of it, always matching the total yearly load).
3) Using a 2.350 MW modern wind turbine with better capacity factor and sharing excess to keep battery size low.
4) Using a 2.350 MW modern wind turbine with better capacity factor and sharing excess to keep battery size low and taking production from PV to 10 times more than the original production now.
16 | P a g e
3.2.1)
Taking production is equal to load and using fractions of energy produced by wind
tur-bine and solar panels and checking the size of the battery needed.
This scenario was simulated in MATLab in such a way that the production was taken equal to the load in Simris. Then the simulation is done in such a way that the fractions of the power from wind and solar panels are used and at each fraction the power production is equal to the power consumption at Simris. Scale factors 𝑓𝑃𝑉and 𝑓𝑤𝑖𝑛𝑑 were introduced according to:
𝑃𝑃𝑉 = 𝑓𝑃𝑉𝑃𝑃𝑉,𝑜𝑟𝑔
𝑃𝑤𝑖𝑛𝑑 = 𝑓𝑤𝑖𝑛𝑑𝑃𝑤𝑖𝑛𝑑,𝑜𝑟𝑔
Where,
𝑃𝑃𝑉= the power from the PV panels 𝑃𝑃𝑉,𝑜𝑟𝑔=the original data of the PV panels 𝑃𝑊𝑖𝑛𝑑= the power from the Wind turbine 𝑃𝑊𝑖𝑛𝑑,𝑜𝑟𝑔=the original data of the Wind turbine
The scale factors are chosen so that the total production exactly matches the load, and the share of pro-duction from the wind turbine (and hence PV) may be varied.
The contribution of PV and wind power fractions in the total production started from 95% of PV until 5% and with the interval of 5%. While the contribution of the wind power started from 5% wind power until 95% and with the interval on 5%. The battery level was calculated for each point with different fractions from the PV and the wind.
3.2.2)
Using a 2.350 MW modern wind turbine with better capacity factor (however only using
a fraction of it, always matching the total yearly load).
This scenario was simulated in MATLab by selecting 2.350 MW modern wind turbine with better capacity factor and operating it at the hub height of 98m. As the wind turbine that is used now in Simris is old technology and it has been installed there about 20 years before, so by using the new turbine the production from it will be efficient. The wind turbine is scaled down in such a way that it produces power how much is needed and not producing more power above that demand.
The power curves for the turbine at Simris was available and the power curve for the new turbine was obtained from the literature. The following procedure was followed to obtain the Power production by the new turbine at the selected hub height:
17 | P a g e Fig 14: Power vs Velocity graph used for interpolation
Interpolation was used to find the velocity of the winds at the height of 48m. the figure above shows the power output against the wind velocities need for the interpolation.
After interpolation, velocity at height 48m for the old turbine is calculated. Terrain roughness, Z0 = 0.03 (fields and open surface)
Initial hub height, hi = 48m
Final hub height, hf = 98m
The following formula was used to calculate the velocity at the final height:
After finding the velocity at the hub height of 98 m, the interpolation is done to find the power output of the new turbine by using the power curves of both the new and the old wind turbines.
The power out from the new turbine is used to find the nominal wind power. PV power output remains the same as in Scenario 1.
18 | P a g e
3.2.3)
Using a 2.350 MW modern wind turbine with better capacity factor, and sharing excess
of power produced to keep battery size low
This scenario was simulated in MATLab in such a way that the power output from the new wind turbine is not limited to the load in the Simris. And the extra power that is produced can be shared with the national grid of the nearby communities.
The PV installed power was held constant, whereas the wind turbine installed power was varied between 400 kW and 1500 kW (scaled down from the modern wind turbine in the same way as in scenario 2). The filling of the battery is now calculated, but a maximum fill-up level is also specified, so that overproduction is shared if the battery has reached its maximum level. A minimum level is however not specified; instead, for each tested installed power for the wind part, the maximum level is varied, and the needed battery size calculated (max level minus min level). The smallest battery size that is found during this variation of the maximum level gives us the needed battery size at this particular value for the wind turbine installed power.
3.2.4) Using a 2.350 MW modern wind turbine with better capacity factor and sharing excess
to keep battery size low and taking production from PV to 10 times more than the
origi-nal production now.
The simulation of this scenario was done in MATLab in such a way the power output from the new turbine is not limited to the load and extra power can be shared same as in scenario 3. In scenario 3 the power output from the PV was kept constant but here the power output from the PV is increased to 10 times the original power output from the PV, whereas the wind turbine installed power was varied between 400 kW and 1500 kW (scaled down from the modern wind turbine in the same way as in scenario 2). The same coding in MATLab was followed as in scenario 3 related to the maximum and minimum levels of the battery.
19 | P a g e
5) Analysis and Results
4.1) Taking production is equal to load and using fractions of energy produced by wind
turbine and solar panels and checking the size of the battery needed.
After simulation the following results are obtained:
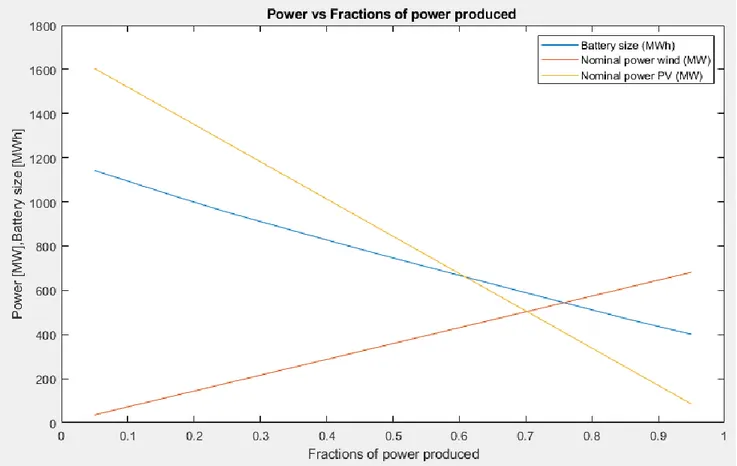
In the figure below is that in the start 5% power is produced by wind turbine and 95% from the solar panels of the total power needed and the battery needed for producing power at such fractions is almost 1200 MWh. If power is produced 50% from each of the PV and wind turbine the battery needed to run Simris in island mode is about 800 MWh. The smallest size battery is needed when 95% of total power is produced from wind turbine and 5% from PV and battery size needed is 401 MWh.
20 | P a g e Fig 16: Needed battery size
The figure above shows the battery size with respect to fractions of power production from wind turbine and solar panels. The battery size strongly depends on the fractions of power production from the wind turbine. The higher the fraction the lower the battery size. But with increase in the higher fractions of PV contribution to the power production the larger the battery is needed. It’s because the PV mostly works in the summer and needs large size battery to store power for the winter season. It’s better to produce more power from the wind turbine as wind is available at most of the time as compared to be dependent on the PV.
4.2)
Using a 2.350 MW modern wind turbine with better capacity factor (however only using
a fraction of it, always matching the total yearly load).
After simulation the following results are obtained:
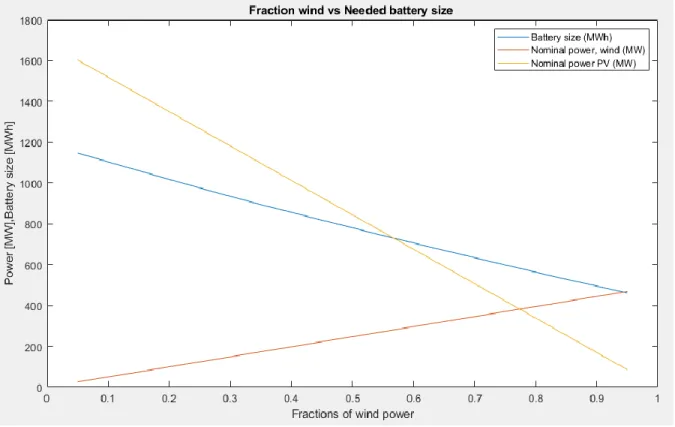
The figure below it can be seen that the battery size in this scenario depends on the fractions of wind power used. The higher the fractions of wind power used the lower the battery needed. As PV is strongly weather dependent so a huge size battery is needed to manage the power production and consumption in Simris.
21 | P a g e Fig 17: Power vs Fractions of wind power used
22 | P a g e In the above figure the battery size for different fractions of PV and wind turbine is shown. The blue line which is for 95% power from PV and 5% from wind turbine requires the biggest battery size of almost 1200 MWh. Then the battery size becomes smaller with the usage of 50% of PV and 50% of wind turbine power which is shown by red colour line. The green line which shows 5% PV and 95% wind turbine requires the smallest battery size of 462 MWh.
By comparing the results from the scenarios 1 and 2, for the scenario 2 bigger battery size is needed as compared to scenario 1. This is due to the fact that the modern wind turbine produces more evenly during the year, while that old turbine produced more during the winter, relatively. So, the power production from the old turbine actually matches the load better on a seasonal time frame.
4.3)
Using a 2.350 MW modern wind turbine with better capacity factor, and sharing excess
of power produced to keep battery size low
After simulation we get the following result:
In the figure below, it is shown that most of the time of the year the battery level is at maximum level but in the months of January, February, March and April there is no excess of energy and the battery is used to compensate for the load demands. During the months of May, June, July and August the battery is most of the time at maximum level and there is much excess energy.
23 | P a g e The figure below shows the relationship between the battery size and the nominal power produced by the new wind turbine. The battery size decreases with the increase of rated power from the wind turbine. If the rated power from the wind turbine is 400 kW then the battery needed is of the largest size at almost 500 MWh. But as the rated power from the wind turbine increase the size of the battery starts to become smaller and smaller until it reaches to the size of 59 MWh and at rated power of 1000 kW. If the rated power from the wind turbine increase from 1000 kW it has no effect on the size of the battery. It’s because the extra power that is produced is not used and during some months like January, February, March and April the wind is not fast enough to run the wind turbine at rated power so the shortage in production is compensated from the battery and a battery size of at least 59 MWh is needed for this scenario.
The horizontal red line which is the power produced by the wind turbine at of rated power 1000 kW shows the excess power during time. Most of the time the power produced is not used but during the months of January, February, March and April the power is needed, which shows no excess power is produced in Simris.
Fig 20: Battery size vs Nominal wind power
After literature study and calculations related to the economic aspects of installing new wind turbine and using bigger battery, the following information was obtained:
The costs for installing wind turbine and the battery was taken from literature and the references to such literature is given in the reference list.
24 | P a g e Average cost of battery = 1700 EUROs / kWh (10,23)
So,
By using 59 MWh instead of 500 MWh of battery size the amount of cost saves = 1700*(462-59) *1000EUR = 685 Million EUR.
From literature, wind power cost = 2000 USD/kW (22) Exchange rate from USD to EUR is ‘1.12’.
Upgrading from 500 kW to 1000 kW wind turbine would cost = 2000*(1000-500) * 1.12 = 1.12 Million EUR.
Installing a new 1000 kW wind turbine would cost = 2000*1000*1.12 = 2.24 Million EUR
After making calculations on the installation of wind turbine and batter size it is obvious that it is more economical to use 1000 kW wind turbine with a combination of 59 MWh battery size rather than 462 kW wind turbine with 500 MWh battery size.
4.4)
Using a 2.350 MW modern wind turbine with better capacity factor and sharing excess
to keep battery size low and taking production from PV to 10 times more than the
origi-nal production now.
After simulation the following results were obtained:
The following figure shows the production and load of the scenario 4 that was coded in MATLab. The black vertical lines show the production from the new wind turbine and the power output from this turbine is limited up to 1000 kW. The blue lines show the power output from the PV which has rated power of 440 kW and it is scaled up to 10 times the original power output that’s why the vertical blue lines reached until 4000 kW. The red line at the bottom shows hourly load of the Simris.
25 | P a g e Fig 21: Production, Load vs Hours
26 | P a g e The above figure shows the battery level vs Hours. The battery is at maximum level at most of the time but there is some power usage from the battery during some of the months like February, March and April. During these months no excess power is produced, and battery helps in compensating to fulfil the load demands. Much of the excess power is produced during the months of May, June, July and August as the PV is producing much of the power alongside of the wind turbine.
Fig 23: Battery size vs Nominal power
The above figure shows the relationship between the battery size and the nominal power produced by the new wind turbine and scaled up PV. The battery size needed is the biggest if the wind turbine is only producing power at the rated power of 400 kW. The battery size should be 180 MWh at this point. But as the rated power of the wind turbine increases the size of the battery needed becomes smaller as well. When the rated power from the wind turbine reaches to 1000 kW the battery size needed is 35 MW. As seen from the figure the size of the battery remains constant even after the rated power from the wind turbine is increased it’s because the extra power that is produced is shared and battery is mostly used on in the months of January, February. March and April. So, for such scenario a battery size of up to 40 MWh will work to run the Simris in island-mode.
27 | P a g e Table 3: Summing up the scenarios
Installed wind turbine power
Installed PV
Energy produced Excess energy Battery needed
Scenario 1 681 kW 84 kW 3962 MWh 0 kW 401 MWh Scenario 2 469 kW 84 kW 3962 MWh 0 kW 462 MWh Scenario 3 1000 kW 440 kW 8967 MWh 5265 MWh 59 MWH Scenario 4 1000 kW 4400 kW 17417 MWh 13715 MWh 35 MWH
According to the above table the smallest battery needed to run Simris in island mode is 35 MWh and the calculations that were made earlier shows that even this small battery is quite expensive. The battery that is used now in Simris is only 800 kWh and E. ON is planning to make it bigger to a capacity of 1.6 MWh. To make a 40 or 35 MWh battery and an oversized wind turbine is economically hard for the current project or for such a system that runs off-line most of the time. The purpose of this study is:
We may have a microgrid that is normally grid-connected, but if something happens to the grid it is imperative that the microgrid is still serving the village’s needs. Then the economics is different, and the wind turbine and PV will be profitable as any other grid-connected facilities. The battery may also be used, when grid-connected, for other grid support (supplying inertia for example). However, at a grid outage, my analysis shows what needs to be inside the microgrid.
28 | P a g e
6) Conclusions:
A microgrid consisting of wind, PV and batteries can avoid importing power for several months during summer. The battery used at Simris now is only 800 kWh and E. ON is upgrading it to 1.6 MWh which still do not have enough storage capacity to store all the energy that is produced during this time and having bigger batteries for storage are quite expensive. The wind turbine was installed in 1996 and has a rated power of 500 kW which is quite old technology and higher capacity wind turbine needs to be installed. The 4 scenarios that were simulated in MATLab and discussed in this report shows different proposals for running the Simris microgrid in island-mode. All these scenarios required upgradation of the wind turbine, PV and battery system. The upgradation of the wind turbine is more economical as compared to the PV and the battery system (most expensive).
Comparing between the Scenario 1 and 2, smaller battery size of is needed for scenario 1 as the power production from the wind turbine in this scenario actually matches the load better on as seasonal time frame. The scenarios 3 and 4 suggests much smaller battery sizes of 59 MWh and 35 MWh respectively. Which are much more economical as compared to the first two scenarios.
29 | P a g e
7) References:
1) European Commission (2017). Interflex - Interactions between automated energy systems and flexibilities brought by energy market players. url: http://interflex-h2020.com (visited on
02/02/2019).
-Paris Agreement. url: https://ec.europa.eu/clima/policies/international/negotiations/paris_en (vis-ited on 02/13/2018).
2) R.H. Lasseter, 2002, ”Microgrids”, IEEE PES Winter Meeting, vol. 1, 305-308
3) T. Drizard, C. Lebosse and B. Chazottes, 2015, “INTEGRATION OF DISTRIBUTED PV GENERATION: THE NICE GRID PROJECT”, 23rd International Conference on Electricity Distribution
4) T. Ustun, C. Ozansoy, and A. Zayegh, 2011, “Recent developments in microgrids and example cases around the world. a review”, Renew. Sustain. Energy Rev., vol. 15, no. 8, 4030–4041 5) Gao, D.W. (2015). Energy Storage for Sustainable Microgrid. Academic Press.Oxford. 6) E.ON Energidistribution (2018). Lokal energiproduktion - Ett nytt sätt att tänka kring energi.
url:https://www.eon.se/om-e-on/innovation/lokala-energisystem/vi-pa-simris.html
7) International Energy Agency (2015). Energy and climate change. World Energy Outlook special report.
– (2018). World Energy Outlook 2017. url: https://www.iea.org/weo2017/ (visited on 01/02/2019).
8) IVL Sweden Environmental Institute (2011). Energy scenario for Sweden 2050 - based on renewa-ble technologies and sources.
9) Milica Bogdanovic, Henning Wilms, Marco Cupelli, Michael Hirst, Luis Arturo Hernandez Salm-eron, Antonello Monti 2018, “Interflex – Simris – Technical Management Of A Grid-Connected Mi-crogrid That Can Run In An Islanded Mode With 100% Renewable Generation”.
10) Pauline Ahlgren, E. H., 2018. “System performance analysis of an isolated microgrid with renewable energy sources and a battery and hydrogen storage system”.
11) WindEurope 2017. Wind in Power: 2016 European Statistics [web publication]. WindEurope. [Accessed 23 March 2017]. Available from:
https://windeurope.org/wp-content/uploads/files/about-wind/statistics/WindEurope- Annual-Statistics-2016.pdf
12) Anon., n.d. wWindea. [Online]
30 | P a g e 13) Anon., n.d. Evaluation of different turbine concepts for wind power. [Online]
Available at: https://www.sciencedirect.com/science/article/pii/S1364032107000111 14) Anon., n.d. Wind power engineering. [Online]
Available at: https://www.windpowerengineering.com/business-news-projects/blog/build-wind-turbine-hurricane-speed-winds/
15) Handleman, 2015. Stability Analysis of DFIG based Wind Energy System.
16) Anon., n.d. engg journals. [Online]
Available at: http://www.enggjournals.com/ijet/docs/IJET17-09-03S-085.pdf
17) Handleman, C., 2015. Wind Could Replace Coal As US' Primary Generation Source, New NREL Data Suggests.
18) Wiser R, L. E. B. M. M., 2012. Recent developments in the levelized cost of energy from U.S. Wind power projects..
19) M.R. Islam, S. ,. R., 2013. Progress and recent trends of wind energy technology. 20) Anon., n.d. Mechanical Booster. [Online]
Available at: http://www.mechanicalbooster.com/2017/01/types-of-wind-turbines.html 21) Anon., n.d. Wind power programme. [Online]
Available at: 1http://www.wind-power-program.com/betz.htm 22) Anon., n.d. IRENA. [Online]
Available at:
https://www.irena.org/documentdownloads/publications/re_technologies_cost_analysis-wind_power.pdf
23) Anon., n.d. IRENA. [Online]
Available at:
https://www.irena.org/-/media/Files/IRENA/Agency/Publication/2015/IRENA_Battery_Storage_report_2015.pdf
24) Quaschning, V., 2016. Understanding renewable energy systems. Routledge. 25) Tile pic taken by Armin Kübelbeck, lic no. CC BY-SA 3.0
26) Microgrid pic by Le Anh Dao, lic no. CC BY-SA 4.0
PO Box 823, SE-301 18 Halmstad Phone: +35 46 16 71 00
E-mail: registrator@hh.se www.hh.se
I am Naeem Akhtar and studied Master's in Renewable Energy Engineering, completed in June 2019. email: naeemakhtar09@yahoo.com phone no: +46762101330.