B
OARD COMPOSITION AND
F
INANCIAL
D
ISTRESS
:
A
N
E
MPIRICAL EVIDENCE FROM
S
WEDEN AND
D
ENMARK
Authors: Amira Akhmetova & Yulia Batomunkueva Supervisor: Catherine Lions
Student
Umeå School of Business and Economics Spring Semester, 2014
Abstract
Recent failure of such companies as Enron, Worldcom and Parmala showed that there are internal reasons contributing to company’s financial distress. Financial distress is a condition when a company fails to meet its debt obligations. Board of directors is liable for long-term decisions and their ineffective work in monitoring and controlling management can influence companies’ performance. With that in mind, in this degree project, we would like to answer the following research question: “What is the
relationship between characteristics of Board and probability of financial distress, measured by Altman’s Z-score models in Sweden and Denmark?”
The epistemological and ontological choices for our study were positivism and objectivism with deductive approach. We have calculated Z-scores of Swedish and Danish companies in order to detect distressed and healthy companies. Further on, the information about board composition in each company was collected; mainly we were interested in board independence, board size, board ownership, COB ownership, CEO duality and employee representatives.
In order to examine if there is a relationship between board composition and financial distress, we have done Multiple and Binary Regression analyses. Based on the results we can state that board independence, board ownership and employee representatives and market capitalization (control variable) have significant relationship with probability of financial distress. Our study is interesting since we have looked at employee representatives, as a board characterectic that is specific for Nordic countries and that was not studied before. In addition, we have found that there is no CEO duality in Sweden and Denmark, since all companies in our sample followed the Companies’ Acts. COB ownership, the additional variable we wanted to test and board size have shown no significant relationship
Key words: board composition, financial distress, board independence, board size, board ownership, CEO duality, COB ownership, employee representatives, Altman’s Z- score, market capitalization, Sweden, Denmark.
Acknowledgement
We would like to express our deep gratitude to our supervisor Catherine Lions for her motivation, valuable feedback, guidance and useful critiques. The assistance of Anna Thorsell in the beginning of our thesis is greatly appreciated. We would also like to thank Mykola Shykula for assisting us in statistics.
Thank you.
Umeå, May 22nd 2014
Table of content
Chapter 1. Introduction ... 1
1.1 Problem background ... 1
1.2 Research question ... 4
1.3 Purpose of the research ... 4
1.4 Research gap ... 4
1.5 Contributions and limitations ... 5
1.6 Choice of subject ... 5
1.7 Disposition ... 6
Chapter 2. Methodology of the research ... 7
2. Preconceptions ... 7 2.1. Research philosophy ... 7 2.1.1 Epistemological considerations ... 7 2.1.2 Ontological considerations ... 10 2.2. Research approach ... 11 2.3. Research strategy ... 12 2.4. Research design ... 13 2.5. Research method ... 15
2.6. Literature and data source ... 17
2.7. Summary of the theoretical methodology ... 17
2.8. Ethical and social considerations ... 18
Chapter 3. Theoretical frameworks ... 21
3.1. Introduction to financial distress ... 21
3.1.1. Trade off theory ... 22
3.1.2. Pecking order theory ... 24
3.1.3. Trade off theory vs. pecking order theory ... 26
3.1.4. Agency costs ... 27
3.1.5. Altman’s Z-‐score ... 27
3.2. Board composition ... 29
3.2.1. Board composition in Sweden and Denmark ... 30
3.2.2. Agency, resource dependence and stewardship theories ... 34
3.2.3. Board composition indicators ... 36
3.2.3.1. Board independence ... 36
3.2.3.2. Board size ... 38
3.2.3.3. Board ownership ... 39
3.2.3.4. CEO duality ... 40
3.2.3.5. Employee representatives ... 40
3.2.4. Summary of theoretical framework ... 41
Chapter 4. Practical method ... 43
4.1. Sampling ... 43
4.2. Data collection ... 43
4.3. Variables and assumptions ... 44
4.4.1. Hypotheses ... 47
4.4.2. Control variable ... 49
4.4.3. Data setup and coding ... 49
4.5. Multiple regression analysis ... 49
4.6. Practical issues ... 50
4.6.1. Multicollinearity ... 50
4.6.2. Heteroscedasticity and its detection ... 50
4.6.3. Linearity ... 51
4.6.4. Normality test ... 51
4.7. Correlation ... 51
Chapter 5. Empirical findings ... 53
5.1. Descriptive statistics ... 53 5.1.1. Sample segmentation ... 53 5.1.2. Board independence ... 54 5.1.3. Board size ... 55 5.1.4. Board ownership ... 56 5.1.5. COB ownership ... 56
5.1.6. Employee representatives in the board ... 57
5.1.7. CEO duality ... 58
5.2. Multiple regression analysis ... 58
5.3. Binary logistic regression ... 59
5.4. Logarithmic transformations in multiple and binary logistic regressions ... 62
5.4.1. Binary logistic regression with logarithmic transformation ... 62
5.4.2. Multiple regression with logarithmic transformation ... 64
5.4.2.1. Multicollinearity ... 64
5.4.2.2. Heteroscedasticity test ... 65
5.4.2.3. Normality test and linearity ... 65
5.4.2.4. Multiple regression analysis output ... 67
5.4.2.5. Pearson correlation ... 67
Chapter 6. Analysis and quality criteria ... 69
6.1. Analysis of the results ... 69
6.1.1. Board independence and Hypothesis 1 ... 69
6.1.2. Board size and Hypothesis 2 ... 70
6.1.3. Board ownership and Hypothesis 3 ... 71
6.1.4. COB ownership and Hypothesis 4 ... 71
6.1.5. CEO duality and Hypothesis 5 ... 71
6.1.6. Employee representatives and Hypothesis 6 ... 72
6.1.7. Control variable ... 72
6.1.8. Summary of analysis of results ... 73
6.2. Quality criteria ... 73
6.2.1. Reliability ... 73
6.2.2. Validity ... 74
6.2.4. Replication ... 74
Chapter 7. Conclusion and further research ... 76
7.1. Conclusion ... 76
7.1.1. Answer to the research question ... 77
7.1.2. Theoretical and practical contributions ... 77
7.1.3. Limitations and suggestions for further research ... 78
Reference list ... 80
Appendices ... 89
Appendix 1. List of Swedish companies ... 89
Appendix 2. List of Danish companies ... 93
List of Tables Table 1. Kolb’ s experiential learning cycle stages ... 12
Table 2. Research Design ... 15
Table 3. Types of secondary data collection ... 16
Table 4. Summary of board regulations in Sweden and Denmark ... 33
Table 5. Variables ... 49
Table 6. Correlation calculation requirements ... 51
Table 7. Matrix of correlations among independent variables ... 52
Table 8. Correlations coefficients ... 52
Table 9. Sub-‐samples of financially distressed and healthy companies ... 53
Table 10. Board size ... 55
Table 11. Board ownership ... 56
Table 12. COB ownership ... 57
Table 13. Model summary for multiple regression ... 58
Table 14. ANOVA ... 58
Table 15. Coefficients of multiple regression ... 59
Table 16. Classification table of binary logistic regression ... 61
Table 17. Omnibus tests of model coefficients ... 61
Table 18. Variables in the binary logistic regression equation ... 61
Table 19.Classification table of binary logistic regression ... 63
Table 20.Omnibus tests of model coefficients ... 63
Table 21.Variables in the binary logistic regression ... 64
Table 22.Multicolleniarity statistics ... 65
Table 23.Skewness and kurtosis ... 65
Table 24.Normality tests ... 66
Table 25.Model summary with transformed variables ... 67
Table 26.Pearson correlation ... 67
Table 27.Coefficients in multiple regression ... 68
List of Figures Figure 1. Summary of methodology ... 18
Figure 2. Trade off theory ... 22
Figure 3. Management structures ... 30
Figure 4. Sample ... 47
Figure 5.Sample ... 53
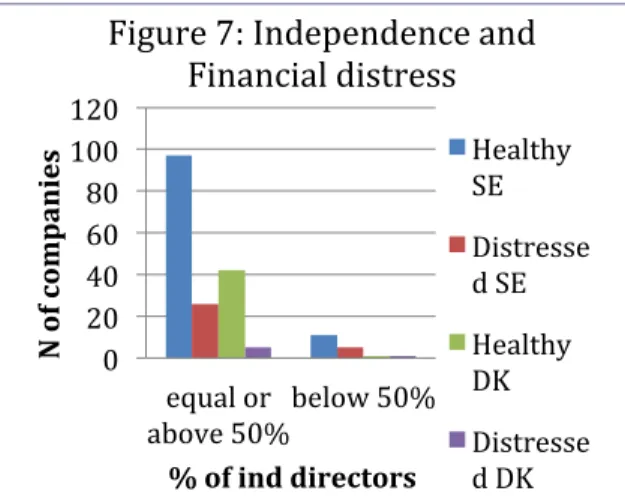
Figure 6.N of independent directors in the BOD ... 54
Figure 8.Board ownership and FD ... 56
Figure 9.COB ownership and FD ... 57
Figure 10.Presence of employee representatives (Yes, No) and FD ... 57
Figure 11.Scatterplot ... 65
Figure 12.Histogram ... 66
Figure 13.Linearity ... 66
Chapter 1. Introduction
This chapter begins with the introduction of our research area. We will start with the problem background, where a reader will be informed about previous research conducted in our area of interest. After the problem background, we will formulate the research question, the purpose of degree project and state gaps, which provided opportunity for our studies. The last part of this chapter will be dedicated to the contributions and limitations of the research paper and our choice of subject.
1.1. Problem background
Large, small or medium-sized companies strive for success and profitability. Some of them are doing very good but others at some point in time fall into economic or financial distress. Financial distress (FD) occurs when companies fail to meet their obligations to creditors. It can lead to bankruptcy or liquidation in many cases however there are some companies who manage to recover by restructuring their business or making major changes. So what are those causes and reasons that influence companies’ performance and if there are so, can they be anticipated and managed?
In our opinion some of the events occur inevitably and cannot be eliminated or predicted, like for example economic downturns or unforeseen events. Besides, companies are going through business cycles, where the recession stage cannot be overcome. Those reasons can be easily explained and in most cases there is none who is responsible for that. At the same time researchers share the opinion that poor management and leadership are the reasons of companies’ failure. We can find numerous studies where early systems of FD prediction were developed based mainly on the information of financial statements. According to Lee & Yeh, financial statements are ex-post in nature and if we take a look at ex-ante information sources, corporate governance is the source that is worth considering. The authors assume that poor corporate governance was one of the reasons of Asian crisis in 1997 (Lee & Yeh, 2004). Therefore, it goes without saying that the role of managers is crucial for companies at any stage of development. Managers are the ones who choose business models and make financial decisions that directly influence companies’ performances. But when it comes to FD, the characteristics of the board become decisive. Therefore, most research in this area has been done in order to observe the relationship between board composition and financial performance of a company. In this paper, we are going to look at Swedish and Danish companies and see whether management, namely board of directors, has an impact on probability of FD. Probability of FD is going to be measured by Altman’s Z-score models, which predict FD.
Before we formulate the research question, we would like to discuss some of the previous research papers that have already been done in that area. The research area of corporate governance is very broad and attracts a lot of researchers’ attention. It became interesting to understand the role of management that regulate and run the companies. Researchers have recognized the importance of corporate governance many years ago. The focus of corporate governance research is wide and multi-faceted. In the introduction part we would like only to discuss studies that became an inspiration for us and made us interested in the topic.
The majority of empirical studies, which tested the connection between corporate governance and financial performance, were conducted in US and some other countries
outside of Europe. One of the reasons for high interest in this area can be explained by the existence of the so-called CEO duality. CEO duality is the practice when one person can be appointed and take position of a chief executive officer (CEO) of a company and at the same time be a chairman of the board (COB). American researchers Daily & Dalton have made the main contribution to this aspect of corporate governance research. Theories have been developed in order to argue positive and negative effects of CEO duality on the company. Between those two contradicting theories are prevailing: agency theory, founded by Jensen & Meckling (1976) and stewardship theory founded by Donaldson (1990). The controversial theories have been developed discussing the pros and cons of CEO and COB positions taken by the same person. The main idea is that dual leadership will not allow CEO, acting as a COB, to perform and at the same time to monitor the performance objectively. The CEO duality has also been studied from an international perspective. Japanese, US and UK companies were selected in order to understand if there are any differences. The researchers found out that Japanese companies differ greatly from US and UK ones in terms of cultural differences in board composition (Dalton & Kesner, 1987). Thomsen & Conyon share this point of view and agree that cultural background can be the reason for restriction of CEO duality (Thomsen & Conyon, 2012, p. 143). For our study, based on two Nordic countries: Sweden and Denmark, we would like to see whether CEO duality takes place. Since we are looking at board composition in connection to probability of FD, studies testing the relationship between CEO duality and FD are of our interest. Conclusions of empirical studies are quite inconsistent. Daily & Dalton (1994) prove that there is a positive relationship between CEO duality and bankruptcy filing. Later another research that was implemented on a sample of family owned companies in Lebanon also showed a positive relation and therefore higher probability to default if CEO takes a position of COB (Salloum et al., 2013). The argument in favour of these findings is the loss of independence of the board. At the same time, other studies were not able to show a relationship between CEO duality and probability of FD (Elloumi & Gueyie, 2001; Rauterkus et al., 2013). We also should mention here a study made by Simpson & Gleason where the banking firms were selected for the sample. The authors among other characteristics of the board concluded that CEO duality decreases probability of FD (Simpson & Gleason, 1999).
The number of outsiders is one of the characteristics of board composition that can influence the independence of board. Harris & Raviv developed a model of optimal board of directors, which includes such characteristics as size, number of outsiders and insiders, factors that influence decisions board makes when hiring outsiders or preferring insiders. The authors came up with a conclusion that even though companies prefer outsider-controlled boards, in reality it is the other way around. Companies would prefer insider-controlled boards if the costs of secret information about a company prevails the agency costs. The high number of outsiders tends to increase the value of a company. But in case the number of outsiders is too big, the free rider problem might occur and thus the effort each outsider puts in a company decreases with an extra outsider. Still, the outsider is considered as a guarantor of fair information disclosure (Harris & Raviv, 2008). Previous researchers found a positive relationship between the number of outsiders in the board and the probability of FD (Elloumi & Gueyie, 2001). Rauterkus et al. found that a large number of insiders is significant and positively related to the probability of FD (Rauterkus et al., 2013). In most cases the number of outsiders or insiders has not been considered as having significance (Salloum et al., 2013; Simpson & Gleason, 1999).
The size of the board, the number of members in the board is also considered to be an influential characteristic. Tanna et al. were studying the connection between efficiency of UK banks and board structure and concluded that there is a positive relationship between size and financial performance (Tanna et al., 2011). A large board tends to be less effective than small one (Harris & Raviv, 2008). Simpson and Gleason studied the size of the board, however they could not find any evidence that the size of the board has a significant influence on FD probability (Simpson & Gleason, 1999).
The above mentioned research papers have demonstrated controversial results and conclusions. The reason might be in the size of samples, different choice of control variables and regions where those studies were implemented. All in all, we can only agree that the “proper” board composition can help companies to avoid bankruptcy and recover from FD.
Studies by Fich & Slezak (2007) and Rauterkus et al. (2013) became an inspiration for our thesis work where we also want to test the connection between board composition and FD probability, which we are going to measure with the help of Altman’s Z-score models. Altman’s Z-score models are the most widely known. There are many methods and models companies use in order to predict and estimate the probability of default. However, Altman’s Z-score models are fairly considered being the most common and easy to apply.
Most of the research papers also have stated that Altman’s model is more applicable to manufacturing companies than for nonmanufacturing, since initially the model had been developed on the sample of manufacturing companies, therefore it is logical to predict that the model will be best for those companies. To support this point of view, Platt & Platt have made a research where they came up to a conclusion that industry-related ratios increase the accuracy of the bankruptcy prediction models rather than unadjusted ratios (Platt & Platt, 1991, p. 1193).
Samkin et al. made a research based on the sample of failed financial companies in New Zealand in 2011 and suggested to include the financial failure prediction models in the financial statements that in their opinion would improve the overall performance and increase the investors’ knowledge about financial state of companies (Samkin et al., 2012, p. 80). Besides, they have calculated Z-scores for the twenty failed financial companies over the five years period before collapse. The conclusion they have made was that Altman’s model predicted correctly the imminent failure for majority of companies over the five years period before the actual collapse. However, authors agreed with the cited research of Sharma & Mahajan that ratios differ across the industries and non-financial factors like poor management performance also influence the bankruptcy (Samkin et al., 2012, pp. 79-80).
Alareeni & Branson (2012) made a study, where they tested the generalizability of Altman’s models in the Jordanian environment. The study is interesting since it was tested on companies located in a Jordanian emerging market. The authors concluded that a model developed in 1968 works effectively. The model was successful in application to industrial companies, but also it works for service companies better than Z-score model, which is initially developed for nonmanufacturing companies. This is a quite fascinating conclusion.
Since we are going to use only financial information for the recent available year, there is no need to cover the problem of time horizon. It is said that Z-score shows more accurate score one year before bankruptcy, therefore we can consider the high precision level in our studies. Besides, Altman’s models are considered to be as a warning signal where management can undertake appropriate actions in order to avoid FD. Our proposition is to use Altman’s Z-score as a measure of probability of FD.
1.2. Research question
One of the possible reasons for few studies done in Europe can be explained by the difference in regulations and Corporate Governance Acts. Since we as students studying in Swedish university, we decided to choose Sweden as a country of our interest and its neighbouring country Denmark. Another essential reason is the absence of previous empirical studies in this area conducted on the sample of Swedish and Danish companies.
Our research question is:
“What is the relationship between characteristics of Board and probability of financial distress, measured by Altman’s Z-score models in Sweden and Denmark?”
The relationship is going to be distinguished with the help of statistical tests and identified as positive or negative to probability of FD.
1.3. Purpose of the research
The main purpose of this degree project is to identify the possible relationship between board composition and probability of FD among listed companies in Sweden and Denmark. Sweden and Denmark were chosen due to the authors’ interest in the Scandinavian region. The main focus of this paper is to examine board composition characterised by board independence, board size, board ownership, COB ownership and CEO duality.
As a measure of probability of FD, we have chosen the Altman’s score models. Z-score will be calculated based on one year financial data, since we believe it will provide higher precision, because it was proven to have 95 % of accuracy, one year prior to the failure (Bellovary, 2007, pp. 2-4).
The results of this study are aimed to fill in the gap and represent up-to-date information about board composition and how its characteristics could be related to FD probability of listed companies in the Swedish and Danish markets. We will develop first a database, containing our sample formed of segments with Distressed and Healthy companies and then build a database, containing information of board composition in these companies.
1.4. Research gap
There were lots of papers dedicated to corporate governance from management area and more than enough could be found about FD from the perspective of finance and accounting. We in turn would like to conduct a study that will be equally interesting from the finance and corporate governance points of view. We agree with many other researchers that the health of a company depends not only on ex-post information
(financial statements) but also on ex-ante information, where board characteristics are considered to be the one.
Since majority of previous research studies were mostly done in the USA and Canada and some other countries outside of Europe, we would like to analyse the Swedish and Danish markets. Moreover, Sweden and Denmark are parts of the Scandinavian region, thus this study we believe will provide additional valuable information, which can be used for further studies in this area.
1.5. Contributions and limitations
The main contribution of this study is that it will be conducted in the Swedish and Danish markets. In addition, we would like to cover manufacturing and nonmanufacturing companies in those countries, and we assume that the segment size will be big enough to make certain conclusions and define certain trends. However, we understand that the size of the countries might influence the number of companies that we will end up with. Moreover, we did not find any database providing data for the characteristics of board for listed companies in these regions, therefore we will build our database, based on the sample of financially Distressed and Healthy companies measured with the help of Altman’s Z-score models.
Since we are going to do a degree project, which covers areas like corporate governance, finance and accounting, we would like to state that this thesis is mainly addressed to students, who study business, economics, management, finance and accounting. Managers, directors, auditors, shareholders and investors also might find this paper interesting because the connection of probability of FD and board composition is tested in Swedish and Danish markets. We believe this study might provide additional knowledge to investors, shareholders and directors themselves when making decisions. Investors and shareholders will take into consideration not only the profit and revenue generated by a company, but also take a look at the board composition, which plays a vital role in a company’s performance. In addition, it will be a good contribution into this area of research, since researchers can use our database for further studies in this area.
The main limitation of this study is that we have taken only two countries, which are parts of Scandinavian region. We believe further investigation in the rest of Scandinavian countries is possible.
Another important limitation is language. We as not Swedish or Danish-language speakers can only analyse the information that is available in English, thus only companies with annual reports available in English will be selected.
1.6. Choice of subject
From the very beginning we would like to say that it was difficult to choose a topic that will be interesting for us both to write about. Even though we are International Business Program students (IBP), our focus area of advanced courses in the last year was different. Therefore, we wanted to choose a topic that will not only be understandable, but also the one that will bring new knowledge. We tried to find something, which will fit both fields: finance and accounting. The field of Corporate Governance incorporated with finance and accounting attracted us. Besides, this is the area that we have not been studied extensively before. It is known that managing a company is very hard and
responsible duty. A company’s performance depends upon many factors like strategy, commitments and motivation of employees, company’s positioning, etc. We thought it would be interesting for us to see how board composition influences probability of FD.
1.7. Disposition
Chapter 1: Introduction
This chapter starts with the literature review of problem background and formulation of our research question. Later on, we are going to state the purpose of this degree project and state the research gap. Further on, we will talk about contributions and limitations of the research paper and our choice of subject.
Chapter 2: Methodology of the research
This chapter is dedicated to the methodology of the research, where we start with the philosophy of the research from epistemological and ontological perspectives. Further on the research approach, the research strategy, the research design and the research method will be explained. Literature, data source and ethical considerations will be discussed later on.
Chapter 3: Theoretical framework
Theoretical methodology is divided into two main parts: FD and board composition. In the first part we are going to talk about theories explaining FD and FD predicting method. In the second part we are going to talk about board composition in Denmark and Sweden, corporate governance theories and board composition indicators.
Chapter 4: Practical methodology
This chapter is dedicated to the practical methodology. We are going to define a segment of the research, explain the data collection, variables chosen and hypotheses developed. In addition we are going to talk about the multiple regression analysis we have chosen and check the correlation between the variables.
Chapter 5: Empirical findings
In this chapter we will present our results from descriptive statistics and statistical tests. The statistical tests that we used are Multiple Regression analysis and Logistic Regression analysis. We have also made these analyses with transformed data of variables into natural logarithms.
Chapter 6: Analyses and Quality criteria
In Chapter 6, we are going to analyse the results obtained in the previous chapter. We will connect the theoretical framework with our tested hypotheses. Later on, we will also discuss the quality criteria applicable to our study.
Chapter 7: Conclusion and further research
Finally, we are going to make a conclusion by answering the research question. We will talk about limitation of our study and make suggestions to further research.
Chapter 2: Methodology of the research
In this chapter, the reader will be presented with our research methods that we have decided to take into considerations. We will be talking about a type of research we are going to conduct, research design and methods we used. In addition, it is important to go through the research philosophy and the relations of theory to the research. This chapter is dedicated to the methodology of the research before going to theoretical frameworks.
2. Preconceptions
There is a belief that a researcher’s perception of a study can be influenced by his personal background and experience (Bryman & Bell, 2011, p. 30). We in turn would like to state that our educational background helps us in understanding of this area and provides an opportunity in developing a research paper based on our experience from reading and studying research articles and books. Since we have only theoretical knowledge, which we generated through our studies in Umeå University, the lack of practical experience might limit our perception about reality and therefore create certain biases in the work. But because we are supported and guided by the supervisor, who has practical and theoretical experience, therefore any bias in the lack of practical knowledge is not so vital.
2.1 Research philosophy
The research philosophy adopted in a research provides assumptions in the way social actors are viewing the world. These assumptions will support the research strategy and chosen methods. The philosophy adopted is influenced also by practical considerations, especially the author’s association between “knowledge and the process by which it is
developed” (Saunders et al., 2009, p. 108). There are two major ways of thinking about
research philosophy, which are epistemology and ontology.
2.1.1 Epistemological considerations
Epistemological issue focuses on the question”... of whether or not the social world can
and should be studied according to the same principles, procedures, and ethos as the natural sciences” (Bryman & Bell, 2011, p. 15).
Epistemological considerations in the research can be viewed from different positions. Position that focuses on the implementation of methods from natural sciences to the study of social reality is known as positivism. In order to understand this epistemological position Bryman & Bell provide some principles involved with it, like: the principle of phenomenalism, where the phenomena accepted by the common sense is justified truly as knowledge. The further principle of didactivism states that the main goal of the theory is to develop hypotheses which will be tested and then provide explanations of laws to be evaluated. The principle of inductivism is that the knowledge comes from the gathering of facts, which supply the basis for laws. The fourth principle states that science should be objective and the fifth principle is about clear distinction between the scientific and normative statements. Through those principles we can see the main goal of research through positivism is to collect data that will help to generate hypotheses which can be tested and provide explanations of laws (Bryman & Bell, 2011, p. 15).
Realism is another philosophical position that has two common features with positivism, which are:
• natural and social sciences should use the same types of approach to the collection and the explanation of data;
• there is a reality, which is independent from our depiction (Bryman & Bell, 2011, p. 17).
There are two types of realism: empirical (direct) and critical. Empirical realism states that through the application of corresponding methods the reality can be understood. Critical realism implies “that whereas positivists take the view that the scientist’s
conceptualization of reality actually directly reflects that reality; realists argue that the scientist’s conceptualization is simply a way of knowing that reality” (Bryman & Bell,
2011, p. 17).
The main difference between direct and critical realists is that they perceive the world in different ways. Direct realists argue that the illusions come from the lack of information. Whereas critical realists state that what we see is the small part of a bigger picture and that humans can identify what cannot be seen with the help of social sciences. In terms of business prospective, direct realism would consider that the world is unchanging and operating in one level, whereas critical realism would consider the need in multi-level study (Saunders et al, 2009, p. 115).
Interpretivism is an alternative position to positivism, which will take into consideration the difference between people and objects of natural sciences, where a social scientist is required to understand the subjective importance of social action (Bryman & Bell, 2011, p.17). When using the interpretative stance a researcher should not just explain how members of social group perceive the world around them, but interpret what comes from “the social scientific frame”. The application of the interpretative stance in the research might lead to inductive strategy, where the theory is an outcome of the research (Bryman & Bell, 2011, pp. 19-20).
Interpretivism according to Saunders et al., underlines “the difference between
conducted research among people rather than objects”. It comes from the two
intellectual traditions: phenomenology and symbolic interactionism. Phenomenology focuses on how social actors (humans) interpret the world with their common sense. Symbolic interactionism in turn studies how humans interpret the actions of those with whom they interact and further make adjustments to their own meanings. Simply speaking, it studies the continuous process of interpreting the world around us. The interpretivist position is very valuable when researchers would like to conduct studies of organizational behaviour like, for example, the behaviour of employees in the workplace and with the help of their perceptions interpret the social world (Saunders et al., 2009, p. 116).
According to Saunders et al. (2009, p. 109) there is a debate, which often appears when choosing between concepts within epistemology and ontology. Guba & Lincoln point out that the questions of the method are secondary to the questions of epistemology and ontology and there are some problems when choosing one against another due to it might look unrealistic in practice (Guba & Lincoln, 1994). Yates (2004, p. 14) in turn argues that though the positivist thinking has influenced quantitative methods,
researchers should be careful how far they might take this argument. In addition, Johnson & Clark state that there is not so much importance whether a research contains philosophical content but it is vital how well the research reflects the philosophical choices and provide strong argumentations against alternatives (Johnson & Clark, 2006).
Easterby-Smith et al. (2002, p.28) state that positivist philosophy considers the world to be external and that its features should be studied through objective methods. Simply speaking, positivism entails only observable knowledge. Thus, the epistemology of positivism is often used with quantitative methods, where for example, statistical analysis is conducted with the help of numerical data.
We have gone through different epistemological positions, which are widely used in the business research. Direct realism in terms of business research states that the world is not changing and functioning in one level, where critical realism does not agree with direct realism and considers the multi-level study. We suppose direct realists conduct studies based on senses of their participants, whereas critical realists not only take senses into consideration, but also conduct additional analyses to define whether it is true or not. We consider the direct and critical realism are not appropriate epistemological approaches for our research, since we would like to study the relationship of board composition and FD not based on the perceptions of its participants and behaviour, but on the outcomes of their financial activities. We are not going to define those relationship based on managers or board of director’s behaviour, which might lead to the FD.
Critical realism might be interesting to use as the epistemological consideration. But its idea that there should be a multi level study might make our research more complicated since we will have to not only test, whether there is a relationship of board composition and FD, but also test the methods we used, since they might not show the whole picture of those relationship. Interpretivist position is not appropriate for us, since we are not going to do observations or conduct interviews, for example, in order to define how managers or board perceive the relationship between board composition and the probability of FD. Our research study is not concerned about how management and board interact with each other and commit to the avoidance of company’s failure. We are not going to conduct our study based on the subjective perceptions of management and board, since our research focus is on the investigation whether there are any relationship between board of directors and probability of FD defined from the publicly available documents. These relationship will be tested with the help of hard information derived from annual reports. We consider positivism is appropriate position for us, since our goal of the research is to describe and analyse the phenomena of possible relationship between board composition and probability of FD. Positivists believe that the world is ruled by laws of cause and effect, which can be distinguished if a researcher applies the certain approach of the scientific method. We apply positivistic position due to its ability to describe the phenomena with the help of theories that we can test. Moreover, positivism relies strongly on the empiricism, where a researcher can describe certain phenomena through observations and measurements. In our research paper we are going to investigate the associations of the board composition and the probability of FD by regression analyses. The key approach of this position is that it tries to distinguish natural laws through direct manipulation and observations, which we are going to explain later on in this research (Sachdeva, 2009, p. 25).
2.1.2 Ontological considerations
Ontological questions are involved with the nature of the social entities. The main issue here is “whether the social entities can and should be considered objective entities that
have a reality external to social actors, or whether they can and should be considered social constructions built up from the perceptions and actions of social actors”
(Bryman & Bell, 2011, p. 20).
There are two positions referred to it: objectivism and constructivism. Objectivism states that the “the social phenomena and their meanings have an existence that is
independent of social actors”. (Bryman & Bell, 2011, p. 21) The objectivism can be
clearly seen from the perspective of organization. An organization might have special rules and regulations that are different from organization to organization, which might be interpreted as a reality external to its inhabitants. People work and follow the rules and processes applied and developed by the organization. If the work is not done according to the standards, a person can lose even a job. Similar example is about a culture where objectivism can be viewed as “widely shared values and customs” that people follow (Bryman & Bell, 2011, p. 21).
Subjectivism states that “the social phenomena are created from the perceptions and consequent actions of social actors”. In views of subjectivists, a culture is something
what the organization “is” as the consequences of social principles. Culture is considered as something that is developed by the complex structure of phenomena, which in turn involve social interactions and physical factors (Saunders et al, 2009, p. 111).
Another important ontological position is constructionism, which “challenges the
suggestion that categories such as organization are pre-given and therefore confront social actors as external realities that they have no role in fashioning” (Bryman & Bell,
2011, p. 21).
Knox (2004, p. 124) states that concepts of philosophical and methodological pluralism investigate that the method does not choose a theory, but there is “an elective affinity” that takes place between them. An elective affinity helps a researcher to identify and select the best option out of available ones. Even though we know that positivism is widely used with quantitative strategy, a researcher, who conducts a study in certain area and is aware of such relationship, still has a possibility to choose another strategy. We in turn would like to state that we used elective affinity, when defining philosophy and method suitable to our research. As we have explained in the previous section, positivistic philosophy was chosen due to its application of natural sciences to the reality. We will basically test whether there is a relationship of board composition and FD in reality based on the theory dedicated to this topic that we have found. Furthermore, our data collection will be done through annual reports, which are considered as objective, because they are developed and published based on certain regulations of IFRS that companies must follow (IFRS 2012: IAS 1). The way they are presented and designed might be different in other areas, but general rules and regulations they follow are similar.
Popper (cited in Coldwell, 2007, p. 3) suggests that there is a possibility to use subjective thoughts as objective ideas that exist independent from the individuals who
initially spoke or wrote about them.Even though there is possibility that annual reports, which are written by managers, who can unconsciously add their subjective thoughts or judgements concerning a company’s performance, one could still consider annual reports as a product of objective decisions, since not only a manager who is responsible for a company’s financial statement.
In our research, the collection of financial information with the help of annual reports is necessary, since we want to select certain companies. We believe that annual reports as a secondary information source are objective and trustable, therefore we will not be biased and we have no intention to present misleading results. Based on that, we argue that our research is objective.
2.2 Research approach
As we know a degree project will involve the application of the theory. The word “theory” is used in different ways but its main purpose is “an explanation of observed
regularities” (Bryman & Bell, 2011, p. 7). Zikmund et al. define theory as a set of
propositions that provides explanations to phenomena through other factors that are connected to them. They state that the main goal of the theory is to understand and predict. The understanding is conducted by a researcher through perceiving the connections among different phenomena. In order to make a prediction, a researcher needs to understand why variables act as they do. The process of explaining the phenomena requires a high level of abstraction. Moreover, business researchers should think about concepts in an abstract manner and find the ways to connect them to the observable reality. Thus, the research is developed in two manners: the abstract one through the concepts and propositions; and empirical one, where the reality is observed though different methods and measures (Zikmund et al., 2013, pp. 38-39).
When explaining a certain phenomena, there might be situations when several alternative theories might be applied to the same concept. In order to define which of them is the most appropriate one, a researcher needs to conduct an empirical analysis to verify one of them (Zikmund et al., 2013, p. 43)
We talked above about what the theory is and how it should be used but how is it developed? At the abstract level it is developed by the deductive approach starting from general to specific issue. Deductive approach is basically, where the researcher goes through the information, which is known about a certain area or found from the previous studies, and derives a hypothesis which then is tested through the empirical scrutiny. At the empirical level, the theory might be developed with the inductive approach. Inductive approach is an opposite of deductive approach. The researcher first conducts the empirical part of the chosen area and then comes back to theories in order to associate the certain theory with findings in the chosen area. Deductive approach is usually associated with quantitative research, while inductive approach is associated with qualitative research. A researcher following inductive approach with qualitative strategy uses interviews, observations or focus groups in order to develop a theoretical understanding. It is also common under qualitative approach, when the theory is used as the background (Bryman & Bell, 2011, pp. 11-13).
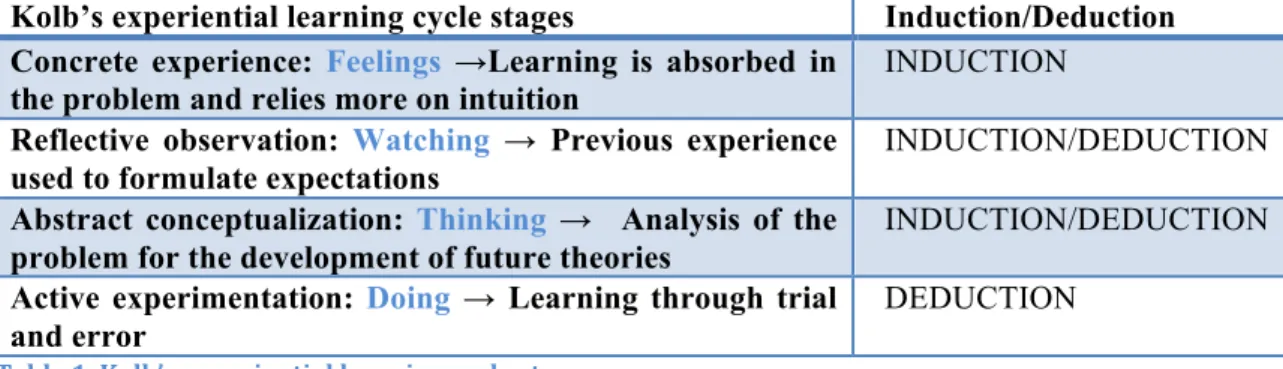
Many authors consider inductive and deductive approaches mutually exclusive. Kolb’s (cited in Knox, 2004) experiential learning cycle summarises those approaches with the help of learning stages that the reader can see below:
Kolb’s experiential learning cycle stages Induction/Deduction Concrete experience: Feelings →Learning is absorbed in
the problem and relies more on intuition
INDUCTION
Reflective observation: Watching → Previous experience used to formulate expectations
INDUCTION/DEDUCTION
Abstract conceptualization: Thinking → Analysis of the problem for the development of future theories
INDUCTION/DEDUCTION
Active experimentation: Doing → Learning through trial and error
DEDUCTION
Table 1. Kolb’s experiential learning cycle stages
Source: (Kolb 1984, cited in Knox, 2004, p.120)
We consider deductive approach as the most suitable for us since our research in nature is more focused on developing and testing hypotheses. According to our research question, we want to find “what” relationship between board composition and probability of FD are. We are not going to start our research paper with specific observations of board composition in relation to probability of FD and then generalise it broadly by developing new theories. Our research question does not start with “if” or “how”, which is widely used in inductive approach. We consider bottom-up approach is not appropriate in our studies, since we are not focusing in defining new theories. We state clearly in our research question that we would like to examine the relationships between board composition and probability of FD. This topic we consider to narrow down to specific characteristics of board composition like board independence, board size, BOB ownership, COB ownership, employee representatives and CEO duality, which we will investigate further on with the help of statistical regression. Following the principle of deductive approach, hypotheses will be defined and specific data will be used in order to test these relationship. We consider it would be logical in our study to choose deductive approach since it goes from general information and theories about our topic of interest and narrows down to more specific issues, which later on are examined with hypotheses. In addition, theories are reviewed before the hypotheses are defined it is better rather than in inductive approach where the hypotheses are stated before the theory is looked through, which can influence the quality of our findings. In addition, inductive approach provides more general findings from the observations, which might influence the precision of the analysis. Our main goal in this research studies is to test existing theories connected to the topic of board composition and FD and not in defining new theories.
2.3 Research strategy
Many writers define two main types of strategies: quantitative and qualitative. Quantitative strategy can be seen as an approach that underlines quantification in the collection and analysis of data; involves a deductive approach in the relationship of theory and research by testing the former; unites the practices and norms of natural scientific model and positivism; and represents an external and objective view of social reality (Bryman & Bell, 2011, pp. 26-27).
Quantitative approach, supported by positivism and statistical analysis, is a very popular way of conducting a research in many scientific papers. It might be due to there are many scientific improvements conducted in this area such as shifts of paradigms, creations of complex statistical models together with technological advancements (Wang, 2010, p. 2).
Qualitative strategy can be viewed as an approach that focuses on words rather than on numbers in the collection and analysis of data. It makes preferences on how individuals are interpreting the social world and see social reality as a frequently changing “emergent property of individual’s creation” (Bryman & Bell, 2011, pp. 26-27).
In practice, most of research papers are relied upon quantitative strategy, since it provides more precise results based on facts and figures, than in qualitative one, which is reversed in terms of accuracy(Jones, 2004, pp. 111-112).
In addition, quantitative and qualitative research strategies represent different epistemological and ontological considerations and different treatments of theory, but there is no clear division of them and many researchers argue that there is a possibility of combining two of them within one research study. For example, Östlund et.al explain the interest of mixing those methods due to the popularity of cost effective research and a desire to move research towards the needs of policymakers and practitioners (Östlund et al., 2011, p. 370).
Easterby-Smith et al. argue that the relationship between philosophy and research strategy is very important since it provides a more informed decision about the research approach, helps to choose which methods are appropriate and figure out the constraints, which research might face (Cited in Knox, 2004, p. 121).
We consider a quantitative strategy as appropriate in our research studies since we are going to use annual reports data in testing relationship of board composition and probability of FD, which will help us to define listed companies in Danish and Swedish markets. Further on we are not going to conduct interviews or observations in order to define the information about these relationship from randomly chosen participants. The relation of board composition to probability of FD will be defined with the help of financial data and information published about the board of directors from the companies’ annual reports which will be further tested through statistical analyses. As we know, quantitative strategy involves the collection of numerical data, which in turn easier to collect and use in the statistical analyses (Babbie, 2004, p. 26). We use quantitative strategy because it provides more precise results, which are based upon the facts and figures (Jones, 2004, p. 111-112). We are going to test relationship of board composition and probability of FD in two countries, taking the whole population of listed companies, therefore quantitative approach is more suitable for us because it provides the higher accuracy of the research outcomes and it is less time consuming. 2.4 Research design
Research design is a structure that helps to conduct a research method and analyse the collected data. There are five types of research designs used in business research: experimental, cross-sectional, longitudinal, case study and comparative (Bryman & Bell, 2011, p. 41).
Experimental design is where there are two groups: treatment and control, which are selected randomly and compared with each other. The difference between them is that the treatment group receives treatment whereas the control one does not. Observation takes place where a dependent variable is checked before and after the experimental manipulation of those two groups and the difference in them is recorded before and after the manipulation. It is rarely conducted in business research area, because it has a
problem with getting a required level of control when it comes to the organizational behaviour (Bryman & Bell, 2011, p. 45).
There are two types of experiment: laboratory, which occurs in the laboratory and field, which is conducted in the real area, a working place, for example. We are not going to conduct an experiment in our thesis project; therefore we go further to the next research design, which is cross-sectional (Bryman & Bell, 2011, p. 45)
Cross sectional design is engaged with the generating of data on more than one case at single point in time with two or more variables, which are then tested for the existence of association between them (Bryman & Bell, 2011, p. 53). The collection of data is usually conducted with the help of surveys, but there are some other means like observations, content analysis, statistics and so on. Survey method is a very common strategy that helps to generate a large amount of information from a sample of population with the help of questionnaires, structured interviews or observations (Saunders et.al, 2000, p. 94). Cross sectional design is widely used together with quantitative research strategy, but there are situations when the qualitative one is involved too, such as interviews (Bryman & Bell, 2011, p. 57). This strategy is very popular among research projects because it is time-constrained (Saunders et al., 2000, p. 96).
Longitudinal design is conducted in the same way as cross sectional design, but with one difference of re-performing it in several occasions. There are two types of longitudinal design: panel and cohort studies. With panel data the sample is usually selected randomly nationally and data is collected on at least two occasions. The cohort study is focused on the entire group of people or randomly selected based on certain characteristics of a sample, like being unemployed or having the same date of birth. This type of design is not very popular within the business research. Longitudinal design helps to identify and explain social changes that might exist over time (Bryman & Bell, 2011, pp. 58-59).
Another important type of research design is case study, which focuses on the detailed analysis of a single case. It is a very popular type of business research in studies of a workplace or an organization, for example. Case study is widely used in quantitative and qualitative research strategies. But when it is used with quantitative approach there might be some complications in terms of whether the study should be a case or a cross-sectional one (Bryman & Bell, 2011, p. 59). This research design is useful in finding out the answers to questions like “how”, “why” or “what” (Robson, 1993, p. 44).
There are different types of case studies like critical, unique, revelatory, typical and longitudinal ones. Critical case is having a clear hypothesis, which is then tested, and a case design is used in order to enhance the understanding of certain situation examined. Unique case studies focus on extreme cases; revelatory ones on phenomenon which was not studied before; typical cases study examples of everyday situation; and longitudinal ones are interested in how the situation might change over time (Bryman & Bell, 2011, p. 62). Data collection in case study might be various such as questionnaires, interviews, observations and etc. (Saunders et al., 2000, p. 94).
The last research design we would like to present is comparative design, which studies two or more identical cases with similar methods. Comparative study simply matches two or more similar cases in order to understand specific issues or phenomena. Typical
application of comparative analysis is conducted cross-culturally or cross-nationally. It might be used in both quantitative and qualitative studies. Usually it consists of two examples and data is gathered with the help of cross-sectional design (Bryman & Bell, 2011, p. 63).
Research design Is... Method
Experimental − treatment and control group − experimental manipulation − 2 types: laboratory and field
− observation
Cross-sectional − generating data on more than one case in one point in time
− survey − observation − content analysis − statistical analysis Longitudinal − generating data on more
than one case in several occasions
- survey − observation
− ethnographic research − statistical analysis Case study − detailed analysis of a single
case
− useful in finding answers to questions “how”, “why”, “what”
− study of workplace or organisation
− survey
Comparative − direct comparison between
two or more cases − interview − ethnographic research Table 2. Research design
Source: Bryman & Bell, 2011, p. 68
In our degree project, we consider that cross-sectional design as the most suitable, since we are going to conduct an analysis of association between business composition and FD at one point in time. We are going to use the recent available financial year of published annual reports of the selected sample of companies. We are not going to conduct our studies on more than one occasion, thus longitudinal design does not work for our research. As we have mentioned above experimental design is not suitable for us since we are not going to conduct an experiment with treatment and control group. This paper is not a case study, since we are not focusing on a certain company, industry or phenomena in a certain country. We are going to test the relationship of board composition and FD of the whole population since we are going to take all the listed companies in Denmark and Sweden. We suppose that our degree project might have some features of comparative design, since we might compare the collected data cross-nationally.
2.5 Research method
Research method is the technique for collecting data. There might be a collection of data through surveys, interviews, observations or documents, newspapers, etc. Research method is directly related to the various research designs (Bryman & Bell, 2011, p. 41). We are going to collect data from companies’ annual reports, as we have mentioned earlier. Those reports according to Saunders et.al (2000, p. 190) are considered as secondary data.
Within this group there are three main sub-groups of secondary data like documentary data, survey-based and accumulated from multiple sources. Documentary secondary data is frequently used in research studies, where primary data collection might also take place. According to Saunders et.al research based only on the secondary data can be considered as archival research. Documentary secondary data is usually gathered from administrative and public records, annual reports to shareholders or correspondences. It can also include books, articles and journals. Documentary data provides a possibility to conduct quantitative strategy by using the statistical measures or qualitative one, where for example managers’ behaviour might be investigated. Surveys based on secondary data are usually questionnaires that have been analysed. Survey consists of three main types, such as censuses conducted by governments; continuous surveys, excluding censuses, which are repeated during several occasions; and ad hocs, which are done one point in time and are more specific in nature (Saunders et.al, 2000, pp. 190-193).
Data collection method Source
Documentary − administrative and public records
− annual reports
− books, articles, journals, correspondence
Survey-based − questionnaires
Accumulated from multiple sources − multiple sources
Table 3.Types of secondary data collection
In our research paper we are going to conduct archival research with the help of secondary documentary data (Saunders et al., 2000, pp. 92-95). Archival research method is used, since we are going to collect required data through annual reports for the recent financial year of companies, which are included in our sample from Swedish and Danish markets. That is why we consider it is not vital to explain other methods, which do not characterise our research. Those companies will be defined with the help of Amadeus database, which will help us to identify two extreme groups: Distressed and Healthy companies.
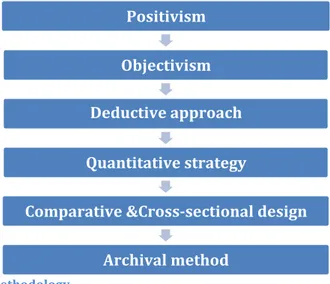
As we have mentioned above, our research design will be mainly cross-sectional with some features of comparative design. We are going to conduct a quantitative analysis based on the secondary data collected from annual reports of listed companies in Sweden and Denmark. Through that we will be able to calculate Altman’s Z-scores and define two extreme groups of companies, financially Distressed and Healthy ones. The financial reports of those companies will be used later on in order to find the information concerning board composition. We have chosen the archival method of data collection since we are not focused on the direct contact with companies within our segment, because it is time-consuming and expensive. Our segment is spread around Sweden and Denmark, which makes it more complicated in terms of language barriers. In addition, financial reports provide all information that we needed for the conduction of our research paper. Annual reports are updated, well structured and it is easy to access through the companies’ websites.
2.6 Literature and Data source
There are three types of literature sources: primary, secondary and tertiary. Primary sources are basically the ones where the information was published or provided initially