VTlnotat
No:
TF 52-11
1
Date: 1988-11-30
Title: MEASUREMENT OF ROAD SURFACE TEXTURE IN NEW ZEALAND
- STUDIES OF TWO-COAT SEALS IN LOWER HUTT AND TEST SURFACES USED FOR ROLLING RESISTANCE MEASUREMENTS
Author: Ulf Sandberg
Division: Road User and Vehicle Division
Project No:
Project title: Relationship Between Tyre/road Friction and Surface Texture
Sponsor: Road Research Unit, National Roads Board, Wellington '
Distribution: free / restricted /
T1!? ,ägna/7 frank_
Statens vag- och trafiklnstltut
, Pa: 5u81 01 Linköping. TeI:_013-2Q40__0Q. Telex 50125 VTISGIS. Telefax 013-14 14 36
CONTENTS 1 2.1 2.2
4.1
4.2
4.3
4.4
4.5
6.1 6.2 10 11 12 INTRODUCTIONTEST SURFACE DESCRIPTION Rolling Resistance Studies
Studies of Two-Coat Seals in Lower Hutt
MEASUREMENT AND ANALYSIS EQUIPMENT
MANUAL FOR INTERPRETATION OF THE TEXTURE DATA Units used by VTI for describing laser texture measurements
Printout of texture spectrum analysis
Explanations to the texture spectral tables and diagram
What the measures describe
Estimated precision of the texture values RESULTS: TEXTURE SPECTRA
RESULTS: OVERALL TEXTURE VALUES
Actual measurements
Predicted texture depth according to the sand circle method and the TRRL Mini Texture Meter
COMPARISON WITH THE LASER RST MEASUREMENTS COMPARISON OF MEASUREMENTS IN SWEDEN AND NEW ZEALAND REGARDING RELATION BETWEEN FUEL
CONSUMPTION AND ROAD TEXTURE
ESTIMATED ROAD NOISINESS LEVEL (ERNL)
COMPARISON WITH OTHER ROAD SURFACES MEASURED IN NEW ZEALAND
COMPARISON WITH EUROPEAN ROAD SURFACES ACKNOWLEDGEMENT
APPENDIX: Profile Measurement Equipment (6 pages)
Page \ D \ D O \ O \ 12 14 15 25 25 25 27 28 29 31 33 33
l INTRODUCTION
During the author's visit to New Zealand in February - April 1988 with the
purpose to study the relation between road surface texture and tyre/road friction, it was requested to measure the macrotexture of some test surfaces outside the main programme.
Since the time schedule appeared to allow this, such measurements were actually conducted. The measurements included two parts for different
purposes:
l. Tests surfaces for rolling resistance studies. Three test surfaces used
within the Research Project 52: Investigation of Tyre/road Interac-tions, conducted by Works - Technical Services of the Central Labora-tories in Lower Hutt, under the management of Mr. P.D. Cenek. On these three surfaces, rolling resistance measurements had previously
been made (or were to be done) and it was judged worthwhile to
include some texture measurements to more accurately define the
surfaces and give possibilities to compare with other investigations.
Another reason, although secondary, for these measurements was that some comparison with the VTI Laser RST vehicle which was at the same time in New Zealand would be possible.
In the result presentation, these three surfaces are named NR-...
2. Studies of two-coat seals in the Lower Hutt area. For Mr. L. Houghton
of Lower Hutt City Council, macrotexture measurements were made
on three two-coat seals (of French type origin) and one ordinary
single-coat chip seal. As the author understood it, it was desired to compare these, to some extent experimental two-coat seals, with more common wearing courses in New Zealand and with (possibly) a corresponding European surface.
In the result presentation, these four surfaces are named NL-...
This Note presents the result of these studies. It contains a quite extensive general part describing the interpretation of the data. If it is not desired to penetrate into details, it is possible for the reader to skip this part and go directly to the result presentation.
However, depending on future use of the data, it may be useful to have all the major results and a manual for their interpretation collected as in this
2.1 NRl NR2 NR3 2.2 NLl NLZ NL3
TEST SURFACE DESCRIPTION Rolling Resistance Studies
Test site No. 6 in the Project No. 52. It is a smooth-textured Asphaltic Concrete, mix 10, layed 1969. Although it had been exposed to a very high traffic volume it was in good condition with a rather uniform texture. It was one of the smoothest surfaces to be found on high-volume roads in the Greater
Wellington Area. Measurements were made 1988-03-10 on 10
locations in the left wheel track.
Test site No. 1 in the Project No. 52. It is a very rough-textured Grade 2 Chip Seal, sealed approx. one year before. Some tracking was observed. Measurements were made 1988-03-11 on 10 locations a little to the right of the left wheel track. One
measurement was also made in the left wheel track.
Test site No. 5 in the Project No. 52. It is a newly laid Porous Friction Course Surface, max chipping size 10 mm (??). Very little tracking could be observed. Measurements were made 1988-03-11 on 10 locations in the left wheel track and at one
location between the tracks.
Studies of Two-Coat Seals in Lower Hutt
Two-coat seal on Taita Drive in Lower Hutt. Grade 4 as first coat and grade 6 as second coat. Measurements on 5 locations in
left wheel track (no visible tracking).
Two-coat seal on Stokes Valley Road in Lower Hutt. Grade 3 as first coat and grade 6 as second coat. Measurements on 5
locations in left wheel track (no visible tracking).
Chip seal (single), grade 3, on High Street in Lower Hutt.
NL4 Two-coat seal on Pinny Ave in Lower Hutt. Grade 5 as first coat
and sand as second coat. Measurements on 5 locations in left
wheel track (no visible tracking).
3 MEASUREMENT AND ANALYSIS EQUIPMENT
Please refer to Appendix l regarding the measurement equipment. The analysis was made by the following procedure and equipment:
1. The recorded tape (profile signal) was replayed on the TEAC recorder
and the signal sampled at 500 Hz, fed into a HP 9000 series 300
computer, and stored on 3,5" microdiscs.
2. Then the profile signal was c0rrected for any possible slope of its mean level and c0rrected (by linear interpolation) for any obvious disturbances in the profile due to drop-out effects or similar. This correction is generally not necessary but it is done partly for "cosmetic reasons". Special "texture depth" calculations are also
made. The mean level was set to zero.
3. The next step was to feed the signal, representing a l m long profile recording, from the computer through a digital/analog converter to a
third-octave band spectrum analyzer of type BöcK 2131. This is always
made so that the l m long recording is fed to the spectrum analyzer in
15. Then 10 mm of texture wavelength corresponds to 100 Hz, for example.
4. The spectrum was then transferred from the analyzer back to the computer, after which it was averaged with other spectra obtained on
other locations within the same test site. The averaging was made on
the basis of linear power values, not log values.
5. Printout was then made and the result presented as displayed in the following chapters.Printout is also possible for individual runs as well as for individual profile recordings before and after corrections.
4
#.l
MANUAL FOR INTERPRETATION OF THE TEXTURE DATA Units used by VTI for describing laser texture measurements
The profile curve can be mathematically processed in many more or less
meaningful ways. In principle, this can be done in three stages:
Mean, standard deviation or rms values of the profile curve are
calculated. Special algorithms may also be used to calculate simulated (sand-patch) texture depth. This is, e.g., employed in the TRRL Mini
Texture Meter and it gives a single value easy to use butcontaining
little information. See further next section.
The spectrum of the profile curve is calculated, either by FFT or
filtering techniques. In this case, filtering in third-octave bands is
employed. The result is a spectrum as displayed in next section. This
contains a lot of information.
From the spectrum, overall values can be derived which are calculated
by adding together wider bands in the spectrum. This is a combination
of the principles 1 and 2 above, i.e. a few single values are calculated more or less sophisticated to facilitate the practical use of the spectrum. See below.
The following overall spectral values are or have been used at VTI: the first part are values used before PIARC defined texture limits, the second part are values used lately based on the PIARC definitions. For future use, only the latter should be considered.
Descriptor Name Description
TM Macrotexture The amplitude (rms displacement) of (m) the profile curve within and includingwavelengths 2-100 mm (third-octave
bands)
It describes the surface roughness
caused by small and large chippings
in the pavement; asperities and
surface features which are easily apprehended by the human eye and which are in the order of size of less
(dB rel. 10-12 m2) (dB rel. 10-12 m2) (m) (dB rel. 10'12 m2) (m) (dB rel.
10-12 m2)
Macrotexture level Rough texture Rough texture level Fine texture Fine texture level Waviness Waviness levelAs above but expressed as a loga-rithmic value:
T 2
MT
MAs TM, but the shortest
wave-length is 10 mm. Only the roughest texture is concerned, not features as chipping angularity, sharpness, etc. See analogy with LM
As T , but excluding the rough tex-ture as above (TR). Constitutes the
macrotexture roughness caused by
very small chippings (less 'than 8 mm)
and the sharpness and angularity of the chippings
See analogy with LM
ln principle as TM, but including
wavelengths 125-500 mm (third-octave bands). It describes the short-scale roughness caused by
very rough stones, pot holes, lost chippings, corrugations, uneven base, etc.
The values hereafter are those used after the PIARC Committee on
Surface Characteristics defined the major texture terms.
Descriptor Name TMa Macrotexture (m) LMa Macrotexture level (dB rel.
10'12 m2)
TMe Megatexture (m) LMe Megatexture l l (dB rel. eveivJZnü)
DescriptionThe amplitude (rms displacement) of the profile curve within and including wavelengths 2-50 mm (third-octave bands)
It describes the surface roughness caused by small and large chippings
in the pavement; asperities and
surface features which are easily apprehended by the human eye and which are in the order of size of less
than the tyre/road contact zone As above but expressed as a loga-rithmic value:
T 2 T 2
Ma : 20°10 Ma
10-12 g 10-6
LMa = 10-log
In principle as TMa, but including
wavelengths 63-500 mm (third-octave bands). It describes the
short-scale roughness caused by
very rough stones, pot holes, lost
chippings, corrugations, uneven base, etc.
See analogy w1th LMa
In addition, two more spectral levels have been found to be of use for
evaluating traffic noise Characteristics namely the spectral levels obtained by adding (on power basis) the third-octave bands at 4, 5 and 6.3 mm (gives L5 mm) and 63, 80 and 100 mm (gives Lgo mm).
When one overall value for macrotexture is desired, TMa or L
preferred.
are
The logarithmic levels are practical to use and have several advantages,
but may be less easy to relate to everyday units by the road engineer than the rms values expressed in mm or m.
4.2 Printout of texture spectrum analysis
The next page shows a typical printout of a texture spectrum analysis. Numbers in circles in the printout refer to the following explanations.
4.3 Explanations to the texture spectral tables and diagram
See the typical printout on the next page. Explanations follow here, referring to the numbers in the printout.
l. "Mast" means "Macrotexture, stationary texture measurement (we have also other methods; however, not used here).
2. N means New Zealand
R means Rolling Resistance Test sites
2 is the number of the test site within the particular test
programme
AV means average, i.e. it is the average of all the test locations within the test site (normally 5 or 10)
3. X % of the profile length has been corrected before final analysis. The reason is mostly that the light spot has been shadowed on very steep slopes in the profile or in deep troughs.
4. This is a future option for cutting away the (deeper) part of the profile which is not expected to be in contact with tyres. Not used so
far.
5. The RMS value is the root mean square value around the mean level of the profile curve over the entire l m measuring length. It is sensitive to both waviness and macrotexture, mostly to the latter.
lO
Eiizêaiz- i:eer:1:L1r*ee nneeeaEsLir*eenqeer11: car*c11:c c:c3].
Measurement stered on "MEHSBB ", record E596 88.3 dB(M)
Hnalysis made on the 18 Nov 1988 at 15:55zø3 59.2
85.7
Type of measurement: Mest C) 57.1
Identification: NRZ-FN @ ® 54.3
Process: Corrected: 3.842 Cut area: 0 mm^2 57.5
RMS: 2.24 m Text. depth(peak): 3.ê8 mm 81.5
Text. deptthm: 3.52 mm @
55.7
Hver. of 10 runs. RR Test site rough (no.l), between wheel tracks il,
mm dB mm dB MM dB 125ø.0 27.5 50.0 54.7 Z.ø® 41.5 Iøøø.0 40.3 4ø.ø 54.5 1.59 39.9 80®.ø 35.2 31.5 58.1 1.25 37.5 53@.ø 52.5 25.@ 57.1 1.00 34.8 5ø0.0 49.8 20.® 57.7 ø.8® 32.5 40%.0 47.5 16.0 55.8 ø.63 29.7
315.ø
sø.s
12.5
55.8
ø.5ø
27.1 ®
250.ø 48.5 10.ø 53.9 0.4Q 28.3 Zøø.ø 52.5 8.0 52.2 0.32 28.5 150.9 Sø.7 5.3 Sø.8 6.25 28.9 125.0 52.7 5.ø 49.9 0.2ø 33.ø løø.0 51.9 4.® 47.2 6.16 14.4 8ø.ø 53.5 3.2 45.8 ø.12 14.4 53.ø 52.7 2.5 44.0 0.10 14.4 M m 60 d _ m - THe_ " ä p 10 :§5: i i ?sei T i see ggêfâêfêäêäääå 500 200 100 50 20 10 5 2 1 0.5 0.2 [mm]Horizontal scale: texture uaveienqth [nn] Uertical scale: 10 68 to 70 dB
[nnJ-scale refcrs to input data speed 1 n/sec Shadoued bars park L05 and L00
Black har narks 10 nn uauelength
dBtU) dB(R)
dB(F)®
dB(5mm) dB(8øM dB(Me) dB(Ma) Byggl 6 Kjgr 2131 settiggg Hueraging time 1 s Input attenuation 60 dB Rueraging start lin. Hnalyzer lovar limit 10 dB Filter handuidth 1/3 octauem@
@@
frequency range 0.8 02 - 10 kHz Input spectrun function contin. Svedish Road and traffic Research Institute; UTI, 20 Nov 1908
6. 10. 11. 12. 13. 14. 11
This texture depth is a simulated sand-patch texture depth calculated from the profile curve using an algorithm developed by Dr. G. Descornet of the Belgian Road Research Center. Very recently it turned out that the information given to us was incomplete; thus the values are not really correct. They are somewhat overestimated, especially for smooth surfaces.
This is equivalent sand-patch texture depth calculated from the dB(M) value above. The calculation is based on old regression data
from Sweden. It may need updating now that we have more data. In principle it is rather similar to the TRRL Mini Texture Meter's sensor
measured texture depth (SMTD).
LM value expressed in dB(M). Called "Macrotexture Level" but
according to an old procedure which is retained for comparison with older data. Will be replaced by LMa.
LW value expressed in dB(W). Called "Waviness Level". Will be replaced by LMe.
LR value expressed in dB(R). Called "Rough Texture Level". Has no '
real significance at present but is retained for comparison with old
values.
The same is valid for I.,F ("Fine Texture Level").
This is the texture level for the octave band centered around 5 mm wavelength, called ijm. 15 proposed in a tentative standard for tyre noise measurement as one value representing noisiness of
reference surfaces for noise tests.
This is the same as 12, but for 80 mm wavelength, Lgomm. Both
these values are proposed in the tentative standard. Can be used to calculate "Estimated Road Noisiness Level" (ERNL), see Chapter 9.
LMe value expressed in dB(Me). Called "Megatexture Level". Based
12
15. LMa value expressed in dB(Ma). Called "Macrotexture Level". Based
on definition of macrotexture by PIARC.
16. Text identifying the measuring site and the averaging.
17. The complete texture spectrum. See also the diagram below. The measuring probe gives valid measurement down to about 2 mm wavelength. Do not consider the dotted part of the diagram.
18. Settings on the spectrum analyzer. Not of interest here; just an internal check that no mistake was made during analysis.
4.4 What the measures describe Macrotexture and megatexture
The LMa value (which can be converted to linear rms value by the
formula given earlier, should this be preferred) gives an overall
impres-sion of the macrotexture, i.e. the texture made up bythe chippings in the surface or the grooving as regards grooved cement concrete
sur-faces. A big influence on the LMa value is recorded when the chippings
have a relatively large spacing between them. Sometimes it is desired that macrotexture should be high and sometimes that it should be low. The LMe value gives an overall impression of the megatexture, i.e. the
texture associated with e.g. pot-holes, waviness, inhomogenities in the
chipping distribution (loss of chippings etc). One could say that generally
it is desired that megatexture be as low as possible, because it induces
noise, creates rolling resistance, and may (?) reduce friction and
vibra-tions.
The spectral diagrams actually give a very comprehensive description of the surface texture. Apart from the possibility of deriving macro- and megatexture from them, they give information regarding the sharpness or angularity of the surface chippings. Generally, high angularity or sharpness result in high spectral levels in the wavelength range 2-6 mm.
13
should be related to this surface feature. To quantify this in the best way, however, more studies are necessary.
Another information in the spectral diagram is the average spacing bet-ween chippings. Basically, this can be determined as approximately equal to the wavelength at the typical peak in the spectrum in the range 5-50 mm. Usually, also the max chipping size can be controlled by looking at the peak in the spectrum, see the special section below.
One could also see it the other way round: How will various chipping sizes and spacing distributions result in different spectra?
Principle to determine dominating chipping size
The wavelength of peaks in the spectrum refers to average spacing bet-ween peaks in the profile. Generally, this can be used to estimate maximum chipping size using these principles:
1. For surfaces with only one major maximum chipping size.
l. Look in the texture spectrum for the wavelength of the highest
peak in the range 2-40 mm. If two adjacent bands have the same level, select the one with shortest wavelength.
2. Subtract approx. 20 % from this wavelength and you obtain the chipping size.
3. If there is another, slightly lower peak, then it is possible that this one indicates the right chipping size instead.
II. For surfaces with two or more major max chipping size fractions
(double chip seals, etc).
1. Do as above (1) to obtain the max chipping size of the largest
f raction.
14
3. Subtract approx. 20 % from this peak's wavelength and you obtain the max chipping size of the smaller fraction(s).
4. If there is another, slightly lower peak, then it is possible that this one indicates the right chipping size instead.
III. For surfaces with much spacing between the chippings.
On such surfaces the chipping size will be more or less
overesti-mated. The wavelength of the peak corresponds to the average spacing (c-c) between the chippings.
IV. On grooved surfaces or surfaces with pronounced periodicity.
1. The wavelength of the peak should correspond to the spacing or periodicity.
4.5 Estimated precision of the texture values
If the number of test locations within each site (test surface) is 10, then the 95 % confidence intervals of the average levels are approx. these:
- For LMa values: i 0.8 dB
- For LM values: f 1.5 dBe
- For spectral levels at_<_ 10 mm wavelength: f 1.0 dB
- For spectral levels atapprox. 100 mm wavelength: i 2.0 dB
- For spectral levels at approx. 500 mm wavelength: i' 4.0 dB
The 95 °/o confidence interval of the average texture depth TDLM is
approx. i 10 % of the average.
When the number of locations is 5, the confidence intervals above are increased by approx. 50 %.
5
15
RESULTS: TEXTURE SPECTRA
On the following nine pages the printouts of the averaged texture spectra for the tested surfaces are presented:
1. 2a. 2b. 3a. 3b. Surface No. NR-l.
Surface No. NR-l. Consider this one as the most accurate for this
surface.
Surface No. NR-Z, one measurement in the left wheel track. Surface No.NR-B, in wheel track.
Surface No. NR-B, between wheel tracks. This one was made just for curiosity. Not as accurate as 3a. Represents the surface before it was compacted by traffic.
Surface No. NL-l. Surface No. NL-Z.
Surface No. NL-3 Surface No. NL-4.
l6
Staf- texture meañurament protücol
Measurement stored en MEHSBS , record 8579 43.1 dB(M)
Hnalysis made On the 18 NOV 1988 at 13:39:38 4®.4 d8(w)
41.4 dB(R)
Type of measurement: Mast 38.6 dB(F)
Identificatiøn: NRlñV 35.2 dB(5mm)
Process: Corrected: Ö 2 Cut area: ø mm^2 32.2 dBt8øMm)
RHS: .33 mm Text. depth(peak): .85 mm 41.ø dB(Me)
Text. depth(LM): .18 mm 42.7 dB(Ma)
Hver. of 1® runs. RR Test site smooth (no. 8), in wheel tracks. Locations 1*B, 8w11
mm dB mm dB mm dB 125ø.ø 14.9 5@.ø 29.1 Z.øø 28.4 1øøø.0 27.8 40.0 3@.1 1.80 25.5 80ø.0 23.9 31.5 31.2 1.25 24.1 EBø.® 39.8 ZS.® 32.8 1.00 22.1 5øø.0 36.8 Zø.ø 33.ø ø.8ø 2ø.8 40ø.® 32.4 15.0 32.1 ø.83 18.0 315.8 31.8 12.5 32.5 @.50 18.6 25%.0 28.5 10.ø 32.5 0.4ø 18.4 Zøø.® 29.8 8.® 31.2 6.32 18.3 1B®.ø 3G.ø 8.3 31.5 0.25 18.8 125.ø 26.5 5.® 3ø.5 G.Zø 18.7 1øø.ø 27.3 4.6 28.9 6.15 4.1 8ø.ø 27.2 3.2 28.5 ®.12 4.1 53.6 27.8 2.5 27.7 0.10 4.1 dB m 50 - t. -t i-m - _ h i I.. h 30 - nu _.. »1:a m " F r-" .4 L'
'5 å
i i i :L ;l ;Q :l ;2
:-0 _ 11 T i 1 i '5:' i! E' :fri .j if' 5_ :i :§75 :3 : 500 200 100 50 20 10 5 2 1 0.5 0.2 [nn]Horizontal scale: Texture uauelength [nn] ngel B Kjgr 2131 settigg§
Uertical scale: 0 dB to 60 dB Rueraging tine 1 s
[enl-scale refers to input data speed 1 n/sec Input attenuation 50 dB Shadooed bars nark L05 and LBQ Hueraging start lin. Black bar narks 10 nn uauelength Rnalyzer lower linit 0 dB
Filter bandoidth 1/3 octaue
Frequency range 0.8 Hz - 10 kHz Input spectrun function contin.
l7
Stat.. tex-ture meaaureme'n't [Jr- 012042301
Measurement stored en "MEHSSS ", record ©59® 85.3 dB(M)
Analysis made on the 18 Nov 1988 at 18:55:®3 59.2 dB(U)
65.7 dB(R)
Type of measurement: Masi 57.1 dB<F>
Identification: NRZ-HV 54.3 dB(5mn)
Process: Corrected: 3.84Z Cut area: ø mm^2 57.5 dB(8®mm)
RMS: 2.24 mm Text. depth(peak): 3.45 mm 81.5 dB(Me)
Text. depth<LM): 3.62 mm 85.7 dB(Ma)
ñver. of 10 runs. RR Test site rough (no.1), between wheel tracks
mm dB mm dB mm dB 1250.0 27.5 50.0 54.7 2.®® 41.5 løøø.0 49.3 40.ø 54.5 1.6ø 39.9 800.9 35.2 31.5 58.1 1.25 37.5 530.ø 2.5 25.ø 57.1 1.06 34.8 50®.0 48.8 20.0 57.7 ø.8® 32.5 4øø.ø 47.5 IB.® 58.8 ø.83 29.7 315.ø 50.8 12.5 55.8 ®.5ø 27.1 25®.ø 49.5 16.0 53.9 ø.4ø 28.3 Zøø.ø 52.5 8.ø 52.2 @.32 28.5 ?Bø.ø 5@.7 5.3 5®.8 ®.25 28.9 125.0 52.7 5.ø 49.9 0.2ø 33.0 Iø0.ø 51.9 4.0 47.2 ®.18 14.4 8@.0 53.5 3.2 45.8 ø.12 14.4 63.9 2.7 2.5 44.0 ø.1ø 14.4 M m m -
-..
gr*
..
50 _
"_ sj???
..
T
10 - ;g E? "1.: F10 x 2 I fäåaê I T E; säga! I» tälåigT;i;i §r55 ?i
500 200 100 50 20 10 5 2 1 0.5 0.2 nn]
Horizontal scale: Iexture uauelength [nn] Bgyel 0 Klar 2131 settings Uertical scale: 10 dB to 70 dB 0ueraging tina 1 s [nnl-scale refers to input dataspeed I n/sec Input attenuation 60 dB Shadoued bars nark [05 and L00 Hueraging start lin. Black har narks 10 nn uauelengih Hnalyzer lower linit 10 dB
Filter handuidth 1/3 octaue
frequency range 0.8 Hz * 10 kHz Input spectrun function contin. Soedish Road and lraffic Research Institute, Ull, 28 Nov 1988
18
Stat_ texture measurement protmcol
Measurement stered on MEASBB ", record 8591 54.2 dB(M)
Hnalysis made on the 18 Nov 1888 at 17:01:58 58.5 dB(U)
53.5 dB(R)
Type of measurement: Mast 55.8 dB(F)
Identification: NRZ-11 53.4 dBtSmm)
Process: Corrected: 2.552 Cut area: 8 mm^2 55.2 dB(88mm)
RMS: 1.77 mm Text. depthtpeak): 2.9 mm 50.2 dB(Me)
Text. depthtLM): 2.82 mm 83.6 dBtMa)
RR Test site rough (no. 1), in wheel track
mm dB mm dB mm dB 1258.8 28.4 58.8 51.8 2.88 39.1 1880.8 28.8 48.0 52.5 1.50 37.7 888.8 38.4 31.5 55.1 1.25 34.8 838.8 48.7 25.8 53.8 1.88 31.8 580.8 45.7 28.8 54.6 8.80 29.2 488.8 43.5 18.8 53.9 8.83 28.1 315.8 49.4 12.5 54.7 0.58 23.5 258.8 51.4 18.0 53.0 8.48 22.8 288.8 58.4 8.8 50.9 8.32 23.1 158.8 52.2 5.3 58.5 8.25 25.1 125.8 51.4 5.8 48.4 8.28 31.3 180.8 49.5 4.8 45.5 8.15 14.4 88.8 58.4 3.2 43.4 8.12 14.4 83.8 51.1 2.5 41.2 8.10 14.4 ü m 60'- i_
'
,herr e
'
W -
d F_ 1--
:- ?E5:är
å e
:3. 5:2: '-r
W -.71"- t-_J3 Lu 500 200 100 50 20 10 5 2 1 0.5 0.2 [nn]Horizontal scale: Iexture uauelength [nn] 0rüe1 0 Kjer 2131 settings Uertical scale: 10 dB to 70 dB Hueraging tine 1 s [nnJ-scale refers to input data speed 1 n/sec Input attenuation 60 dB Shadoued bars nark L05 and L00 Hueraging start lin. Black bar narks 10 nn uauelength 0nalyzer louer linit 10 dB
Filter banduidth 1/3 octaue
frequency range 0.8 Hz - 10 kHz
Input spcctrun function contin.
19
Stat- texture measurement prmtücül
Measurement stored en "MEHESB ", record ®5®1 59.4 dB(M)
Hnalysis made on the 18 Nov 1988 at 19:®7:37 50.3 dB(U)
58.ø dB(R)
Type of measurement: Mest 53.9 dB(F)
Identification: NRZ-HV 51.1 dB(5mm)
Process: Corrected: 8.651 Cut area: ø mm^2 49.6 dB(8ønm)
RHS: I.øB mm Text. depth(peak): 1.55 mm 52.? dB(Me)
Text. depthtLM): 1.58 mm 59.0 dB(Ma)
Hver. of 9 runs. RR Test site PFC (no. 4/5), left wheeltrack
mm dB mn dB mm dB 1250.ø 17.5 50.6 45.6 Z.ø® 39.4 tøø0.ø 29.3 4ø.ø 47.4 1.5ø 37.4 8øø.® 25.2 31.5 45.3 1.25 35.4 530.ø 42.4 25.ø 48.3 1.øø 32.9 Sø0.ø 41.3 Zø.ø 49.4 ø.80 30.7 4øø.ø 39.0 18.9 49.4 9.83 28.2 315.0 43.1 12.5 49.5 0.5ø 25.5 250.@ 43.1 lø.ø 49.3 ®.4ø 24.5 Zøø.ø 41.8 8.® 48.8 0.32 24.8 IBø.ø 41.4 5.3 47.5 ø.25 26.8 125.ø 42.5 5.ø 48.2 0.20 29.4 100.ø 42.7 4.0 44.8 0.15 14.1 86.0 45.2 3.2 43.5 ø.12 14.1 53.6 44.4 2.5 41.2 ®.lø 14.! M N 60 1- .-M - __ W w -m - -m
20
-m 1 I ääåy 1 E eee 1:;*;g;;1;;g;; 500 200 100 58 20 10 5 2 1 0.5 0.2 [on]Horizontal scale: Iexture uauelengtn [nu] Brüel 8 Kjar 2131 settings Uertical scale: 10 dB to 70 dB ñueraging time 1 s [nal-scale refers to input data speed 1 n/sec Input attenuation 60 dB Shadooed bars park LUS and LUB Hueraging start lin. Black har oarks 10 om oauelength Hnalyzer lower linit 10 dB
filter banduidth 1/5 octaue
frequency range 0.8 Hz - 18 kHz
Input spectrun function contin.
20
Stat- texture measurement Drotocol
Measurement stered on "MEHSBB , record ®6@4 80.1 dB(M)
ñnalysis made on the 18 Nov 1988 at 19:24:17 51.2 dB(U)
58.8 dB(R)
Type of measurement: Mast 54.2 dB(F)
Identification: NRBavZ 51.5 dB(5mm)
Process: Corrected: 6.8 Z Cut area: ø mm^2 56.2 dB(8øMm)
RHS: 1.11 mm Text. depth(peak): 1.43 mm 53.7 dB(Me)
Text. depth(LM): 1.72 mm 59.5 dB(Ma)
Hver. of 2 runs. RR Test site PCF (no. 4/5), between uheeltracks
mm dB mm dB mm dB 1250.6 15.9 50.® 49.5 2.00 39.8 100G.ø 28.8 40.6 47.5 1.86 37.5 Bøø.ø 28.1 31.5 48.1 1.25 35.3 539.0 43.8 25.6 47.3 1.00 32.4 50ø.ø 41.5 20.ø 48.8 ø.80 29.8 40ø.ø 41.6 18 G 5ø.4 6.53 27.ø 315.ø 48.3 12.5 5ø.2 ø.50 23.7 ZSø.ø 4ø.5 10.ø 49.8 ø.40 22.5 2ø®.ø 37.8 8.0 48.8 0.32 23.2 1Bø.ø 44.5 6.3 48.5 6.25 26.8 125.® 42.1 5.0 48.5 ø.20 29.8 1øø.ø 44.4 4.ø 44.5 ø.16 14.1 86.6 44.3 3.2 43.5 0.12 14.1 83.® 47.ø 2.5 41.1 0.10 14.1 M m .4 I-w - L M - - p
_
-wrr
18 - pr" r" __ b-30 Ht?TT'T'T'TITÖ
-10 iii= I I äåef i 2933' ;4;f.;f;sgg iz 5011 200 1011 50 21] 111 5 2 1 [1.5 11.2 [ni-z]Horizontal scale: Iexture uauelength [nn] ngel ä Kjer 2131 setting§ Uertical scale: 10 dB to 70 dB Hueraging tina 1 s [nnJ-scale refers to input data speed 1 n/sec Input attenuation 60 dB Shadoued bars nark LUS ond LBU Bueraging start lin. Black bar narks 10 nu uauelength Hnalyzer loser linit 10 dB
filter banduidth 1/3 octaue
frequency range 8.8 Hz - 10 kHz Input spectrun function contin. Swedish Road and Iraffic Research Institute, 011, 28 Hou 1988
21
Stat_ texture measurement mretecol
Measurement stored on "MEASêB , record 9175 59.8 dB(M)
Hnalysis made on the 24 Oct 1988 at 12:øB:34 55.8 dB(u)
58.8 dB(R)
Type of measurement: Mest 53.0 dB(F)
Identification: NLt-HV 5ø.2 dB(5mm)
Process: Corrected: .Gl X Cut area: ø mm^2 52.5 dB(80Mm)
RHS: 1.28 mm Text. depth(peak): 2.24 mm 57.5 dB(Me)
Text. depth(LH): 1.55 mm 58.9 dB(Ma)
Hver. of 5 runs. mm dB mm dB mm dB 1250.ø 17.1 50.ø 48.6 2.øø 38.7 1øøø.ø 31.7 40.ø 48.7 1.6ø 35.4 80%.ø 27.0 31.5 48.9 1.25 33.7 83@.ø 48.1 25.ø 49.5 1.00 30.8 5øø.ø 48.4 26.6 48.7 ø.80 27.8 40ø.ø 47.2 IB.ø 48.2 ø.53 24.5 315.ø 48.3 12.5 47.5 ø.5ø 21.7 25ø.ø 45.1 Iø.ø 48.2 0.4ø 21.0 Zø@.ø 45.2 8.® 47.5 6.32 21.5 IBø.ø 47.6 8.3 46.5 0.25 25.2 125.0 49.8 5.0 45.3 ®.2ø 29.2 1øø.ø 45.5 4.0 44.1 0.15 14.2 8ø.ø 49.1 3.2 42.8 ø.12 14.2 83.ø 47.9 2.5 41.2 ø.lø 14.2 M m m -W - ' r _
-
"Fr
,
-10 -
"i
F_
-2 t m q å ; ... .. _ 18 - I I .22:1 I I: :i 1:: ?1: L; ;1: 5 5;: 500 200 100 50 20 10 5 2 I 0.5 0.2 [nn]Horizontal scale: Iexture uauelength [nn] Brüel l Kjer 2131 settings
vertical scale: 10 dB to 70 dB Hueraging tine 1 s [nal-scale refers to input data speed 1 n/sec Input attenuation 60 dB Shadoued bars nark LUS and L80 Hueraging start lin. Black bar parts IB nn uauelength Bnalyzer Inner linit 10 M
filter banduidth 1/3 octaue
frequency range 0.8 Hz . 10 kHz
Input spectrun function contin.
22
Stat- texture measurement pretocel
Measurement stored on MERSBS ', record 6179 51.5 dB(M)
Hnalysis made on the 24 Oct 1988 at 12:33:45 59.1 dB(U)
51.1 dB(R)
Type of measurement: Mast 51.8 dB(F)
Identification: NLZ-HV 49.3 dB(5mm)
Process: Carrected: G 2 Cut area: ø mm^2 58.5 dB<8øMm)
RHS: 1.51 mm Text. depth<peak): 2.48 mm 81.1 dB(Me)
Text. depth(LM): 2.ø4 mm 58.9 dB(Ma)
Hver. of 5 runs. mm dB mm dB mm dB tZSø.ø 17.3 50.0 52.4 Z.øø 35.2 tøøø.ø 28.7 4ø.ø 51.7 1.60 34.1 Bøø.ø 3®.4 31.5 50.4 1.25 31.5 EZQ.® 48.2 25.0 51.ø 1.øø 28.3 50ø.ø 48.8 Zø.ø 48.7 ø.8ø 25.7 40ø.0 47.8 IB.ø 47.7 6.83 22.9 315.ø 51.7 12.5 47.6 ø.50 Zø.9 256.0 52.2 tø.ø 47.5 0.4ø 20.5 200.0 49.4 8.ø 45.3 ø.32 26.6 lBø.ø 52.1 8.3 45.1 0.25 23.8 125.ø 50.7 5.® 44.5 ø.2ø 27.9 løø.ø 53.8 4.6 42.3 ø.tB 14.ø 8ø.ø Sø.5 3.2 4ø.7 9.12 14.0 53.® 50.3 2.5 38.5 0.1ø 14.0 dB m m - -50 _ r - '- FA PP_
'-en -
'
_-3 &#-34;
.
r
1 .:1 é 10 i: i I 1 155?? I I 'riff :i: 1: .T .. .41..- . . .. .. L. 500 200 100 50 28 10 5 2 1 0.5 0 2 [om] 5:291 8 Kjgr 2131 settings Hueraging tina 1 s Input attenuation 60 dB Huaraging start lin. Rnalpzer louer linit 10 dB Filter banduidth 1/3 octaue frequency range 0.8 Hz - 10 kHz Input spectruo function contin. Horizontal scale: Iexture uauelength [nn]Uertical scale: 10 dB to 70 dB
[nal-scale refers to input data speed t o/sec Shadoued bars nark LUS and LBU
Black har marks 10 on uauelength
23
Stat- texture meaaurement protocol
Measurement stored on "MEHSEB , record 0185 55.7 dB(M)
Analysis made on the 24 Oct 1988 at 15:57:53 58.2
55.ø
Type of measurement: Meet 57.2
Identification: NL3*HV 54.5
Process: Corrected: 9 2 Cut area: ø 55.8
RMS: 2.13 mm Text. depth(peak): 3.23 mm Eø.B
Text. depth(LM): 3.37 mm 85.] Hver. of 5 runs. mm dB MM dB mm dB 125®.ø 25.8 5ø.ø 54.2 Z.ø0 42.4 Iøøø.ø 35.4 40.6 54.3 1.5ø 4ø.5 8ø0.ø 32.7 31.5 54.7 1.25 39.ø Båø.ø 52.9 25.9 57.1 1.øø 35.4 Søø.ø 48.3 Zø.ø 55.2 ø.8@ 34.4 4ø®.ø 48.7 15.6 55.3 ø.83 32.6 315.ø 51.4 12 5 55.7 0.5ø 29.3 25ø.ø 49.7 lø.® 53.9 ø.4@ 27.9 Zøø.ø 5ø.3 8.ø 51.8 ø.32 27.8 15ø.ø 49.2 8.3 51.8 0.25 29.9 125.® 48.9 5.ø 49.3 ø.2ø 33.3 tø®.0 50.9 4.0 47.7 ø.18 14.1 8ø.ø 52.5 3.2 46.1 0.12 14.1 53.0 52.5 2.5 44.2 ø.10 14.1 70 60 -50 F_ 1.'- -F' F 10 7% _
30
:35:25:31.
-20
éiisåzåzeêiezi.
18 -vgg ' I egna* I i .äåz ;:';âiåfir Tii'
500 200 100 50 20 10 2 1 0.5 0 2 [nn]
Suedish Road and lraffic Research Institute; UII, 28 nov 1988
Horizontal scale: Iexture uaoelength [nn]
Uertical scale: 10 dB to 70 dB
[nnlescale refers to input data speed l n/sec Shadoued bars nark LUS and LSD
Black bar narks IB nn uauelength
dB(U) dB(R) dB(F) dB(5mm) dB(8øMm) dB(Me) dB<Ma)
Brüel 8 har 2131 settings
Rueraging tine 1 5
hmüaümmümdmdB Hueraging start lin. Rnalvzer louer linit 10 dB
Filter banduidth 1/3 octaue
frequency range 0.8 Hz - 10 kHz Input spectrun function contin.
24
Stat_ textura measurement protocal
Measurement stored on "IEHS88 , record 8187 55.8 dB(M)
Hnalysis made on the 21 Oct 1988 at 17:23:59 54.8 dB(U)
55.2 dB(R)
Type of measurement: Masi 48.1 dB(F)
Identification: NL4*HV 45.1 dB(5mm)
Process: Corrected: ø Z Cut area: ø mm^2 51.1 dB(80Mm)
RMS: 1.21 mm Text. depthtpeak): 1.88 mm 55.4 dB(Me)
Text. depth(LM): 1.15 mm 55.5 dB(Ma)
Hvar. of 5 runs. mm dB mm dB mm dB 1250.ø 15.8 50.0 48.3 2.00 34.3 tøøø.ø 25.8 4ø.ø 45.6 1.50 32.8 8øø.ø 28.2 31.5 45.3 1.25 3ø.5 BBø.0 45.3 25.ø 45.3 1.øø 27.7 500.ø 44.7 Zø.ø 48.2 6.86 25.2 4øø.ø 45.3 15.6 45.1 ø.63 ZZ.® 315.6 47.3 12.5 45.2 0.5ø 20.2 ZSø.0 47.7 Iø.0 44.2 0.40 2ø.1 Zøø.® 47.ø 8.0 42.9 ø.32 2®.3 18ø.ø 47.2 6.3 41.7 6.25 22.5 125.0 44.ø 5.6 4ø.t ø.2ø 25.2 1øø.® 47.® 4.ø 38.5 6.15 14.® 8ø.ø 45.8 3.2 38.1 0.12 14.® 83.ø 48.6 2.5 38.3 0.10 14.0 dB m m m L m - b I_ r--F'T ' "rr F "dt-rr" "' 40 - . _ l_- .
30 -
_
é .... ._
20- ;:_V._._.:.:._.., .-19 5 I i ..i. 1 ! i? äñäål ?il'çá ::%;;: ;i :5: 560 200 100 50 20 10 5 2 1 0.5 (1.2 [nn]Brüel R Kjar 2131 settings Hueraging tine 1 s Input attenuation 60 dB Hueraging start lin. ñnalyzer louer Iinit 10 dB filter banduidth 1/3 octaue frequency range 0.8 Hz - 10 kHz Input spectrun function contin. Horizontal scale: chture uauelength [nn]
vertical scale: 10 dB to 70 dB
[nal-scale refers to input data speed I n/sec Shadpued bars nark LUS and L80
Black har marks 10 nn uauelength
25
6 RESULTS: OVERALL TEXTURE VALUES
6.1 Actual measurements
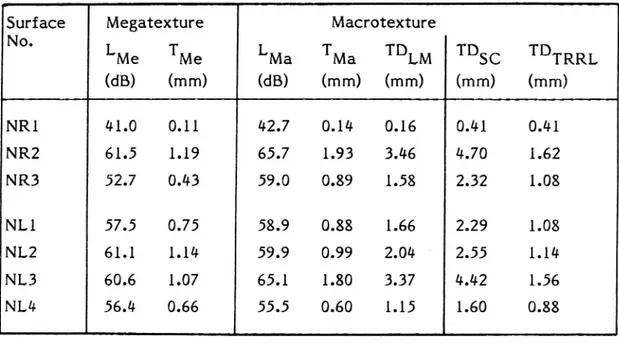
The most important overall texture values are given in Table l below. TDLM
profile recording, see point 7 in section 4.3 above. For the two other TD : Texture depth derived by VTI tentatively from LM, i.e. from the
values, please refer to next section (6.2).
Table l Some overall texture values
Surface Megatexture Macrotexture
No.
LMe TMe
LMa TMa TDLM TDsc TDTRRL
(dB)
(mm)
(dB)
(mm) (mm)
(mm)
(mm)
NRl 41.0 0.11 42.7 0.14 0.16 0.41 0.41 NRZ 61.5 1.19 65.7 1.93 3.46 4.70 1.62 NR3 52.7 0.43 59.0 0.89 1.58 2.32 1.08 NLl 57.5 0.75 58.9 0.88 1.66 2.29 1.08 NL2 61.1 1.14 59.9 0.99 2.04 ' 2.55 1.14 NL3 60.6 1.07 65.1 1.80 3.37 4.42 1.56 NL4 56.4 0.66 55.5 0.60 1.15 1.60 0.886.2 Predicted texture depth according to the sand Circle method
and the TRRL Mini Texture Meter
Based on relations obtained in the main programme, the Texture Depth
according to the Sand Circle method (TDSC) can be predicted from the profile with a fair accuracy (+/- 10% of added error). See Table l above.
Based on the same results from the main programme, also the SMTD or Sensor Measured Texture Depth according to the TRRL Mini Texture
Meter (TDTRRL) can be predicted. The prediction error is here
some-what higher, since the Mini Texture Meter did not work on all the test
surfaces in the main programme. Also, the risk of the Mini Texture
26
further checked. As can be seen from Table 1, the TDTRRL values are
surprisingly low. Although they have a strong correlation with TDSC, the
values are approx. only 30-50°/o of the TDSC values.
The TDLM values which are calculated based on a relationship obtained for rather limited early Swedish data, are consistently somewhat lower than the sand circle data, but in excellent correlation with them. The consistently lower TDLM values may be due to that they are based on
sand m measurements and not sand M measurements. The sand
spreading methods are slightly different. This will be further
27
7 COMPARISON WITH THE LASER RST MEASUREMENTS
On surfaces NRl and NR3, measurements were made within approx. one week both with the VTI Stationary Profilometer used in these measure-ments and with the Laser RST vehicle brought to New Zealand from
Australia. The results possible to compare are given in Table 2 below. The values for the Stationary Profilometer are derived from antilog
calculation from the corresponding log levels in the spectral diagrams. Table 2 Results of texture measurements conducted by the VTI
Station-ary Profilometer (Stat Prof) and the Laser RST vehicle
borrowed from Australia.
Surface Megatexture Macrotexture
No. (Wavmess) "Rough" "Fine"
TW in mm TR in mm TF in mm
Stat Laser Stat Laser Stat Laser
Prof RST Prof RST Prof RST
NRl (AC) 0.10 0.10 0.12 0.16 0.08 0.13
NR3 (PPC) 0.33 0.29 0.79 0.78 0.50 0.75
It appears that the values arein excellent agreement with each other,
except regarding the "Fine" macrotexture. It has been noticed before that the "Fine" macrotexture values from the RST are overestimated, probably depending on poor function of the laser probe. It is said to have been corrected by the RST experts on later models.
28
8 COMPARISON OF MEASUREMENTS IN SWEDEN AND NEW
ZEALAND REGARDING RELATION BETWEEN FUEL
CONSUMPTION AND ROAD TEXTURE
A test programme to study the relation between car fuel consumption and road texture has been completed in Sweden. Based on the relation obtained between fuel consumption at 70 km/h and the macrotexture expressed as LMa, the expected fuel consumption difference on the NZ
surfaces N05. 1 and 6, i.e. the most extreme surfaces in the NZ test
programme referred to in Chapter I, can be predicted. This expected
difference can be compared to the difference actually measured as
rolling resistance at 80 km/h and further recalculated to fuel
consump-tion, as reported in a letter 20 April 1988 from Mr. P.D. Cenek to Mr.
T.J. van Geldermalsen.
Since these are based on completely independent measurements it is
interesting to compare them. It should indicate the validity ofthe
results.
Table 3 Comparison of fuel consumption measurements in Sweden and New Zealand. Difference between surfaces NRl and NR2 (Nos.
6 and 1 respectively in the NZ project No. 52) in fuel consumption at 70-80 km/h.
Predicted accord- Actually
ing to measured obtained in
relation in Sweden New Zealand
Fuel consumption on - 7.3% - 6.2%
NRl versus NR2
(NR2 is reference)
The values are as close to each other as can be expected, considering the
difficulties and errors involved.
The comparison above has, of course, been enabled as a result of the texture profile measurements performed both in New Zealand and in Sweden. Without such measurements it would be impossible to quantify any comparisons.
29
9 ESTIMATED ROAD NOISINESS LEVEL (ERNL)
Based on an empirically derived algorithm by the author (modified from a procedure by G. Descornet), the Estimated Road Noisiness Level (ERNL) has been calculated. The noise considered is the outdoor noise
propagating outside the car. It does not_ generally have a good correlation
with the internal noise in the car. The values used to describe the and L
surfaces have then been L80mm 5mm (see the respective spectral diagrams).
The ERNL is valid for tyre/road noise (coast-by) at 70-90 km/h (probably also for 50 km/h but this has not been tested) for a "normal" car tyre of "summer" type. As long as the traffic is free-flowing this noise should be approx. equal to the overall vehicle noise. Table 4 gives the result of the
calculations.
Table i; Estimated Road Noisiness Level for the tested surfaces based
on texture profile measurements and calculation algorithm
based on VTI data of relation noise/texture. Do not consider the
absolute noise levels, just the differences.
Texture Noise
Surface
L80mm
L5mm ERNL
No. (dB) (dB) (dB(A))
NRl 32.2 35.2 714.8
NRZ 57.5 54.3 74.4
NR3 49.0 51.1 71.5 (Absorption effect ignored)
NLl 52.5 50.2 73.0
NLZ 56.6 49.3 74.9
NL3 56.8 5%6 74.1
NL4 51.1 l015.1 74.1
The differences are not dramatic. The PFC surface (NR3) is the least
noisy, although in reality it is even less noisy since the absorption effect due to the porosity can not be measured by the profiling technique. The absorption effect will probably reduce the noise by another 2-3 dB(A).
30
Apart from the PFC surface it is only NLl which has a potential of being
significantly less noisy than the others. The reason is its high texture in
the wavelength range 2-8 mm, which almost eliminates "air pumping"
noise, combined with its relatively low texture in the range l40-125 mm. The reason for the very smooth AC (NRl) having such a high ERNL is
that it excites a lot of high-frequency "air-pumping" noise because of its smoothness, especially for rather open tyre treads.
Surface NL4 could be very quiet if its texture in the wavelength range
40-125 mm could be reduced. From the appearance of this surface the author expected this texture to be lower. It could be that the test locations on this site were chosen poorly. Perhaps more measurements than the 5 should have been conducted. Usually lO measurements are
made on each test site.
The ERNL above is valid for external noise outside houses. When noise is
transmitted through facades, the high frequencies are reduced more than
the low frequencies and the Classification of the roads in terms of ERNL would differ somewhat. This will mean that indoors, with windows and
doors closed, the noise will be highest for surfaces NR2, NL2 and NL3.
NRl, NLl and NLAL would be fairly good and NR3 would be excellent.
Thus, a good compromise for outdoors as well as indoors, would be to use firstly NR3 (the PFC), secondly NLl and thirdly NL4. The PFC should be outstanding.
There is no ERNL procedure available for internal noise in vehicles. However, it is well known that the internal noise is mainly proportional
to the texture; especially the wavelengths around those included in
L 80mm
more noisy in cars than NRl. NL4 and NLl would be fairly good but NL2 . Thus, qualitatively, it can be predicted that NR2 should be much and NL3 rather poor.
31
10 COMPARISON WITH OTHER ROAD SURFACES MEASURED
IN NEW ZEALAND
The author measured the texture of 22 road surfaces in the main
programme in New Zealand. The result of these measurements could be
of interest to have as a reference in order to see how the surfaces NR
and NL fit into this selection which was intended to cover the range used
in New Zealand.
Table No. 5 presents preliminary results of these measurements. The
column to the far right gives the values measured by MWD with the sand circle method, the other two right columnsgive the result regarding the
two major overall values from the profile spectrum analyses. For space
purposes it is difficult to present more detailed results at this stage, but
Table 5.
32
ROAD SURFACES AND TESY SITES
iio. Type Description Test cite location Direc- Track
' -Nm (dB) (dB) (mm)
1. Chip seal lirade 1, new and course Auckland, Oteha Valley Rd near Albany Village, Decr. M 4 5 4
O O 0
100m east of "Stock" sign. 07/8 U
2. Asphalt Mix 10, smooth but harsh, Auckland, Albany iiighway, Exit at North Harbour Decr. Sh O 2 . 5 0 . (hot mix) bright, in almost untrafficked Industrial Park.. 1-1.Sm from curb. Downhill. L? S
left exit lane Slight bend in first 50m.
3. Asphait Mix 10, smooth and polished, Auckland, Akoranga Drive, near College Rd, Decr. L r ' 5 0 °
O 0 O
(hot mix) bright Northcote. Near centre lane. Dowhill. 011 nu 4. Cement Very old, bright and with some Auckland, Queen St. Begin at address No. 58. Decr. H
concrete black chippings (basalt stone), T11 N . 5 . 6 .l 0 joints, rather uneven
S. Cement Interlocking concrete blocks Auckland (Pakaranga), Nandina Ave between incr. M 8 6 'l
with period approx lOOnIn Harris Rd and Greermomt Or ° ° °
6. Slurry Chip seal, grade x, inproved Auckland (Takapma), Smnybrae kd. Begin at incr R . 4 . 9 1 . seal on by slurryseal, mix X giving a address No. 21. Uphill. 011. Nacrotexture is
chip seal lateral corrugation 20-50 m higher first 50m than last 50'
7. Chip seal Grade 3 greywacke, new and Hangatawhiri, State iiwy No. 2, RP 0/11.8, approx 'ikm east lncr H 9 4 2
coarse of Banners Castle. Begin at Jeff kd. Shoulder lane E (Sh) ' ° ° 8. Chip seal Grade 1, crushed rivergravel Hangatawhiri, State iiwy No. 2, RP 0/11.8, approx lkm east lncr. L 3 6 0
O O 0
25 years old, flushing of Barners Castle. Begin at Jeff kd. E
9. Chip seal Same as No. 8, but no Nangatawhiri, State iiwy No. 2, RP 0/11.8, approx Tkm east lncr. RR . 8 0 8 2. flushing and some smaller of Barners Castle. Begin at Jeff Rd. E
aggregate exposed (approx Bum) Track = 0.30 from centreline
10. Chip seal Chip seal, grade 1 with wet Outside Talpo, Aratiatia Rd, at bridge over river at Decr L . 5 60. 0 2-with lock, grade x, with power station S
wet lock considerany smaller chippings
11. Chip seal Grade 2, 15 years old and Tauranga (centre town), Cuneron Rd, Decr. L 6 9 0
polished by intense traffic between NcLean and iiarrington Streets S . . 12. Chip seal Grade x, highly .flushing, Tauranga, Cameron Rd at kacecourse. Begin Decr. L . 7 . 6 0 _
almost slick track 10m after paving joint NE
13. Chip seal Grade 2-3 andecite chip, with Outside Tauranga, Oropi Rd, 9.3 km from Sii29, just lncr. L . 6 . 9 4 e 1] some corrugations after Crossing with iiereford Rd and bus shelter s
' K
14. Burnt Grade 3, very dark with very Outside Tauranga at daimai, State iiwy 29, RPZlo/oJo. Decr. R 6 5 2 chip seal small "pockets" after burning ' Begin at Hr. iiamah's letterbox N ° ° .
15. Asphalt Runway surface, Mix 20m Tauranga Airport, 50m before 07 touchdown, Oecr. N.A. 6 'l 2. (hot mix) Rather open texture 1.7m west of centre line w .
16. Asphalt Mix x, repaired patch, Outside Talpo, Poihipi Rd, 450m from T-crossing Decr. LL .1 0 4 0 , (hot mix) uneven with road to Tukairangi. 65m long track, go as S
far left as possible. Downhill.
17. Chip seal Grade 1 crushed, rounded, Outside Tatpo, Aritiatia Rd, 100m off SHS. Begin incr. M ° 8 ' 9 4 ° approx ZOyrs old, very rough at parking'l space, drive right-side towards SHS. NU
18. Chip seal Grade 3 dacite, about 7yrs Outside Taupo, Oruanui Rd, near Link Rd (of SHS) lncr. H _ 5 60. 4 3 _ 19 old just'before crossing major power line NU
19. Chip seal Grade lo dacite, very harsh, Outside Tamo, Tutukau Rd, off Sii1 (SU of Hihi), L , 5 . 9 2. about Zyrs old 1.8 km from Uaikato bridge, 50m after pig 56. E
20. Chip seal Grade 2 greywacke chip, badly Outside Rotorua at Ngongotaha, on State Hwy S, ISO/9.9. lncr. M . O . 5 4 . stripped Middle, overtaking lane NU
Zl. Porous Mix x, new and very dark Auckland, Esmonde Rd, near Barrys Point kd, opp. incr. 7 o 6 o 2 20 Friction to Assenbly of God Church. Lane near centre line U
Course
22. Porous Mix x, old Auckland, State iiwy 1, just after entrance to lncr. L . 3 ,4 1 . Friction motorway at Birkenhead, just before bridge. Begin N
33
ll COMPARISON WITH EUROPEAN ROAD SURFACES
The author has conducted measurements of road surface texture by laser
profiling technique in Sweden, Denmark, West Germany, the
Netherlands, Belgium, USA, Australia and New Zealand. For comparison
purposes the following results can be studied now:
l. Table 6 below presents LMA and LME values measured in the above-mentioned fuel consumption versus texture study.
2. Fig. 1 below presents the texture spectra of four of the surfaces used
in that programme, including two two-coat seals (Nos. 19 and 20). 3. VTI Note No. 52-02 presents the result of measurements conducted in
the Netherlands.
Other available results are presently given in a form which makes it inconvenient to compare since they were analyzed with a different computer program. However, it would be possible, if requested.
lZ ACKNOWLEDGEMENT
The measurements reported here were conducted in connection with road texture measurements sponsored by the Pavements Committee, Road Research Unit, National Roads Board, Wellington, New Zealand, within the project "Relationship between tyre/road friction and surface texture". Particularly, the support by the Chairman, Mr. F. Bartley, and the Technical Secretary of the Committee, Mr. D. D. Petrie, is acknowledged. The project was also enabled by support from Swedish
34
Table 6 Values for macro- and megatexture measured on Swedish roads
in a fuel consumption study. CS = Max. Chipping size.
MIC = Estimated microtexture (on a scale 0-9)
Road Road type CS MIC Macro Mega
No. mm LM A LME
dB dB
1 MAB8T Asphalt concrete 6 48.0 45.0
2 MAB8T Asphalt concrete 5 47.3 45.3
3 Yl 4-8 Chip seal (single) 7 53.9 50.2
4
Y1 8-12 Chip seal (single)
12
8
62.8
58.6
5
Y1 12-16 Chip seal (single)
16
6
63.9
60.5
6 Cement concrete, very old 2 52.0 56.3
7 Paving stones, 100 mm square 140 1 ? ?
8
Yl 8-12 Chip seal (single)
12
8
63.1
59.6
9
Yl 4-8 Chip seal (single)
8
7
52.4
49.1
10
Y1 12-20 Chip seal (single)
20
8
66.9
65.1
11 HABl6T Asphalt concrete 16 3 50.2 48.5
12
Y1 12-20 Chip seal (in track)
20 ' 5
52.9
51.5
13
Yl 12-20 Chip seal (right of track)
20
6
59.5
55.7
14 MABlZT Asphalt concrete 12 4 33.6 41.6
15 YlG 0-18 mm Chip seal on gravel 18 7 61.9 61.4
16 Yl 8-12 Chip seal (single) 12 5 60.8 56.8
17 Gravel road, dry and few loose chippings - 3 56.3 63.6
18 MABlZT (see No. 14) + wave pattern 12 6 54.8 58.9
19 Y2 12-20/4-8 Double chip seal 20 7 59.2 56.5
20
YZ 12-20/4-8 Double chip seal
20
7
59.6
57.7
)
TE
XT
UR
E
LE
UE
L
<
dB
he
l
10
'5
m
35dB
SPHTIHL FREOUENCY
"
502c/-m
1s
|10
120
150
1100
1200
l500
I1000
1000 1 I I 1 1 T 1 1 I 7 1 1 1 I 1 I 7 1 1 1 1 1 I I I I 1 m E Etss_
J 552 :L
LU :1 __ :J / /; \ t;50,.
//,
\§\\
.J 315 _l
/ D-E: E: ur (I179 2
?C U] ,-100 582 BLS 7 171 500 200 100 50 20 10 S 2 1 mmTEXTURE NHUELENGTH
710-004
STRBCKH
3
... 710-010 STRQCKH 9--- 710-021
STRHCKH 19
- --- -- 710-022
STRHCKH 20
Fig 1. Texture Spectra for four surfaces included in fuel
consumption study in Sweden, measured with the VTI mobile profilometer. For this profilometer, the spectral levels shall be corrected at texture wavelength 5 mm by +l dB, at
4 mm by +2 dB, at 3.15 mm by +3 dB, at 2.5 mm by +4 dB and
Appendix l
Side 1(6)
PROFILE MEASUREMENT EQUIPMENT
This appendix consists of Chapter 7.3 in ARRB Internal Report AIR
000-243, July 1988, Australian Road Research Board.
7.3 THE VTI LASER TEXTURE PROFILOMETERS
In the lack of other contactless profilometers, for the purpose of measuring road surface texture in this program, a profilometer from VTI was transported from Sweden to the Pennsylvania Transportation Institute and further on to ARRB. This profilometer utilises two probes, one for measuring macrotexture and megatexture and another for
measuring the finest part of the macrotexture and the roughest part of the
microtexture. These probes are called ' macro probe' respectively ' micro probe' in the following. The measuring principle is basically the same, and it is described below.
The contactless profilometer uses a laser beam directed vertically to the road.
The light spot on the pavement is projected by an optical system having its axis 30° from the laser beam on a special analog detector the output of which is proportional to the
location of the light spot pictured' on the detector. See Figure 6. The light spot size on the pavement is approx. 1 mm2 (Circular) for the macro probe and 0.01 mm2 (Circular)
for the micro probe. Another detector output is proportional to the reflected light intensity. This intensity is kept constant by a closed loop. When it is not possible to obtain a sufficient light intensity, most frequently due to shadowing of the light spot, the output signal is held when a drop-out is recorded. The actual drop-out for the macro
probe is generally very small (§1 per cent) but could on humid, rough, black chip seals rise to about 15 per cent. For the micro probe the drop-out may be higher because the smaller light spot is more frequently shadowed. Also, being still a prototype, the micro probe has shown erroneous readings on some very steep slopes of the chippings. This problem will be handled by blocking out such effects in the analysis computer program.
By a chopped design of the laser signal and a synchronous detection of this chopped signal, the output is made completely intensitive to external light.
The amplitude signal is sensitive to the reflected light intensity. Ho'wever, the light intensity signal is used to regulate the laser output so that the received light intensity is constant, which reduces this error to a negligible level, with the exception mentioned above for the micro probe.
Appendix l Side 2(6) ! ' / | 300 l /
i?
0
V
O
4 /
l /
7
i 4
11 li / --;__-__-_________-'____ 0 . 5 ' h 'Kd =
1
K2- h 0 .87d '= The detector output signal
Kl and K are constants referring to the lens system
h = displacement in the road profile
Fig. 6 - The principle of the laser profilometer. The laser light spot is projected on a light-sensitive displacement sensor
Appendix l
Side 3(6)
As seen in 'Figure 6, the detector output is unlinear, but this signal is linearised in a special linearising unit in the transducer system. The resulting unlinearity is less than +/-2 per cent, as stated by the manufacturer, which is insignificant in this case, since the
resulting harmonics have so low amplitude that they drown' in the natural profile
spectrum. Actual road surface profile spectra always have such a high high-frequency content that such spectra fall off slower with frequency than do the distortion
components.
The horizontal displacement is obtained by anelectric motor pulling the 'sled-mounted' sensor system via a chain. A 1.0 m distance is covered in one sweep which
takes 20 s for the macro probe and 50 s for the micro probe. See figs 7-8. This
profilometer is called 'Stationary laser profilometer'.
The sensors and their associated systems for the laser profilometers have been developed by Selcom AB (the macro probe) and Remplir AB (the micro probe) in Gothenburg. The initiation, testing and application to the profiling technique was made by VTI. The essential specifications are given below.
SOME SPECIFICATIONS FOR THE STATIONARY PROFILOMETER WITH THE TWO PROBEB
Macro probe Micro probe
Sensor system Electro-optical Electro-optical
(laser) (laser) Measurement range 16 mm 10-12 mm (vertical) Resolution 8 pm 1 pm (?) (vertical) . Sweep speed 50 mm/s 20 mm/s (horizontal) Wavelength range 2-1000 mm 0.2-5 mm (tentatively) Noise floor at 2 pm* ? 5 mm wavelength (1/3 octave)
Ditto, incl. tape recorder 7 mm* ?
>Eumzawx H
man 23
\« (vv 00vr\.A /(\.\. 4 . .Avémiåxor .\Hamn.. .Nim | .55 memüoå Emma. vnomüosmnmn dig 56
Appendix l
Side 5(6)
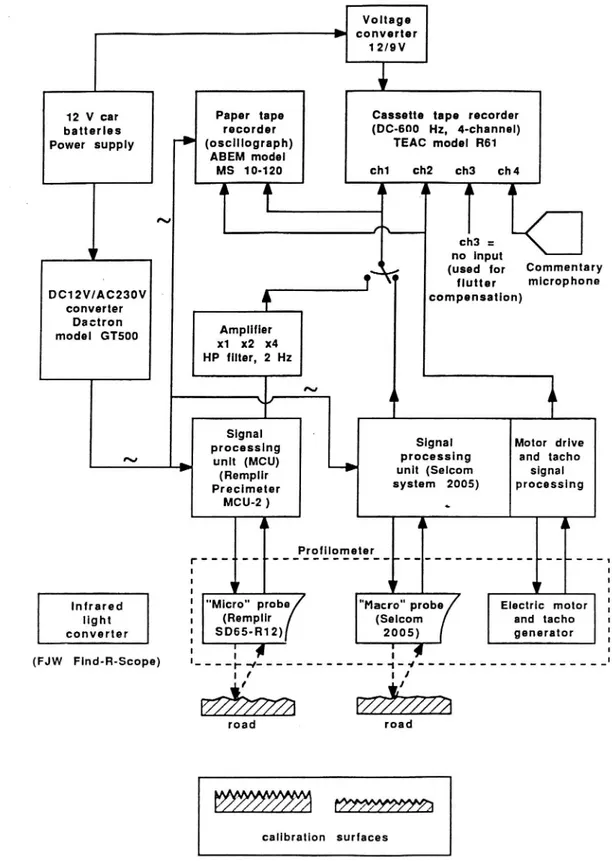
A block diagram of the complete measuring system as used in the field measurements is shown in Figure 9. The amplifier and the filter are used in order to filter out the long wavelengths of the signal and amplify the others so that a higher input-level to the recorder is allowed. This improves the signal/noise ratio.
VoHage å converter 12/9V
12 V car Paper tape Cassette tape recorder
batterles recorder (DC-600 Hz, 4-channel)
Power supply F, (oscillograph) TEAC model R61 ABEM model MS 10-120 ch1 ch2 cha ch4
'L
i -^
N Ch3 : no input, (used for Commentary
' f 'i "utth mlcrophone DC12V/A0230V < + compensatlon) converter Dactron model GT500 x1 x2 X4Amp'me' HP filter, 2 Hz N \/ ? Signal
processlng Signal Motor drive
N un" (MCU) processing and tacho
(Rempm unit (Selcom signal
precimeter system 2005) processing
MCU-2 ) , Proillometer r-'- "' ' - - ' - - ' - - ' - ' - - ' - - ' . - - ' ' " '- '-'1 I i I I I I
Infrared : "Micro" Pmbe "Macro" probe Electric motor :
light l (Rempllr (Selcom and tacho I
converter : 5055'312) 2005) generator :
I \ I i I
(FJW Find-Fi-Scope) I_-__{_.,_ _ . _ _ . . . . _ . 0.:-.., . . _ _ _ _ _ _ _ . . _ . . . _ . _-i
I I | I
§1 ål
road road
W'
^ ?Å mmm
callbration suriaces
Appendix l
Side 6(6)
To calibrate the complete measuring and analysis system, special calibration
surfaces have been manufactured. From the knowledge about their dimensions (by
normal mechanical technique in a precision workshop) their respective Fourier transforms have been calculated, which has enabled both amplitude calibration. (at various frequencies) and frequency calibration. The following calibration surfaces have been used.
A periodic triangular wave, amplitude 10 mm (peak-peak), period 20 mm (for the macro probe).
This gives a line spectrum where the fundamental wavelength 20 mm has an
amplitude level of 69.1 dB rel 10' m. Harmonics occur at 3, 5, 7, etc, times the
fundamental frequency and their amplitudes are used to check high frequency response (the same applies for the surface below).
A periodic triangular wave, amplitude 5 mm (peak-peak) and period 10 mm (for
the micro probe).
This gives a line spectrum where the fundamental wavelength 10 mm has an
amplitude level of 63.1 dB rel 10' m. Harmonics occur at 3, 5, 7, etc, times the
fundamental frequency and their amplitudes are used to check high frequency response.
Q
A periodic triangular wave, amplitude 0.5 mm, period 1 mm. A periodic triangular wave, amplitude 0.25 mm, period 0.5 mm.
The latter two are not regularly used in the field but are used for checks in the laboratory of the micro probe. All surfaces are in the form of plane, straight surfaces. Triangular surfaces are preferred because there is little risk for light spot shadowing on them. They are, however, expensive to manufacture.