Master´s Thesis 2005, 10 p, Jönköping University, School of Health Sciences, Department of Rehabilitation.
Detecting post-operative change in gait function
using principal component analysis
in subjects with cerebral palsy
Author: Kjell-Åke Nilsson
Supervisor: Reine Rosander, PhD.
Examiner: Tommy Öberg, MD, professor.
Course coordinator: Nerrolyn Ford, PhD.
Course Code: T24H3
Submission date (thesis): 2005-08-18
Acknowledgements
It is impossible to discern what thought from a friend, what discussion in the coffee room, what act of support from a loving family that contributed most to finally making this thesis appear in print.
So, to all of my colleagues and friends, to my supervisor Reine Rosander, to my family; I am indebted to you all.
Kjell-Åke Nilsson, 2005.
Problems worthy of attack prove their worth by hitting back. Piet Hein, Danish mathematician and poet.
Abstract
Principal components analysis is a multivariate statistical method that has been used in gait analysis. One example of use of the method is the production of The Gillette Gait Index. This index, indicating normality in gait function, has been presented and validated by previous authors. According to suggestions made by these authors, the index could potentially be used to evaluate change in gait function after surgical intervention in subjects with cerebral palsy. The Gillette Gait Index was calculated using principal components analysis for nineteen individuals with cerebral palsy (5 hemiplegics, 13 diplegics and 1 quadriplegic; mean age 16 years, range 10-31 years) in a retrospective study. The change in index value per individual from the pre- to the postoperative situations was compared to the evaluation of change made by an experienced clinician. Agreement was evaluated using Cohen´s kappa (κ), resulting in a value of κ=0.406, which is usually considered to be a fair to moderate level of agreement. Also, reasons were found to question the previously published lower bound for detection of change using the Gillette Gait Index. Although the method seems promising, there is not yet enough evidence to justify the introduction of the Gillette Gait Index as a daily evaluation tool in clinical gait analysis. Suggestions for further research are given.
Principalkomponentanalys är en multivariat statistisk metod som har använts inom gånganalys. Ett exempel på användning är framställningen av det så kallade Gillette Gait Index, som har presenterats som en metod att visa normalitet gällande gångfunktion. Det har också föreslagits att detta index eventuellt skulle kunna användas för att utvärdera skillnader i gångfunktion hos individer med cerebral pares före respektive efter kirurgi. Gillette Gait Index beräknades med hjälp av principalkomponentanalys i en retrospektiv studie för nitton individer med cerebral pares (5 hemiplegiker, 13 diplegiker och 1 tetraplegiker; medelålder 16 år, variationsvidd 10-31 år). Ändringen i indexvärde per individ före respektive efter kirurgi jämfördes med en bedömning gjord av en erfaren kliniker. Överensstämmelse utvärderades med hjälp av Cohens kappa (κ). Detta gav ett värde på κ=0.406, vilket vanligtvis anses motsvara måttlig överensstämmelse. Ytterligare upptäcktes skäl att ifrågasätta den tidigare publicerade nedre gränsen för att avgöra skillnader med Gillette Gait Index. Även om metoden i sig verkar lovande så anses det inte finnas tillräcklig evidens för att motivera att Gillette Gait Index införs som ett dagligt utvärderingsverktyg i klinisk gånganalys. Förslag för fortsatt forskning ges.
Contents
1. INTRODUCTION ...1
2. AIM AND SCOPE ...1
3. BACKGROUND ...2
4. DESCRIPTION OF EXISTING DATA AND FINAL REPORTS ...4
5. METHOD ...6
5.1.ETHICS APPROVAL AND SUBJECTS ...6
5.2.REFERENCE MATERIAL ...6
5.3.INTERPRETATION OF THE SUMMARY STATEMENT...7
5.4.CALCULATION OF THE GGI FROM PRESENT DATA ...8
5.5.STATISTICAL ANALYSIS ...9
6. RESULTS ... 11
7. DISCUSSION ... 14
8. CONCLUSIONS ... 17
9. REFERENCES ... 18
10. APPENDIX 1 – SUMMARY STATEMENTS FROM REPORTS ... 20
1. Introduction
Movement laboratories all over the world collect vast amounts of data for single subjects, in most cases to evaluate certain aspects of the gait of those subjects for clinical purposes. The collected data set is generally subjected to some type of comparison process, be it to normal subjects or the examined subjects themselves at different points in time such as in pre- and postoperative evaluations. Comparisons are difficult due to the number of gait variables and data points collected. It is clear that clinical use of multivariate methods to reduce the
multidimensional gait data set and to facilitate the comparison process would be of great help to clinicians. It has been suggested that multivariate methods such as principal components analysis (PCA) could be useful also in clinical gait analysis settings. PCA has been used to produce a single-number index that indicates closeness to normality for subjects with cerebral palsy (CP) by performing calculations on sixteen selected gait variables (Schutte et al., 2000; Romei et al., 2004). This index was recently named the Gillette Gait Index, abbreviated as GGI (Theologis et al., 2005; Romei et al., 2005). It has been suggested by the original authors that the GGI could potentially be used to detect functional change in individual subjects from pre- to postoperative situations. Investigating the agreement between GGI results and present methods and standards for evaluation would then be necessary. To the author´s knowledge, no studies presenting this have yet been published.
2. Aim and scope
The aim of this thesis is to investigate to what extent the PCA-based GGI shows agreement with the evaluation by an experienced clinician regarding change in gait function after corrective surgery in selected subjects with CP.
The scope of this thesis is limited to assessing the agreement between the GGI and the clinician regarding all potential subjects defined below. Inclusion criteria for the subjects were:
• that they were independent ambulators; that pre- and postoperative gait analysis was performed at the Biomechanics Laboratory (BML), Team Ortopedteknik, Linköping University Hospital, Linköping, to assess gait function; that complete laboratory reports were present, covering the clinician´s evaluation, subject CP involvement and identification of original raw data files.
3. Background
Instrumented gait analysis is generally used to investigate the relationships of body segment movements and forces during human locomotion. This can be basic research in order to gain a better understanding of for instance the neurological basis and motor control of walking (Simon, 2004).
In clinical gait analysis there is more emphasis on examining the gait of individuals and relating the findings to some standard. Similarity between subject and normal data is usually referred to as normality (Kadaba et al., 1989; Davis, 1997; Schutte et al., 2000). An
evaluation of gait function and normality is usually included in the final gait analysis report to the referring physician (Simon, 2004).
Normality is usually evaluated by comparing the individual subject´s gait data with a set of normal data. The normal data is presented as a superimposed graph or a normality band containing +/- one or two standard deviations from a produced mean curve. The procedure is performed visually and subjectively, and there is usually no numerical value given for normality (Õunpuu et al., 1996; Davis, 1997; Duhamel et al., 2004; Simon, 2004). Several authors have stressed the need to define and quantify any concept, such as for instance normality, used in clinical gait analysis (Zahedi et al., 1987; Schutte et al., 2000; Abel, 2003; Romei et al., 2004).
Scores such as the Gross Motor Function Measure (GMFM) or the Pediatric Evaluation of Disability Inventory (PEDI) have been suggested as methods for assessment since they have been shown to be reliable (Hinderer and Gupta, 1996; Ketelaar et al. 1998).
Evaluations of gait function normality are usually made to identify the need for and type of surgical intervention. A prevalent view is that a change towards normality is beneficial for the patient. However, there is also the need to weigh possible benefits against risks connected with surgery, and minor deviations from normality may not justify surgical intervention (Schutte et al., 2000; Simon, 2004). It is obvious that the above described procedures for evaluating normality merit a higher degree of quantification than is usually the case.
Statistical methods have been described for the reduction of multivariate gait data and
interpretation of the results (Kadaba et al., 1989; Õunpuu et al., 1996; Davis, 1997; Lenhoff et al., 1999; Chau, 2001a/2001b; Abel et al., 2003; Duhamel et al., 2004; Schwartz et al., 2004). Earlier works such as that of Kadaba et al. attempt to perform parametric value comparisons using the coefficient of multiple correlation, while work in later years by for instance
Duhamel et al. tend to use more computationally intense methods of multivariate statistics. This interesting progression could perhaps be explained by the increase in computational power and knowledge in the clinical gait laboratories of today (Simon, 2004).
One main problem in trying to reduce the multivariate data set and compare results is that generally well-known statistical methods such as means, standard deviations and correlations are appropriate only for discrete gait parameters (Chau, 2001a). Among these can be
mentioned for instance cadence, step length, velocity or joint angles at specific points of the gait cycle. The comparisons usually made by clinicians are more based on patterns than on these discrete parameters since the data collected is of a continous nature (Troje, 2002), and consequently the methods used in recent years have focused more on the comparison of complete gait curve shapes (Duhamel, 2004).
Multivariate techniques such as cluster analysis or discriminate analysis are powerful statistical methods when large data sets need to be analysed (Hair et al., 1998). However, these methods do not seem to have been implemented to any great extent in gait analysis. An impressive compilation and comparison of statistical methods for gait analysis has been published, making no mention of cluster or discriminate analysis (Chau 2001a/2001b). Other multivariate methods are described instead. One such method is PCA, which strives to reduce a large number of variables into a smaller number of principal components. In principle, the idea is to express mathematically a relationship between the individual variables and the principal components by way of the variance for each variable (Hair et al., 1998).
It has been used for instance to produce single-value indexes for normality (Schutte et al., 2000; Tingley et al., 2002) and to compare variability in knee kinematics and kinetics (DeLuzio et al., 1997)., showing that PCA can be used in the reduction of gait data, in
measuring differences in entire gait waveforms, in the search for patterns and in the extraction of certain features of gait. It should be noted however that the main limitation of PCA is that it relies heavily on the subjective interpretation of the produced components (Chau, 2001b). In addition, it is usually suggested to multiply the number of variables to be examined by a factor of ten to arrive at an appropriate amount of subjects for a PCA study (Hair et al., 1998).
In spite of this, there are authors that consider PCA to be a useful, if not necessary, tool to incorporate into daily clinical practice (Daffertshofer et al., 2004).
The previously mentioned GGI has been produced using PCA (Schutte et al., 2000). The mean value of the GGI seems to be able to distinguish between differing levels of pathology involvement. This further appears to have been confirmed in a subsequent study (Romei et al., 2004), where the corresponding author for the study by Schutte et al. (Michael Schwartz) acted as co-author. It was also suggested by Schutte et al. that the GGI could potentially be used to evaluate post-operative functional change.
While it is clear that reliable and validated methods for comparison should be preferred, the subjective visual method of evaluating change in gait function continues to be the method commonly used. It is also the method used for the clinician´s evaluation in this study.
Therefore it will be considered to be the standard to which calculated values for the GGI will be compared.
4. Description of existing data and final reports
Using an experienced clinician´s evaluation for the comparison to the GGI result requires that there is some clear indication of the perceived change in gait function. A typical gait
assessment round at BML usually resulted in a final report, where a summary statement regarding gait function was made by the clinician. These statements are central to this study, and the description below serves to show that the collection and compilation of data
eventually resulting in these summary statements was performed in a repeatable manner. This section provides information needed for a subsequent discussion on the reliability and validity of the procedure described in this study.
All individual data files were originally collected using the full bilateral CODAmpx30 system (Charnwood Dynamics, Barrow-upon-Soar, Leicestershire, United Kingdom) for
three-dimensional gait analysis with a 200 Hz acquisition rate. The same laboratory protocol regarding acquisition setup and marker placement was used for all subjects as well as for the reference material. This protocol followed the manufacturer´s manual. A total of three
operators were responsible for placing markers on subjects, collecting and compiling the data and presenting it to the clinician. All nineteen preoperative gait data collections were
performed by the same operator. The same operator was also responsible for nine of the postoperative data collections. The remainder of postoperative data collections were divided equally between two other operators.
All manual evaluations of change in gait function were done by the same clinician using a combination of digital video recordings, printed gait data reports with graphs of kinematics and kinetics in all three planes, access to the original raw data files and in some cases a physiotherapist report on subject range of motion, muscle strength and spasticity. At a typical evaluation round, all of these data sources were available for both pre- and postoperative situations and presented to the clinician by one of the three laboratory operators. The clinician also had a direct input from meeting and interviewing the subject. This was done on the day of postoperative gait analysis, while the actual evaluation took place at a later date when all data was compiled and ready to be presented.
All digital video sequences of subjects walking were recorded according to the existing BML standard, which was as follows:
1. Sagittal plane, left and right sides of whole body.
2. Sagittal plane, left and right sides zoomed to lower extremity. 3. Frontal plane, front and rear view, whole body.
4. Frontal plane, front and rear view, zoomed to lower extremity. 5. Close-up of heels during attempt to perform standing on toes.
The gait reports consisted of multiple data files presented as tables and graphs. The graphs were superimposed on reference file graphs to facilitate identification of pathological gait patterns. Gait data files with kinetics were preferred in the production of the reports.
The final evaluation reports consisted of multiple separate headings in order to give a comprehensive view of the gait function of the subject. The headings covered:
1. Notes from data acquisition. 2. Consistency.
3. Impressions of video recordings.
4. Sagittal kinematics for pelvis, hip, knee and ankle for both left and right sides. 5. Coronal and transverse kinematics.
6. Sagittal and coronal kinetics. 7. EMG interpretation.
All of the above information was evaluated by the clinician and condensed into a summary statement regarding gait function. This summary statement in the clinician´s evaluation was then interpreted to define a value for the categorical variable used in this study.
5. Method
5.1. Ethics approval and subjects
This study was approved by the regional ethical review board (registration number M63-05, The Regional Ethical Review Board in Linköping, Linköping University, Sweden). A number of reports covering potential subjects were identified in the laboratory database in
collaboration with the BML management. Informed written consent was obtained by the BML management from all subjects meeting the inclusion criteria listed in section 2.2. A total of nineteen subjects were used for this study (5 hemiplegics, 13 diplegics and 1 quadraplegic). There were 10 male and 9 female subjects (mean age 16 years, range 10-31 years), all ages identified at the time of one-year follow-up and postoperative gait analysis. No subjects were younger than 8 years at the time of preoperative gait analysis.
5.2. Reference material
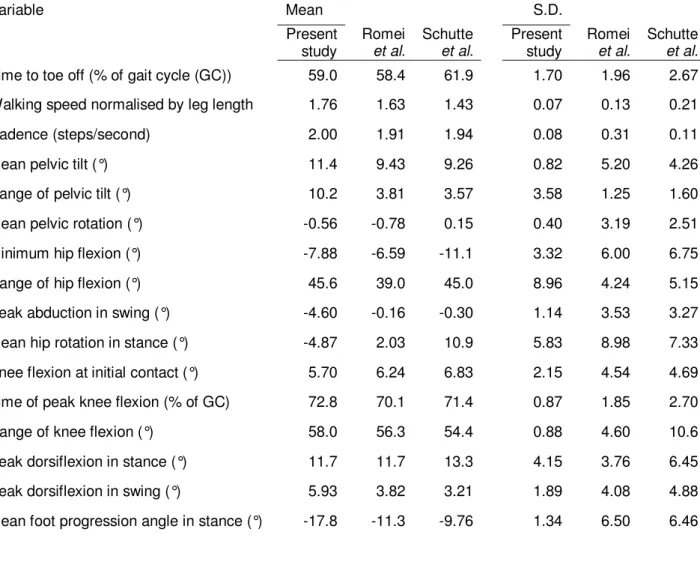
The reference material used in this study to calculate the principal components consisted of a total of four complete gait cycles (two left and two right) collected on one session from an able-bodied male subject (age 28) with no known gait deviations. Although a larger number of subjects would be preferred for the reference material, it was considered important to use the same material as that available to the clinician at the time of postoperative evaluation. Also, calculating means and standard deviations (S.D.) for only four gait cycles is usually considered unorthodox. However, it was necessary for the calculation of the GGI, as will be shown in section 5.4. The mean values and S.D. for the sixteen gait variables proposed by Schutte et al. are shown in Table 1. Values are given for the reference material in this and previous studies regarding the GGI.
Table 1 Variable Mean S.D. Present study Romei et al. Schutte et al. Present study Romei et al. Schutte et al.
Time to toe off (% of gait cycle (GC)) 59.0 58.4 61.9 1.70 1.96 2.67 Walking speed normalised by leg length 1.76 1.63 1.43 0.07 0.13 0.21 Cadence (steps/second) 2.00 1.91 1.94 0.08 0.31 0.11 Mean pelvic tilt (°) 11.4 9.43 9.26 0.82 5.20 4.26 Range of pelvic tilt (°) 10.2 3.81 3.57 3.58 1.25 1.60 Mean pelvic rotation (°) -0.56 -0.78 0.15 0.40 3.19 2.51 Minimum hip flexion (°) -7.88 -6.59 -11.1 3.32 6.00 6.75 Range of hip flexion (°) 45.6 39.0 45.0 8.96 4.24 5.15 Peak abduction in swing (°) -4.60 -0.16 -0.30 1.14 3.53 3.27 Mean hip rotation in stance (°) -4.87 2.03 10.9 5.83 8.98 7.33 Knee flexion at initial contact (°) 5.70 6.24 6.83 2.15 4.54 4.69 Time of peak knee flexion (% of GC) 72.8 70.1 71.4 0.87 1.85 2.70 Range of knee flexion (°) 58.0 56.3 54.4 0.88 4.60 10.6 Peak dorsiflexion in stance (°) 11.7 11.7 13.3 4.15 3.76 6.45 Peak dorsiflexion in swing (°) 5.93 3.82 3.21 1.89 4.08 4.88 Mean foot progression angle in stance (°) -17.8 -11.3 -9.76 1.34 6.50 6.46
5.3. Interpretation of the summary statement
The first sentence of the summary statement usually contained a clear indication of the clinician´s view of the change in gait function. It was clear that changes in gait function could be defined as worse, no change or better, here labelled w, 0 and b, respectively. Although different grades of improvement were mentioned for some cases, the decision was made to use only the three mentioned outcomes for the comparison to the GGI. This was based on the fact that although it has been shown that the GGI mean in a group can grade pathologies, no hitherto published journal articles have shown GGI to grade changes in individuals between sessions. A list of summary statement first sentences can be found in Appendix 1 for
5.4. Calculation of the GGI from present data
Raw data for calculation of the sixteen GGI variables was exported from the CODA software to Microsoft Excel (Microsoft, Redmond, Washington, USA) for storage and conversions. One hundred data points per gait cycle were exported. The data chosen for export were the files included in the original printed gait data reports available to the clinician; one left and one right gait cycle per subject for the pre- and postoperative situations, respectively. Reference data was exported in the same manner.
The GGI calculation sequence is thoroughly described elsewhere (Schutte et al., 2000). Nevertheless, a mathematical misprint was suspected in one of the equations presented. Upon contact, this was confirmed by the corresponding author. The corrected equation was used. Awaiting the publishing of corrections, a brief description will be given here to facilitate understanding of the method. In principle, the index is calculated by first normalising the sixteen original reference gait data variables (xj) with mean µj and S.D. σj to zero mean and unit S.D. variables (zj) by well-known mathematical methods. PCA is then applied to this data set to extract principal components, component eigenvalues (λi) and component loadings ( i
j
α ) for the individual variables. A new set of uncorrelated variables (yi) for the reference material is calculated by:
j N j i j i i z y
∑
= = 1 1 α λ . (1)All subject variables (xj
~
) are now normalised to the reference by:
j j j j x z ~ µ /σ ~ − = j=1, N, (2)
where µj and σj are the mean and S.D. from the reference material. The transformation of Eq. (1) is now applied to the patients´ normalised variables resulting from Eq. (2), producing:
j N j i j i i z y ~ 1 ~ 1
∑
= = α λ (3) where λi and i jThe square of the Euclidian distanceyi ~
is referred to as the GGI and represents the distance d
of an individual subject´s data from that of the reference material:
∑
= = N i i y d 1 2 ~ . (4)Calculations were performed using SPSS for Windows (Rel. 11.5.1, 16 Nov. 2002, Chicago: SPSS Inc.) with Varimax rotation and Kaiser normalisation. The rotated solution eigenvalues were used. Both unrotated and rotated solutions for principal components and squared factor loadings are given for reference in Appendix 2.
The sixteen variables were calculated and the GGI produced as described by Schutte et al. It
should be noted that great care must be exercised in the calculation sequence. An initial error in the Microsoft Excel spreadsheet calculations was discovered. Correction of this error revealed a high sensitivity in the GGI to small changes in individual variable values. While it is beyond the scope of this study to pursue this particular numerological gem, it is something to be observed.
Romei et al. (2004) propose from their calculations that the smallest relevant change
detectable by the GGI is 12 units. The GGI typically ranges from 40-1000 units depending on the level of CP involvement, higher values being farther from normality. It is acknowledged that the 12 unit cut-off value can be debated and considered as a mere suggestion made by Romei et al. (2004). Thus far however, it remains the only suggestion published. Changes in
the GGI from the pre- to postoperative situations were consequently noted as worse if the average left + right GGI value was raised by more than 12 units, and vice versa for better when there was a drop of more than 12 units. Change within +/- 12 units was considered no change. Just as with the clinician´s evaluation score, the GGI scores worse, no change or better were labelled w, 0 and b respectively.
5.5. Statistical analysis
One frequently used method of evaluating agreement between raters is Cohen´s kappa (Cohen, 1960). The method and what is considered overuse of it has been criticised by some authors, pointing to the need to follow correct assumptions when using Cohen´s kappa (Maclure and Willett, 1987; Uebersax, 1987). Typical assumptions when using the kappa measure are that: (1) the subjects rated are independent; (2) the observers act independently; and (3) the scores are mutually exclusive (Cyr and Francis, 1992). The data used in this study
fulfils these criteria. This, along with the relative simplicity of the method, led to the use of Cohen´s kappa for this first study on the GGI ability to show agreement with a clinician. Cohen´s kappa interprets the proportion of agreement between examiners and corrects this proportion for the amount of agreement that could result from chance (Landis and Koch, 1977). This is done by subtracting the amount of agreement by chance alone (Pc) from two
quantities: observed agreement (P0) and maximum achievable agreement (=1). The ratio of
these corrected quantities is defined as kappa (κ), which is a value ranging from -1 to 1 where a value of 1.0 indicates perfect agreement, 0 indicates an agreement no better than chance and values <0 are interpreted as worse than mere chance (Cyr and Francis, 1992). Calculation of the kappa value is symbolically described by:
c c
P
P
P
−
−
=
1
0κ
(5) where∑
= = m i ii P P 1 0 (6) and∑
= = m i i i c P P P 1 . . (7)where m is the number of classification categories, Piiis the proportion of subjects
consistently assigned to the same category by both methods, and Pi.P.i is the estimated proportion of subjects classified in category i by chance.
In the example below, Ii stands for the GGI evaluation, Ci stands for clinician evaluation and Nii are the number of subjects classified in each row-column category.
N
N
N
N
N
N
N
N
C
N
N
N
N
C
N
N
N
N
C
I
I
I
3 . 2 . 1 . . 3 33 32 31 3 . 2 23 22 21 2 . 1 13 12 11 1 3 2 1∑
∑
∑
∑
∑
∑
(8)6. Results
The calculation sequence described by Schutte et al. (2000) was applied to the reference
material, using the corrected equations presented in section 5.4. Three principal components were identified and used for calculation of final GGI values for all subjects. Mean GGI values for subjects grouped by CP involvement are shown in Table 2 below. Previously reported GGI data from Schutte et al. (2000) and Romei et al. (2004) are also cited for reference.
Values from the present and previous studies are presented on different lines since it is unknown whether the data in previous studies were collected pre- or postoperatively.
Table 2
Present study aRomei et al. bSchutte et al.
NP Mean (range) NR Mean (range) NS Mean (range)
Reference/Normal 1 a4.37 (1.645-8.14) 25 16.36 (6.85-29.27) 24 15.7 (8.2-26.9) Able-bodied na 12 28.47 (7.44-46.32) na Idiopathic Toe-Walkers na 5 61.22 (44.7-82.1) na Hemiplegics 27 189.28 (41.5-435.5) 30 166.7 (32.1-1066.5) Hemiplegics preop 5 b125.8 (26.3-231) Hemiplegics postop b65.8 (8.75-135.4) Affected side 201.17 (26.5-523.1) 236.0 (28.5-1515.7) Affected side preop 153.2 (8.87-253)
Affected side postop 92.2 (10.72-191.4)
Unaffected side 177.38 (18.93-449.3) 95.4 (26.0-617.3) Unaffected side preop 98.4 (37.8-302) Unaffected side postop 39.5 (6.78-79.4) Diplegics 92 278.12 (59.6-789.5) 23 279.4 (28.46-1322.3) Diplegics preop 13 c245 (37.5-596) Diplegics postop c150.4 (15.52-503) Quadraplegics 7 383.71 (177.4-626.5) 11 491.0 (121.5-1195.0) Quadraplegics preop 1 d1460 (na)
Quadraplegics postop d 105.5 (na) Dependent ambulators na 18 757.57 (306.8-1827) na a
An average of four gait cycles were used for the single reference subject.
a, b, c, d
It can be seen that the mean and range GGI values decrease from the pre- to the postoperative situations in all groups. The means and ranges presented in this study also seem to concur with the results presented in previous studies.
The GGI values pre- and postoperatively as well as the calculated change in the GGI are listed per subject in Table 3, rounded off to the nearest integer for reasons of clarity. Accounts of the change observed by the clinician and the GGI are also shown, using the outcome labelling presented in section 5.3 and 5.4.
Table 3
Subject Preop GGIa Postop GGIa Change GGIa Clin.c GGIc 1 hpb 214 135 -79 0 b 2 hp 59 63 4 b 0 3 hp 99 75 -24 b b 4 hp 26 9 -17 b b 5 hp 231 47 -184 b b 6 dpb 38 52 14 b w 7 dp 86 126 40 w w 8 dp 215 462 247 w w 9 dp 175 16 -159 b b 10 dp 560 187 -373 b b 11 dp 177 76 -101 b b 12 dp 379 110 -269 b b 13 dp 268 142 -126 b b 14 dp 153 16 -137 b b 15 dp 596 503 -93 0 b 16 dp 166 75 -91 b b 17 dp 158 53 -105 b b 18 dp 218 138 -80 b b 19 qpb 1460 105 -1355 b b a
Average of right and left side indices according to the method described by Schutte et
al.(2000) and Romei et al. (2004). b
hp=hemiplegics, dp=diplegics, qp=quadriplegics.
c
The numbers of observed figures for the clinician´s evaluation and the GGI change were taken from Table 3 and inserted according to Eqs. (5-8) to calculate Cohen´s kappa. The resulting kappa calculation table can be seen in Table 4.
Table 4
GGIw GGI0 GGIb Σ
Clinw 2 0 0 2
Clin0 0 0 2 2
Clinb 1 1 13 15
Σ 3 1 15 19
Calculating these values in SPSS gave a kappa value of κ=0.406. The agreement table suggested by Landis and Koch (1977) is shown in Table 5.
Table 5
Kappa Statistic Strength of agreement
< 0.00 Poor 0.00 – 0.20 Slight 0.21 – 0.40 Fair 0.41 – 0.60 Moderate 0.61 – 0.80 Substantial 0.81 – 1.00 Almost Perfect
It should be noted that it is admitted by Landis and Koch that the divisions given in Table 5 are arbitrary and should be seen as benchmarking tools. With this limitation in mind, it can be seen that a fair to moderate agreement is achieved between the clinician and the GGI and that the observed agreement is greater than would result by chance.
7. Discussion
Applying the GGI to a group of nineteen subjects with CP has produced values for mean and range per group of approximately the same magnitude as that shown previously by Schutte et al. (2000) and Romei et al. (2004). These studies share more than the described method; one
particular author has taken part in both studies and is the corresponding author for the first. There is no mystery that the calculation of the GGI worked in the second study as well. However, it would be natural for us mere mathematical mortals to be intimidated by the sheer sound of a phrase such as “multivariate data analysis”. Therefore, it is interesting to note that a relatively complicated procedure such as calculating the GGI is actually feasible by
following the guidelines given by the original authors. This indicates that their study leads to a reproducible method, which is a promising quality of the GGI and a prerequisite for
reliability. Although the results from this and previous studies point to a possibility of using the GGI in daily practice, several more studies need to be performed with larger numbers of subjects before any proper measure of reliability can be attained.
Assessing the validity of the proposed method in the setting described in this study is difficult, since there is no known true value for the change in gait function. As previously stated, the best option available was the evaluation made by an experienced clinician. This in itself shows a problem in clinical gait analysis; clinicians proficient in gait analysis for subjects with CP are probably also instrumental in the preoperative assessment. In some cases, they may also perform the proposed surgery. It cannot be ruled out that the clinician may be biased towards finding a positive result, especially since the risks of surgery were considered
acceptable compared to the anticipated positive outcome.
Although this study only seeks to examine whether the evaluation by the clinician agrees with the GGI, it is important to know the details described earlier regarding the procedure for collection of the original raw data and the presentation of them to the clinician. It can be seen from those descriptions that there was a clear structure and an effort to make data collection and presentation repeatable. This in turn serves to provide a possibility for the clinician to make a valid statement to which the GGI can be compared.
The values produced in this study, using existing data collected with another system in another gait laboratory, are shown to be of approximately the same magnitude as those previously reported. Somewhat different GGI values should be anticipated. Reasons for this
may include day-to-day difference in subject spasticity, actual subject change or marker placement error.
In the hemiplegic and diplegic groups, there was a decrease of both the mean value and the range for the postoperative data. This applied to both summed left and right means as well as the affected and unaffected limbs separately. In the case of the quadriplegic subject, it must be noted that these values are probably erroneous. It can be questioned if a subject with such severe CP involvement can really become as close to normality postoperatively as the GGI would suggest, even if a substantial improvement is noted also in the summary statement. There is probably an effect of marker placement error embedded in these values. Models of the walking body are based on an upright position. Marker placement, detection and
calculation of marker position is always associated with some amount of error. This is further amplified if the subject at hand has both angular deformities such as deep crouch gait and hip flexion contractures as well as severe rotational malalignment of the lower extremities. Although the full preoperative history is not known, it seems reasonable that a quadriplegic subject considered for corrective surgery would exhibit these traits. It is also probable that the walking style itself will serve to induce marker error, and that a change towards normality in walking style would reduce these errors. This would further lead to a larger change in GGI values.
While the GGI seems to be a promising tool in clinical gait analysis, it is not without
problems. In general, one must realise that producing a single-value global index of this sort can actually conceal important data when used on its own. While it seems efficient to reduce the multivariate gait data into a single number, there is a risk that one uses this index to make decisions that are possibly life-changing for the subject. It must be stated that an index of this sort should only be seen as a rough guideline that might support other interpretations of the data, and that it should only be used as a tool for the experts.
Extracting raw data for the sixteen chosen variables is tedious at best. Also, the number of calculative steps involved, together with what seems to be a high sensitivity to small changes in variable values, increases the risk for errors. These errors may be very hard to detect after the fact, given the large range of values observed in each group.
However, the main problem in using the GGI to measure change in individuals is knowing what constitutes a change. Romei et al. (2004) presented the notion that the lower bound for
detection of differences in the GGI mean value lies at 12 units. The same cut-off value was used for this study, since this was the only available indication of such a measure. In
originally determined by comparing the means of two separate groups of able-bodied
individuals (see Table 2). One of these groups existed in their laboratory database, while data for the other was collected ad hoc. If both data sets indeed consisted of able-bodied
individuals and were collected with the same system, they should be considered as one group. The observed difference might be a mix of systematic and random errors, and the lower bound assumption would then be based on a case study of errors, not change; (2) even if the 12 units limit is considered accurate as a lower bound, it is less likely that a change of for instance 15 units represents a relevant change if it occurs between values in the higher ranges of the GGI spectrum. The elements of chance and error embedded in the PCA assumptions could very well account for more than that.
It also seems unlikely that the lower bound should be considered constant throughout the possible range for GGI values, but that it should instead increase with the GGI and perhaps even in a non-linear fashion. It is my opinion, based on the facts presented, that further work is required before a lower bound for change can be determined. All this said, the use of that value in this study does not lead to a great amount of ambiguity as far as the GGI goes; the only case with a GGI change close to 12 units is subject number 4 (see Table 3).
Another aspect of critique of the method is the use of the produced value d (see Eq. 4), since
this is the square of the Euclidian distance between reference and subject data. It is possible that the squaring operation only serves to amplify the difference, hence producing values that differ more and subsequently show a significant difference. Unless it can be shown
conclusively that the reasons for the use of the value d are purely mathematical, the choice of
the value d for the GGI can be seriously questioned.
The limitations of this study are mainly two; the reference material used and the unknown validity of the clinician´s statements. In the case of the reference material, it is clear from the described calculation sequence that a much larger number of gait cycles should be used to produce the reference variable means and standard deviations. However, it was considered important to use the same reference data that was used in the graphs being evaluated by the clinician. Although adding some normal subjects to the PCA calculations would have improved the situation somewhat, it could be considered a mere cosmetic operation; as
previously presented, PCA calculations should normally be based on a number of subjects ten times the number of variables. In this case that would mean having at least 160 reference gait cycles available for calculations. This is rarely the case and not even the original studies
presenting the GGI have that many, in spite of being produced in well-known gait laboratories with a relatively large body of normal subjects to choose from.
In the case of clinician validity, it is acknowledged that the performance of the clinician in question has not been validated before this study, since it was based on existing data and statements already made. To the author´s knowledge, none of the Swedish gait analysts have been validated in a comparative study. However, given the relatively low number of gait laboratories and gait analysts in Sweden, this particular clinician can be considered one of the most active and well-known. Although this in itself is no proof of validity, it shows that the clinician used in this study was at least empirically and by reputation on par with other gait analysts in Sweden.
Suggestions for future research include; (1) testing of the GGI ability to detect change prospectively under stricter protocols concerning the use of reliable methods for the
assessment of change. Methods such as the previously mentioned GMFM or PEDI could be used to evaluate change; (2) tests of the robustness of the GGI by introducing error values of known magnitude to existing raw data to investigate the resulting change in output; (3) using several different normal data sets for the same subject data to investigate the effects on d
value magnitude.
8. Conclusions
The Gillette Gait Index shows fair to moderate agreement with the evaluation made by an experienced clinician regarding change in gait function after corrective surgery. Given the potential problems discussed above, this can not be considered good enough to merit
inclusion of the method on a wide basis in daily clinical gait analysis practice. Although there still seems to be potential for its use in this particular setting, much verification work using different aspects is needed before the Gillette Gait Index can and/or will be trusted as a reliable tool in the gait laboratories of today.
9. References
Abel, R., Rupp, R., Sutherland, D. (2003) Quantifying the variability of a complex motor task specifically studying the gait of dyskinetic CP children. Gait Posture no. 17, pp.50-58.
Chau, T. (2001a) A review of analytical techniques for gait data. Part 1: fuzzy, statistical and fractal methods. Gait Posture No. 13, pp. 49-66.
Chau, T. (2001b) A review of analytical techniques for gait data. Part 2: neural network and wavelet methods. Gait Posture No. 13, pp. 102-120.
Cohen, J. (1960) A coefficient of agreement for nominal scales. Ed Psych Meas No. 20,
pp.37-46.
Cyr, L., Francis, K. (1992) Measures of clinical agreement for nominal and categorical data: the kappa coefficient. Comput Biol Med Vol. 22, No. 4, pp.239-246.
Daffertshofer, A., Lamoth, C., Meijer, O., Beek, P. (2004) PCA in studying coordination and variability: a tutorial. Clin Biomech No. 19, pp. 415-428.
Davis, R. (1997) Reflections on clinical gait analysis. J Electromyogr Kinesiol Vol. 7, No. 4,
pp. 251-257.
Deluzio, K., Wyss, U., Zee, B., Costigan, P., Sorbie, C. (1997) Principal component models of knee kinematics and kinetics: Normal vs. pathological patterns. Hum Mov Science
No. 16, pp. 201-217.
Duhamel, A., Bourriez, L., Devos, P., Krystkowiak, P., Destée, A., Derambure, P., et al. (2004) Statistical tools for clinical gait analysis. Gait Posture No. 20, pp. 204-212.
Hair, J., Anderson, R., Tatham, R., Black, W. Multivariate data analysis. 5th ed. Upper Saddle River (NJ): Prentice Hall; 1998.
Hinderer, S., Gupta, S. (1996) Functional outcome measures to assess interventions for spasticity. Arch Phys Med Rehabil No. 77, pp. 1083-1089.
Kadaba, M., Ramakrishnan, H., Wootten, M., Gainey, J., Gorton, G., Cochran, G. (1989) Repeatability of kinematic, kinetic and electromyographic data in normal adult gait.
J Orthop Res Vol. 7, No. 6, pp. 849-860.
Ketelaar, M., Vermeer, A., Helders, P. (1998) Functional motor abilities of children with cerebral palsy: a systematic literature review of assessment measures. Clin Rehabil
Laassel, E., Loslever, P., Angue, J (1992) Pattern of relations between lower limb angle excursions during normal gait. J Biomed Eng Vol. 14, pp.313-320.
Landis, J., Koch, G. (1977) The measurement of observer agreement for categorical data.
Biometrics No. 33, pp.159-174.
Lenhoff, M., Santner, T., Otis, J., Peterson, M., Williams, B., Backus, S. (1999) Bootstrap prediction and confidence bands: a superior statistical method for analysis of gait data.
Gait Posture Vol. 9, pp.10-17.
Maclure, M., Willett, W. (1987) Misinterpretation and misuse of the kappa statistic. Am J
Epidemiol No. 126, pp.161-169.
Õunpuu, S., Davis, R., DeLuca, P. (1996) Joint kinetics: interpretation and treatment decision-making in children with cerebral palsy and myelomeningocele. Gait Posture Vol. 4, pp.
62-78.
Romei, M., Galli, M., Motta, F., Schwartz, M., Crivellini, M. (2004) Use of the normality index for the evaluation of gait pathology. Gait Posture No. 19, pp. 85-90.
Romei, M., Galli, M., Motta, F., Schwartz, M., Crivellini, M. (2005) Reply to "Letter to the Editor". Gait Posture In press 2005.
Schutte, L., Narayanan, U., Stout, J., Gage, J., Schwartz, M. (2000) An index for quantifying deviations from normal gait. Gait Posture No.11, pp. 25-31.
Schwartz, M., Trost, J., Wervey, R. (2004) Measurement and management of errors in quantitative gait data. Gait Posture No.20, pp. 196-203.
Simon, S. (2004) Quantification of human motion: gait analysis - benefits and limitations to its application to clinical problems. J Biomech Vol. 37 Iss. 12, pp. 1869-1880.
Theologis, T., Thompson, N., Harrington, M. (2005) "Letter to the Editor". Gait Posture In press 2005.
Tingley, M., Wilson, C., Biden, E., Knight, W. (2002) An index to quantify normality of gait in young children. Gait Posture No. 16, pp. 149-158.
Troje, N. (2002) Decomposing biological motion: A framework for analysis and synthesis of human gait patterns. Journal of Vision No. 2, pp.371-387.
Uebersax, J. (1987) Diversity of decision-making models and the measurement of interrater agreement. Psych Bull No.101, pp. 140-146.
Zahedi, M., Spence, W., Solomonidis, E., Paul, J. (1987) Repeatability of kinetic and
kinematic measurements in gait studies of the lower limb amputee. Prosthet Orthot Int
10. Appendix 1 – Summary statements from reports
This appendix contains all relevant parts of summary statement first sentences from the clinician´s evaluation. Any information making it possible to identify the subject has been removed.1 Gång som präglas av kraftig återfall av droppfot vänster sida… 2 Det sagitella mönstret är bättre…
3 Man ser nu mindre översträckning av högerknäet, bättre uttalad andra rocker i fotleden… 4 Subjektiv rejäl förbättring enligt patienten, beror troligen på stabilare fot i stödfasen… 5 Man ser förbättrad knäflexion i sving…….dessutom en förbättrad fotledsdynamik… 6 Förbättrad gång och normala rotationer efter multilevelkirurgi…
7 Tyvärr åtminstone hittills försämrad gång postoperativt hos…..
8 …från tidigare bedömningar kvarstår derotation vänster höft men knappast rectustransfer vä… 9 Betydligt förbättrad gång hos…
10 Gångförmåga som i allt väsentligt tycks förbättrad…
11 En jämnare gång med bättre flyt där dynamiken förbättrats… 12 Gång som intressant nog förbättrats av operation av ett ben hos…
13 Gång hos……..ett år efter kirurgisk behandling där man ser betydande förbättringar… 14 Betydligt förbättrad gång där den sagitella kinematiken i stort sett normaliserats… 15 Vi ser inga egentliga förändringar jämfört förra gånganalysen…
16 Sammantaget från……. ser det som för……..mycket bra gång…. 17 Framför allt bättre höftdynamik post-op …
18 Patient som känner sig förbättrad efter multilevelkirurgi…….förbättrad knäledsdynamik… 19 Betydligt förbättrad gång som fortfarande präglas av stor benlängdsskillnad…
11. Appendix 2 – PCA calculations
This appendix contains data from the calculation of principal components. Both the original and rotated solutions are given.
UNROTATED SOLUTION
Squared factor loadings
Variable PC1 PC2 PC3
1 Mean hip rotation in stance (°) 0,941 0,003 0,056 2 Mean foot progression angle in stance (°) 0,925 0,025 0,049 3 Walking speed normalised by leg length 0,913 0,004 0,083 4 Peak dorsiflexion in swing (°) 0,872 0,019 0,109 5 Range of hip flexion (°) 0,795 0,011 0,194 6 Peak abduction in swing (°) 0,769 0,077 0,154 7 Time to toe off (% of gait cycle) 0,768 0,140 0,092 8 Cadence (steps / sec) 0,634 0,328 0,038 9 Minimum hip flexion (°) 0,539 0,086 0,375 10 Peak dorsiflexion in stance (°) 0,519 0,325 0,157 11 Mean pelvic tilt (°) 0,455 0,298 0,247 12 Range of pelvic tilt (°) 0,110 0,842 0,047 13 Mean pelvic rotation (°) 0,306 0,685 0,010 14 Range of knee flexion (°) 0,253 0,682 0,065 15 Knee flexion at initial contact (°) 0,309 0,667 0,024 16 Time of peak knee flexion (% of gait cycle) 0,204 0,386 0,410
Eigenvalues 9,314 4,577 2,108
Sum of eigenvalues 16,000
ROTATED SOLUTION
Squared factor loadings
Variable PC1 PC2 PC3
1 Peak abduction in swing (°) 0,948 0,014 0,038 2 Peak dorsiflexion in stance (°) 0,912 0,046 0,042 3 Peak dorsiflexion in swing (°) 0,873 0,073 0,053 4 Mean foot progression angle in stance (°) 0,811 0,074 0,115 5 Mean hip rotation in stance (°) 0,773 0,138 0,088 6 Walking speed normalised by leg length 0,741 0,213 0,046 7 Mean pelvic rotation (°) 0,007 0,984 0,009 8 Knee flexion at initial contact (°) 0,055 0,934 0,011 9 Range of knee flexion (°) 0,063 0,891 0,047 10 Cadence (steps / sec) 0,087 0,774 0,138 11 Mean pelvic tilt (°) 0,002 0,677 0,322 12 Minimum hip flexion (°) 0,087 0,012 0,901 13 Time of peak knee flexion (% of gait cycle) 0,031 0,095 0,874 14 Range of hip flexion (°) 0,202 0,112 0,686 15 Time to toe off (% of gait cycle) 0,367 0,006 0,627 16 Range of pelvic tilt (°) 0,459 0,469 0,072
Eigenvalues 6,418 5,512 4,070