Towards Scalable Performance Analysis of MPI
Parallel Applications
XAVIER AGUILAR FRUTO
Licentiate Thesis
Stockholm, Sweden 2015
TRITA-CSC-A 2015:05 ISSN-1653-5723
ISRN-KTH/CSC/A-15/05-SE ISBN 978-91-7595-518-6
KTH School of Computer Science and Communication SE-100 44 Stockholm SWEDEN Akademisk avhandling som med tillstånd av Kungl Tekniska högskolan framlägges till offentlig granskning för avläggande av teknologie licentiatexamen i datalogi ondsdagen den 20 maj 2015 klockan 10.00 i Visualization Studio, room 4451, Kungl Tekniska högskolan, Lindstedtsvägen 5, Stockholm.
© Xavier Aguilar Fruto, Maj 2015 Tryck: Universitetsservice US AB
iii
Abstract
A considerably fraction of science discovery is nowadays relying on com-puter simulations. High Performance Computing (HPC) provides scientists with the means to simulate processes ranging from climate modeling to pro-tein folding. However, achieving good application performance and making an optimal use of HPC resources is a heroic task due to the complexity of parallel software. Therefore, performance tools and runtime systems that help users to execute applications in the most optimal way are of utmost importance in the landscape of HPC.
In this thesis, we explore different techniques to tackle the challenges of collecting, storing, and using fine-grained performance data. First, we inves-tigate the automatic use of real-time performance data in order to run appli-cations in an optimal way. To that end, we present a prototype of an adap-tive task-based runtime system that uses real-time performance data for task scheduling. This runtime system has a performance monitoring component that provides real-time access to the performance behavior of an application while it runs. The implementation of this monitoring component is presented and evaluated within this thesis. Secondly, we explore lossless compression approaches for MPI monitoring. One of the main problems that performance tools face is the huge amount of fine-grained data that can be generated from an instrumented application. Collecting fine-grained data from a program is the best method to uncover the root causes of performance bottlenecks, however, it is unfeasible with extremely parallel applications or applications with long execution times. On the other hand, collecting coarse-grained data is scalable but sometimes not enough to discern the root cause of a perfor-mance problem. Thus, we propose a new method for perforperfor-mance monitoring of MPI programs using event flow graphs. Event flow graphs provide very low overhead in terms of execution time and storage size, and can be used to reconstruct fine-grained trace files of application events ordered in time.
iv
Sammanfattning
En betydlig del av vetenskaplig upptäckt görs nuförtiden med datornsi-muleringar. High Performance Computing (HPC) ger forskare möjligheten att simulera processer varierande från klimatmodellering till proteinveckning. Att uppnå god programprestanda och optimal användning av HPC-resurser är dock en heroisk uppgift på grund av komplexiteten av parallella program. Därför är prestandaverktyg och runtime-system som hjälper användarna att köra applikationer på det mest optimala sättet av största betydelse för HPC landskapet.
I denna avhandling, utforskar vi olika tekniker för att åtgärda utmaningar-na för insamling, lagring och användning av detaljerad prestandadata. Först undersöker vi den automatiska användningen av realtidsprestandadata för att köra program på eft optimal sätt. Vi presenterar en prototyp av ett adap-tivt uppgifts-baserad runtime-system som använder realtidsprestandadata för schemaläggning. Detta runtime-system har en prestandaövervakningskompo-nent som ger realtidsåtkomst till prestandadata från en applikation medan den körs. Utvecklingen av denna övervakningskomponent presenteras och ut-värderas inom avhandlingen. För det andra, utforskar vi nya MPI övervak-ningsmetoder för att minska mängden data som samlas in. Ett av de största problemen som prestandaverktyg möter är den enorma mängden detaljerad data som kan genereras från en instrumenterad applikation. Att samla detal-jerad data från ett program är den bästa metoden för att avslöja de grund-läggande orsakerna till prestandaproblem. Tyvärr det är omöjligt att göra så med extremt parallella applikationer, samt applikationer med långa exekve-ringstider. Å andra sidan, att endast samla statistisk data är skalbart men ibland inte tillräckligt för att urskilja den grundläggande orsaken till ett pre-standaproblem. Således föreslår vi en ny metod som använder händelseflödes-diagram för prestandaövervakning av MPI-program. Händelseflödeshändelseflödes-diagram ger mycket låg overhead i form av exekveringstid och lagringsstorlek, och kan dessutom användas för att rekonstruera detaljerade spårningsfiler med alla applikationshändelser ordnade efter tid.
Preface
This thesis consists of an introduction and four papers.
Paper I
Aguilar, X., Schliephake, M., Vahtras, O., Gimenez, J., & Laure, E. (2011, De-cember). Scaling Dalton, a molecular electronic structure program. In E-Science (e-Science), 2011 IEEE 7th International Conference on (pp. 256-262). IEEE.
The author of this thesis performed the performance analysis of the program, the speedup and efficiency tests, and wrote parts of the manuscript. The thesis author also presented the paper at the e-Science’11 conference.
Paper II
Schliephake, Michael, Xavier Aguilar, and Erwin Laure. Design and implementa-tion of a runtime system for parallel numerical simulaimplementa-tions on large-scale clusters. Procedia Computer Science 4 (2011): 2105-2114.
The first two authors co-designed the initial runtime system prototype. The author of this thesis developed the first prototype for the runtime monitoring component, participated in the experiments, and wrote parts of the text.
Paper III
Aguilar, Xavier, Karl Fürlinger, and Erwin Laure. Online Performance Introspec-tion with IPM. IEEE 15th InternaIntrospec-tional Conference on High Performance Com-puting and Communications & 2013 IEEE International Conference on Embedded and Ubiquitous Computing, 2013.
This paper extends the initial work introduced in Paper II. The first two authors developed in close collaboration the software presented in the paper. The author of this thesis designed and performed the experiments, and wrote the text of the manuscript. The paper was presented at the HPCC’13 conference by the thesis author.
vi
Paper IV
Aguilar, Xavier, Karl Fürlinger, and Erwin Laure. MPI Trace Compression Using Event Flow Graphs. Euro-Par 2014 Parallel Processing. Springer International Publishing, 2014. 1-12.
This paper is based on previous work by Dr. Karl Fürlinger. The author of this thesis implemented part of the software presented in the paper, performed some of the experiments, and wrote most of the text of the manuscript. The author of this thesis also presented the article at the Euro-Par’14 conference.
Acknowledgments
First of all, I would like to thank my supervisor Erwin Laure for giving me the opportunity to work in this exciting subject, for his assistance, and for letting me drive my research according to my interest. I would also like to thank Karl Fürlinger for all his support and for a very fruitful collaboration during the past two years. I thank Jens Lagergren for reading the manuscript and giving me many suggestions to improve it.
I would also like to thank my colleagues at the Department of High Performance Computing and Visualization, as well as at PDC, for a friendly and creative work environment. I thank Magnus Helmersson and Hannes Leskelä for proof reading my swedish abstract, and giving me great tips on how to improve it. Finally, I would like to thank my family and friends for their continuous support.
Financial support from SeRC (Swedish e-Science Research Centre) is gratefully acknowledged.
Contents
Contents viii
I
Introductory Chapters
1
1 Introduction 3
1.1 High Performance Computing and Scientific Discovery . . . 3
1.2 Motivation . . . 4
1.3 Thesis outline . . . 5
2 Performance Analysis 7 2.1 The performance data . . . 7
2.2 Data collection . . . 8
2.3 Data Storage . . . 9
2.4 Data Presentation and Analysis . . . 11
3 Challenges and Contribution 23
4 Papers Overview and Results 25
5 Conclusions and Future Work 29
Bibliography 33
II Included Papers
39
Part I
Introductory Chapters
Chapter 1
Introduction
1.1
High Performance Computing and Scientific Discovery
In the past decades, science has moved towards using computer simulations as an important method for scientific discovery. By using computers, scientists can model processes that would be difficult or impossible to test empirically in a real world scenario, for instance, climate modeling or molecular simulations at a particle level. Nevertheless, modeling the empirical world is complex, and requires huge computational power.
High Performance Computing (HPC) is the area of computer science that deals with the design and deployment of parallel computers that are among the most powerful computers in the world. According to the top500.org list, the current three most powerful supercomputers can perform over 15 Pflop/s (quadrillions of calculations per second) on the Linpack benchmark[12]. These supercomputers offer huge computational power, however, at the cost of heroic programming.
Scientists face several challenges when developing software for HPC systems. First, developers have to write parallel code to take advantage of HPC infrastruc-tures. A parallel application divides the problem into smaller parts that can be solved concurrently, that is, in several processors at the same time. This allows parallel applications to solve bigger problems in less time than sequential applica-tions. The bigger the parallel portion of a program, the higher the improvement in execution time over a sequential version of the same code[4].
Nevertheless, parallel programming brings in additional complexities to the clas-sical software development cycle. Developers have to choose wether to use processes, threads, or a combination of both. If a threaded model is chosen, then the pro-gramer has to further decide between different thread implementations such as OpenMP or Pthreads. In the case of using distributed processes, the programmer has to choose the communication library used, for instance, MPI or PVM. More-over, the developer has to decide the parallel model used too. Is it going to be a master-worker model? A Single Program Multiple Data (SPMD)? Maybe Multiple
4 CHAPTER 1. INTRODUCTION
Program Multiple Data (MPMD)? Such decisions affect strongly how the final code is engineered as well as its performance.
Another issue that application developers have to cope with is the size of HPC machines. The top 5 supercomputers in the Top 500 list have at least more than half a million cores1 each. More specifically, Tianhe-2, the current most powerful computer in the world, has 3,120,000 cores. In order to run at such extreme scales, applications have to be massively parallel and very well balanced. In other words, all cores have to perform a very similar amount of work. Otherwise, a lot of useful computing time is wasted in idle processors that wait for other slower processing elements.
The complexity of HPC computers play as well an important role in the challeng-ing task of parallel software development. Parallel computers are complex machines that have deep memory hierarchies with several levels of cache. Furthermore, su-percomputers use complicated network topologies to interconnect their processing elements. In addition, parallel systems are increasingly becoming more heteroge-nous by combining classical multiprocessors with accelerators, thereby, imposing and additional layer of parallelism that increases program complexity too.
In summary, application developers face several challenges to obtain good appli-cation performance: the hardware complexity, the selection of parallel programming paradigm, the implementation of the numerical methods used, and the application development process itself. Performance tools help to understand application be-havior and unveil performance problems resulting from the challenging task of par-allel software development. Therefore, they play a major role in the landscape of High Performance Computing. Unfortunately, as we will see in following chapters, they suffer from the same scalability problems as scientific parallel software.
1.2
Motivation
Performance analysis tools for HPC systems have been studied and developed for more than 20 years, thus, there is a broad range of tools and techniques available. However, the performance analysis field still faces challenges imposed by the size and complexity of the upcoming exascale systems. For instance, coping with extreme parallelism, huge amounts of performance data, new programming models, increase in failure rate, or more restrictive power constraints.
One of the main factors limiting tool scalability is the amount of data that can be generated from a monitored application. A monitoring framework can generate gigabytes of performance data in less than a minute of program execution. As a result, capturing fine-grained information from an application running on hundreds of thousands of processors, or with a long simulation time is infeasible. One solution to this problem is to collect only aggregate data. However, plain aggregated metrics are usually not sufficient to detect the root cause of certain performance problems. Therefore, methods for smart collection and filtering of fine-grained data need to
1.3. THESIS OUTLINE 5
be developed, for example, eliminating redundant data by saving information of certain program iterations or from a group of representative processes.
In addition, as performance data grows in size and complexity, the exploration of such data by human analysts becomes harder too. Automated analysis methods together with knowledge based reasoning that facilitate the task of performance analysis are needed. For instance, methods that not only perform a descriptive analysis of the data but provide specific conclusions through expert knowledge in conjunction with experiment context information. Furthermore, the use of expert systems is not useful only to humans but to other software too, e.g, runtime systems. A runtime system could utilize certain extracted knowledge to run applications as optimally as possible in a portable manner across platforms.
In this thesis, we take the first steps towards the development of scalable meth-ods for the collection and use of performance data from MPI programs. MPI has become a de facto standard in HPC computing and most scientific parallel applica-tions are MPI codes. An MPI program is a parallel application with a distributed memory model, that is, each process has its own address space. Data is moved from the memory space of one process to another process through the use of cooperative communication calls, or messages. Thus, understanding how the work is shared among processes and their communication patterns is essential to avoid problems such as processors waiting for data from other processors for a long time.
The problems we address in this licentiate dissertation are: the challenge of obtaining good portable parallel performance, and the scalability issues when col-lecting fine-grained performance data from instrumented applications. We tackle the first problem by designing a prototype of an adaptive task-based runtime system for numerical simulations. This runtime system contains a monitoring component that feeds performance data in real-time to the runtime scheduler, thereby, the system can react in real-time to the performance of the application executed. The monitoring component implemented for this purpose has very low overhead, and can be used in different situations such as resource scheduling, on-line data analysis, etc. Although the on-line use of data is one solution that minimizes the problems caused by keeping huge performance data repositories, there are many situations in which the data needs to be stored for later use. Therefore, we also address the challenge of collecting and efficiently storing fine-grained trace performance data. We present a new technique for MPI monitoring that balances the amount of data generated by coarse-grain methods with the precision of fine-grained data methods. This technique allows us to reconstruct fine-grained data repositories of MPI events from coarse-grained stored data.
1.3
Thesis outline
The remainder of this thesis is organized as follows. Chapter 2 gives an overview of performance analysis in High Performance Computing. The chapter starts pre-senting the data used in performance analysis, and follows describing tools and
6 CHAPTER 1. INTRODUCTION
techniques to collect and store such data. Thereupon, tools for performance data visualization and exploration are presented. Chapter 3 describes the challenges and contributions of this thesis. Chapter 4 gives a summary of the papers and results included in this thesis. Finally, the thesis ends with conclusions and future work in Chapter 5.
Chapter 2
Performance Analysis
Performance analysis of parallel applications consists in the collection and exami-nation of data that can shed light onto the performance problems of an application. This performance analysis process is mainly defined by three factors: what data is used in the analysis, how this data is collected and stored, and when this data is analyzed.
Following these three premisses, this chapter describes the state-of-the-art in performance tools for HPC systems. First, it introduces common measurements used to characterize the performance of an application. Afterwards, it reviews the methods used to collect, issue, and store such performance data. Finally, tools for analyzing the data, either visually or automatically, are presented.
2.1
The performance data
Analyzing the performance of an application is a complex process that involves several actors: the application itself, the system software layer, and the hardware architecture. Thus, the number of different parameters that can be measured is large, for example, time, hardware performance counters, measurements from the programming model, energy consumption, etc.
One of the most used parameters to measure performance is time, for in-stance, time spent in certain regions of the application. Time can be easily ob-tained through operating system calls such as gettimeofday(), clock_gettime(), or
getrusage(). In x86 processors, time can also be computed by accessing directly the
Time Stamp Counter (TSC) register.
Hardware performance counters are a valuable tool to measure how an ap-plication behaves in a certain platform. These performance counters, present in most modern microprocessors, are registers built in the processor that count dif-ferent hardware events, e.g., number of instructions completed, number of floating point operations, number of cache misses, or cycles stalled for a certain resource. Most processor manufacturers provide interfaces to access these counters, however,
8 CHAPTER 2. PERFORMANCE ANALYSIS
most developers access them through the Performance Application Programming Interface (PAPI) [40], a standard programming interface portable across platforms. Processor performance counters are nowadays an everyday measure used in per-formance analysis, nevertheless, the emergence of new hardware has fostered the appearance of new counters beyond the CPU: Myrinet and Infiniband network counters[55], Cray Gemini Performance Counters [44], or GPU counters [37].
Metrics related to the operations performed by the application and the program-ming model are other valuable resources to measure the performance of a program, for instance, measuring the bytes read and written from disk by POSIX-IO calls. In the case of message-passing applications, typical measurements are the number of messages sent and received, and the size of those messages.
Power has become an important constraint in the HPC field, therefore, perfor-mance tools have started to incorporate support for the collection and investigation of energy consumption. The Score-E project [51] aims to provide user-friendly anal-ysis tools for the study of energy consumption of HPC applications. The work in [23] investigates the use of new on board energy sensors (RAPL counters) for CPU power measurement to correlate power consumption to specific program functions. Moreover, power consumption is becoming, in a similar manner to time, not only a measurement but an optimization goal too.
All the metrics presented above are beneficial to assess the performance of an application, however, they are of little use without any correlation to actual parts of the source code. Thus, performance tools record measurements of code locations too. These code locations can go from simple program counter (PC) values to complete call stacks obtained through libraries such as libunwind [57].
2.2
Data collection
Performance data is captured mainly using two different methods: instrumentation and sampling. Instrumentation consists of inserting probes or hook points into the application that are intercepted by the monitoring software. When the application reaches one of these hook points, the control is transferred to the monitoring tool that performs the proper actions to record the required data. Afterwards, the control is transferred back to the application and the execution continues normally. There are many tools that offer instrumentation capabilities. OPARI[39] is a source-to-source translator that adds the necessary calls to instrument the OpenMP runtime. The Program Database Toolkit (PDT) framework[33] is used by tools such as TAU[52], and Score-P[31] to insert instrumentation hooks during the compilation process. Compilers such as GCC and Intel provide function instrumentation at compilation time too. Dyninst[10], and Intel PIN[36] provide mechanisms for binary re-writing at runtime. In addition, certain programming libraries such as MPI offer an interface (PMPI) to intercept the entry points of the calls implemented by such a library.
2.3. DATA STORAGE 9
In contrast, sampling consists in taking measures of the performance status of an application when a recurring event is triggered, for instance, when a timer expires. Thereby, measurements are independent to the behavior of the application. Tools with sampling capabilities are gprof[22], Open|SpeedShop[50], Extrae[56], or HPCToolkit[2]. Extrae, for instance, provides two different sampling mechanisms: timer signals and performance counters. The first method, triggers the sampling every certain interval whereas the second method samples the program each time a processor performance counter reaches a certain value.
Sampling is much less intrusive than instrumentation because the program is only disturbed when the samples are taken, whereas with instrumentation the pro-gram is disturbed every time a certain event happens, for instance, entering and exiting a system call, a user function, a library call, etc. However, sampling can lead to loss of information since microscopic effects between two samples are not captured. The granularity of sampling methods can be changed by increasing the frequency of the samples, however, at a cost of more application overhead and per-turbation of the measured data. In addition, samples are very hard to correlate to specific events within an application.
2.3
Data Storage
In the performance analysis field, the collected data is usually stored in two different forms: profiles and event traces. The choice of how the performance data is emitted and stored influences heavily the scalability of the tool as well as the process of analyzing such data.
Profiles
Profiles are reports with aggregated statistics concerning the execution of an appli-cation, for instance, statistics on the amount of time spent across different functions. Performance profiles can be generated with very low overhead because the amount of data that needs to be managed and stored is small. For example, whereas a tracer records every occurrence of a certain event, a profiler only keeps a counter with the accumulated time for such event. Although profiles can provide a good overview about the behavior of an application, they lack the temporal order of data needed for in-depth performance analysis.
Gprof[22] generates profiles with information on program functions of sequential applications. Gprof shows counts, timing information, and a call graph for such profiled functions. Gprof utilizes a mix of sampling and function instrumentation to collect the required data.
mpiP[61] is a profiling library for MPI applications. It presents different statis-tics on the MPI calls across processes and call sites such as counts, timings, and message sizes. It also gives information on the MPI I/O activity.
The Integrated Performance Monitoring (IPM)[18] tool is a light-weight profiler for parallel applications. It generates rich reports containing statistics for several
10 CHAPTER 2. PERFORMANCE ANALYSIS
program events such as MPI operations, OpenMP regions, or Posix I/O operations. It has been widely used by HPC centers such as NERSC to collect more than 310K batch profiles in the past 6 years.
Open|Speedshop[50] generates different performance profiles according to an extensible set of experiments that let users choose what sort of performance data needs to be generated. Moreover, Open|Speedshop also provides mechanisms for comparing experiments from different runs.
TAU[52] is a performance toolkit that offers a rich variety of instrumentation capabilities, and provides different profile variants. The most simple one is flat
profiles, that is, reports containing aggregated statistic for interval events, i.e.,
functions. On top of that, TAU provides profiles that show statistics for the different call paths executed by an application. Finally, TAU also offers a third variant of profiles called phase profiles. This approach aims at showing the performance of the application relative to different execution phases marked by the developer within the source code.
Scalasca[20] is a tool that uses instrumentation to generate call-path profiles summarized during runtime. These profiles contain several metrics associated to the call-paths executed by the application, for example, execution times, call-path counts, hardware counters, MPI statistics, and OpenMP costs.
HPCToolkit[2] provides call-path profiles generated using sampling together with a sophisticated stack walk, and on-the-fly binary analysis.
Event Traces
Event traces are time-stamped log files that contain a record of every event per-formed by the application ordered in time. While they offer extensive information about the time varying behavior of an application, they lack scalability due to their size. Typically, event traces contain records for the entry and exit of functions from user code and libraries. These records can have additional information associated such as hardware counters, or links to the source code.
Extrae[56] from the Barcelona SuperComputing Center (BSC) uses different instrumentation mechanisms to generate traces from several programming models such as MPI, OpenMP, CUDA, OpenCL, or Pthreads. Extrae traces are ASCII text files that contain time-stamped records for the beginning and end of application events. For instance, function calls, MPI calls or OpenMP regions. Each one of those records has additional information associated such as hardware counters or links to the source code. The traces created with Extrae can be analyzed afterwards with Paraver[45].
The Score-P[31] measurement infrastructure is a joint effort of several research centers to develop an unified framework for application tracing. Score-P generates trace files in a similar manner than Extrae but encoded using the OTF2 format[13]. OTF2 is a binary event trace data format with focus in scalability. It uses different encoding techniques to increase memory efficiency during runtime measurement,
2.4. DATA PRESENTATION AND ANALYSIS 11
reducing trace size and trace memory footprint. Traces generated with Score-P can be analyzed afterwards using Scalasca[20], Periscope[8], Vampir[29], and TAU[52]. As previously mentioned, one of the main problems when using traces is their lack of scalability due to the huge amount of data they contain. Thus, several groups have investigated on new scalable methods for event trace generation and analysis.
Scalatrace [43] provides on-the-fly lossless trace compression of MPI communi-cation traces. It implements intra-node compression describing single loops with regular section descriptors (RSDs) [24]. These RSDs are represented with tuples in the form of < length, event1, ..., eventn> where length is the loop count and events
are MPI calls. For example, < 100, M P I_Send, M P I_Recv > would represent a loop with 100 iterations of alternating send and receive operations. Scalatrace implements inter-node compression merging similar calls across processes, and pro-vides a replay mechanism for later analysis of compressed traces. In addition, Bahmani et al. [5] implemented a two-level clustering within Scalatrace to clas-sify processes and generate traces from just a few representatives. The first level of clustering classifies processes regarding their MPI execution paths using 64 bit path signature values. The second level of clustering sub divides those main clusters into sub-clusters regarding the parameters used in the MPI calls.
Krishnamoorthy et al.[32] create context-free grammars from the sequence of MPI calls using SEQUITUR. In order to achieve better compression, the trace is not compressed at an event level, but instead every call argument is compressed in a different stream.
Knüpfer et al. use Complete Call Graphs (CCGs) to compress post-mortem traces according to the call stack [30]. This approach replaces similar sub-trees in a call graph with a reference to a single instance in order to reduce the memory footprint of trace analysis tools.
2.4
Data Presentation and Analysis
The process of performance analysis consists in establishing questions, and then, using the collected data to answer such questions. Therefore, data visualization and exploration, that is, the task of mapping performance data onto graphical displays is essential in the cycle of performance evaluation.
As previously mentioned, performance tools can be divided according to how they emit the collected data. We can talk about profiles if the data is aggregated, or traces if each event is kept individually. Moreover, tools can be further subdivided according to when the data is analyzed. Thereby, we have post-mortem tools if the data is analyzed once the application has finished, and on-line analysis tools if the analysis is performed during the execution of the application. On-line analysis techniques can also be used post-mortem with the data stored in disk. Following this classification, the next subsections present visualization techniques and
analy-12 CHAPTER 2. PERFORMANCE ANALYSIS
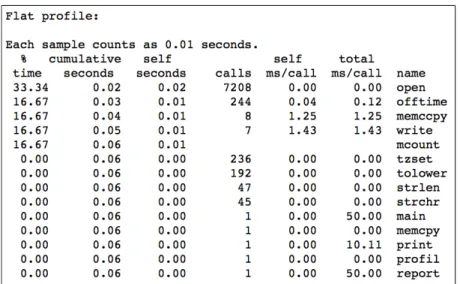
Figure 2.1: Flat profile output from Gprof. For each function executed, the profile shows different statistics on the number of calls, the percentage of time spent, etc. Image obtained from the gprof manual.
sis tools for post-mortem profile analysis, post-mortem trace analysis, and on-line analysis.
Post-mortem Profile Visualization
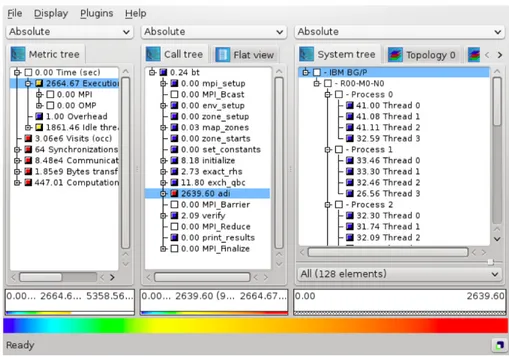
Since profiles are reports with aggregated statistics, the simplest method for post-mortem profile visualization is in the form of plain-text files such as the ones given by Gprof[22], mpiP[61] or CrayPat[11]. Figure 2.1 depicts a flat profile obtained with Gprof. It shows how time is spent across different functions within a program. Scalasca’s CUBE [19] is a graphical user interface for the interactive exploration of performance data from parallel programs. CUBE presents the data in three hierarchical dimensions: metrics, call-tree (the program), and system as shown in Figure 2.2. The metrics tree (left tree) presents performance metrics such as communication time or performance counter values, going from general to specific. For instance, it starts with a node containing execution time that can be expanded into several nodes where the time is split in MPI time, OpenMP time, etc. The call-tree view (central call-tree display) shows all the call-paths executed by the application. Finally, the system view (right tree display) displays processes/thread in a tree, or in a 2D/3D Cartesian grid. All three displays are linked, and contain small colored boxes that can help in the task of identifying hotspots. Their color is determined from the proportion of the value represented by such a box against a total or reference value, using the color gradient at the bottom of the window.
2.4. DATA PRESENTATION AND ANALYSIS 13
Figure 2.2: CUBE Visual display. Left tree browser shows metrics, the center display shows the program call tree, and the right browser shows program entities. Image extracted from CUBE 4.2.3 user guide.
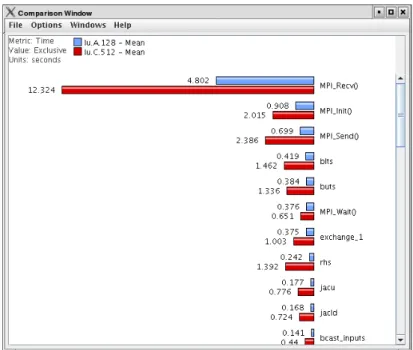
Paraprof [7], the visualization framework for TAU, provides different charts to explore aggregate data, for example, views on statistics per thread, call-path graphs, and 3D plots. Figure 2.3 shows statistics on the time spent in several functions per thread. Paraprof also offers comparison of profiles from different ex-periments through the PerfDMF[25], a framework for the storage, management, and processing of performance data from multiple experiments. Figure 2.4 com-pares the execution times of several functions from two different runs of the LU benchmark.
In a similar manner, hpcviewer [3], the graphical user interface of HPCToolkit, presents call-path profiles correlated to program structure. It displays metrics col-lected during one or more runs, shows derived metrics expressed as formulae com-posed by other existing metrics, and points users to the relevant parts of their code with the use of hot path analysis.
Post-mortem Trace Visualization
In contrast to profiles, traces keep a log of ordered events occurred during the life-time of an application. Thus, traces are very useful to perform in-depth fine-grained
14 CHAPTER 2. PERFORMANCE ANALYSIS
Figure 2.3: Paraprof showing time spent in different functions per thread. Each colored column represents a user function. Each box within a column a different thread. Image obtained from Paraprof User Guide.
Figure 2.4: Paraprof view displaying execution times of several functions from two different runs of the LU benchmark. Image extracted from Paraprof User Guide.
2.4. DATA PRESENTATION AND ANALYSIS 15
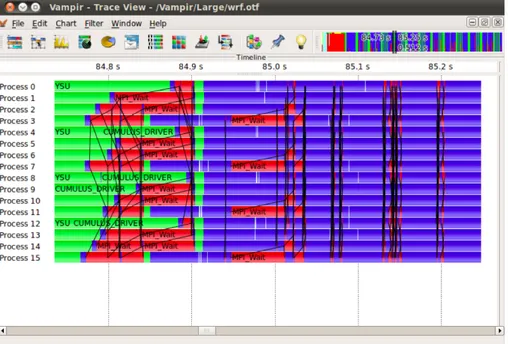
analysis. Examples of performance analysis GUIs specialized in trace exploration are Paraver[45], Vampir[29], hpctraceview[2] or Jumpshot[65].
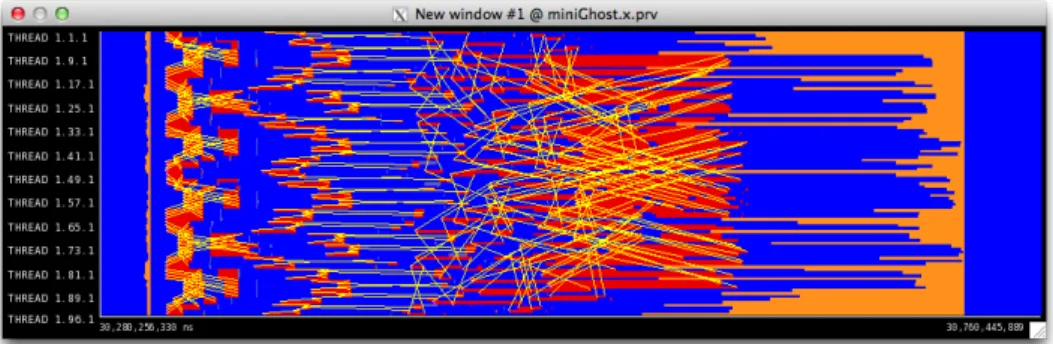
One of the main visualization strengths of trace visualizers are the so-called timeline views. A timeline is a 2D view where time is represented along the x-axis, computing abstractions such as processes, threads or processors along the y-axis, and everything is colored regarding some metric. Figure 2.5 shows a Paraver time-line for MiniGhost[6], a stencil mini-application from the Mantevo project[58]. Time is represented along the x-axis and MPI processes along the y-axis. The timeline is colored according to the process state, that is, if the process is in a running state, waiting for a message from another process, in collective communication, etc. Yellow lines in the timeline are point-to-point communication between processes. Figure 2.6 displays a timeline view of the Vampir visualization tool. As it can be seen, the philosophy of operation between tools is the same, however, in this case the Vampir timeline is colored regarding function call, not process state.
Figure 2.5: Paraver timeline view. Time represented along the x-axis and MPI processes long the y-axis. Colors encode the state of the MPI process, i.e., blue is running, red is blocked waiting a message, and orange is in collective communica-tion. Yellow lines are point-to-point communication between processes.
Timeline views are very useful to visualize the evolution of processes over time, however, timelines have some constraints. First, the amount of data that can be presented is limited by the screen resolution. For example, we cannot have in a timeline more threads than pixels allowed by the screen resolution. Secondly, as the amount of data presented increases, it gets harder for a human being to extract any useful information from such a view. For instance, it is harder to obtain a con-clusion from a timeline displaying hundreds of thousands of communication lines among processes than from a simple plot with statistics about the communication pattern of the application. Therefore, trace visualizers also provide other means to explore trace data. Paraver provides different statistic displays to perform numer-ical analysis of the data contained in the trace. These displays offer the user the ability to freely create, combine, and correlate different metrics computed from the
16 CHAPTER 2. PERFORMANCE ANALYSIS
Figure 2.6: Vampir timeline view. Processes are colored by function call. Black lines are communication between processes. Image extracted from Vampir 7 User Manual.
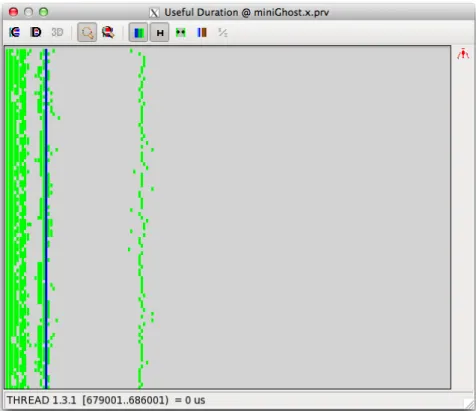
trace. Figure 2.7 shows a profile with the percentage of time spent in each MPI call over total MPI time. Paraver takes this idea further with the use of histograms. Figure 2.8 shows a histogram of the distribution of computation burst duration per process. On the y-axis we have processes, and in the x-axis histogram bins that represent the duration of computation between two MPI calls. In this case, bins are colored with a gradient color from light green to dark blue depending on the total amount of time contained in that bin. In brief, with this view we have for every thread a histogram of the duration of its computation bursts between MPI calls. If the application is well balanced, computational bursts form columns in this histogram since they have similar durations across processes.
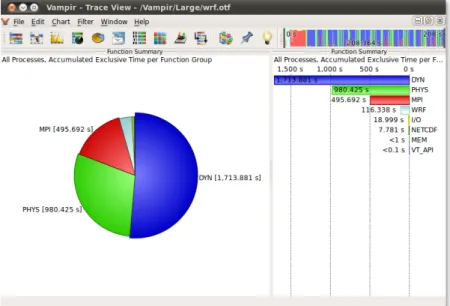
In a similar manner, Vampir provides a set of predefined statistical charts that show accumulated measurements computed from a trace. For example, Figure 2.9 shows the accumulated time across functions and processes, and Figure 2.10 shows the communication matrix, that is, statistics on the messages sent between pro-cesses.
2.4. DATA PRESENTATION AND ANALYSIS 17
Figure 2.7: Paraver profile showing the percentage of MPI time spent on each MPI call for the MiniGhost application.
Expert systems
As previously stated, the increase in size and complexity of HPC systems implies an increase in size and complexity of the performance data collected too. Thereby, complicating its posterior analysis by a human user. Thus, different efforts from the performance tools community are driven towards the design of automatic methods for performance analysis.
AutoAnalyzer [34] uses two clustering algorithms to investigate the existence of performance bottlenecks in SPMD programs. First, it uses source-to-source code instrumentation to divide the application in different code regions, and collects per-formance data for each one of them. Thereupon, it clusters the regions according to the performance metrics collected to discover dissimilarity and disparity per-formance problems. Dissimilarity bottlenecks refers to different behavior among processes, that is, imbalance. These bottlenecks are detected when a program
re-18 CHAPTER 2. PERFORMANCE ANALYSIS
Figure 2.8: Paraver histogram of computation burst duration in MiniGhost. The Y-axis contains MPI processes and the X-axis histogram bins. Bins are colored from green to blue according to the total amount of time spent in the bin.
gion is grouped into different clusters depending on the MPI process. Disparity bottlenecks, on the other hand, refers to significantly different contributions of cer-tain code regions to the overall performance of the application. Once bottlenecks are found, AutoAnalyzer also tries to find the root causes of such performance problems using rough sets and decision tables.
The EXPERT system [62, 63, 64] included in Scalasca searches sequentially in event traces for certain patterns that result from execution inefficiencies of MPI/OpenMP programs. The performance properties known by EXPERT are or-ganized in a hierarchical manner where upper levels represent more general aspects such as time in MPI, whereas deeper levels correspond to more specific problems such as late sender. These performance properties are defined as Python[60] classes that describe the event patterns to be found in the trace. This class repository can be extended to meet user specific needs. After the automatic analysis performed by EXPERT, the performance properties found in the trace are represented in a visual
2.4. DATA PRESENTATION AND ANALYSIS 19
Figure 2.9: Vampir function summary view showing time spent across functions for all processes. Image extracted from Vampir 7 User Manual.
Figure 2.10: Vampir communication matrix view showing statistics on the messages sent between processes. Image extracted from Vampir 7 User Manual.
20 CHAPTER 2. PERFORMANCE ANALYSIS
manner with CUBE. EXPERT has also been extended with a parallel version in [21] to reduce the amount of time needed for the automatic trace analysis. In addition, Böhme et al.[9] extended Scalasca to automatically identify the responsible delays and the cost of wait states in MPI traces.
KappaPI [14] and KappaPI 2 [28] analyze traces from MPI and PVM programs looking for patterns that cause performance inefficiencies. In KappaPI 2, new rules can be added to the catalogue of known bottlenecks using the APART Specifica-tion Language (ASL) [15]. KappaPI 2 also performs source code analysis to relate bottlenecks to the source code as well as provide suggestions to improve the per-formance.
The SCALEA [59] toolkit is a performance analysis framework that provides automatic analysis and classification of overheads, multi-experiment analysis, and storage of relevant performance information in a database. Aksum [17] is an au-tomatic multi-experiment analysis tool based on a set of problems and machine size values. It uses the SCALEA monitoring module and encodes the performance properties with JAVAPSL [16].
On-line analysis
Another approach to cope with the large-volumes of performance data generated when monitoring parallel applications is the use of automatic on-line analysis tech-niques, for instance, analyzing the data on-situ while the application runs to avoid the storage of the whole data set.
Llort et al.[35] implemented a distributed system over MRNet [48] that auto-matically inspects and filters the data collected. It uses clustering techniques to detect the structure of the application, that is, its repetitive behavior. Thereby, they keep data for only a few selected representative iterations.
Nickolayev et al.[42] use K-means statistical clustering in the Pablo Performance Environment [46] to record event traces from only some representative processors. Paradyn [38, 49] uses a set of agents over MRNet to perform a distributed search of performance problems within an application while it runs. This search is iterative, that is, it starts evaluating some general performance property and then, it creates new experiments to test more refined hypothesis in a hierarchical manner. Periscope [8] implements the same principle than Paradyn.
Autopilot [47] proposes a set of performance monitors together with decision procedures to perform adaptive control of applications. The monitors obtain per-formance data that is fed into a fuzzy-logic inference engine. Then, a set of actuators implement the policy decided by the inference engine, for instance, changing some application parameter.
Active Harmony [54] provides an infrastructure to tune applications at runtime depending on some observed performance, for example, changing the library or the algorithm used.
In addition to on-line automatic analysis, a few performance frameworks provide on-line access to the performance data while the application runs. This data on
2.4. DATA PRESENTATION AND ANALYSIS 21
demand is really useful for software components that need real-time information such as a runtime system that takes advantage of real-time performance data to improve its decision process on resource allocation. Another example could be an external visualization framework that displays remotely the performance of a system in real-time.
Score-P [31] provides an interface that enables external remote clients to retrieve performance profiles over TCP/IP using sockets. TAUg [26] provides performance data collected by TAU based on views. A view comprises one single metric for a single event within the application. TAUg uses the MPI library to share views among processes in a transparent way to the user. TAUoverSupermon [41] couples the TAU performance system with the Supermon [53] Cluster Monitoring system to provide an on-line measurement framework.
Chapter 3
Challenges and Contribution
As previously stated, achieving good parallel performance is difficult due to the size and complexity of HPC systems. Developers have to write software that runs on thousands of processors, communicates through complex networks, and uses deep memory hierarchies. Thus, knowing the behavior of an application in a certain platform is of utmost importance to use resources efficiently.
There are two approaches to improve application performance. The first one is to analyze the behavior of the application with performance tools and optimize it by hand afterwards. This approach, however, requires certain advanced skills and expertise in computer science. The second approach consists in using automatic methods such as an optimizing compiler, an auto-tuning framework or a runtime system. A runtime system is a piece of software responsible of matching applica-tion needs to computing resources in an optimal way. Runtime systems hide the complexity of the underlying architecture and free developers from burdens such as task scheduling or resource management. They also provide portable performance by hiding the specific hardware characteristics of a certain platform. Furthermore, some runtime systems even free developers from the task of parallelizing their codes, for example, by using compiler pragmas to mark tasks in the code that will be au-tomatically scheduled in parallel. This task scheduling process driven by a runtime system can be improved if such runtime system has into account the performance behavior of the application. Thus, performance monitoring infrastructures that provide performance information both to end-users and other software components such as runtime systems are essential to enhance application performance.
One of the main challenges that performance monitoring infrastructures face nowadays is the huge amount and complexity of the data generated from a mon-itored application. Understanding the performance problems of an application is a daunting task that requires data from multiple sources such as the application itself, the hardware platform, the programming model used, the operating system, etc. Therefore, applications generate a considerable amount of fine-grained per-formance data that increases with the number of cores used. For instance, one
24 CHAPTER 3. CHALLENGES AND CONTRIBUTION
application running in thousands of cores produces gigabytes of fine-grained per-formance data in seconds of execution. In addition, as the execution time of an application increases, so it does the amount of performance data collected as well. Therefore, saving fine-grained information of the whole execution of a parallel ap-plication for its posterior analysis is not feasible. In contrast, generating reports with only statistics is a scalable solution but it is not always sufficient to discern the root causes of a performance problem.
In this thesis we address two different problems. First, the complexity of an-alyzing and tuning an application to obtain good parallel application efficiency. To that end, we propose a task-based runtime system that accesses performance data in real-time to run applications in the most efficient way. Thereby, helping software developers to improve the efficiency of their applications. And second, we tackle the problem of collecting huge amounts of fine-grained performance data from an application. We explore new methods that balance the low overhead of coarse-grained data collection with the richness in information of fine-grained data acquisition. In other words, we investigate the efficient gathering of coarse-grained performance data that can be used to reconstruct fine-grained data repositories.
The contributions of this thesis licentiate are enumerated below. For a thorough discussion about each one of them, please refer to the corresponding paper.
• We demonstrate the use of performance analysis tools in a real-world sce-nario. To that end, we analyze and optimize Dalton[1], a molecular electronic structure program used by scientists around the world.
• We present a design and an initial prototype of a task-based adaptive runtime system for parallel numerical simulations aimed at increasing the parallel efficiency of applications in real-time. This runtime can dynamically react to application behavior by means of a monitoring component that provides real-time performance data while the application runs.
• We present an implementation and detailed evaluation of a monitoring compo-nent with on-line introspection capabilities that provides access to the perfor-mance behavior of an application while it runs. This monitoring component introduces almost no overhead and can be used as a foundation for any piece of software that uses performance data in real time, for instance, a runtime system or a performance analysis tool.
• We introduce the use of graphs as a compressed representation of MPI event traces. We demonstrate how event flow graphs can be used to model the communication and computation patterns of MPI programs, requiring much less disk space than regular communication traces. Thereby, reducing the scalability problems on performance tools imposed by the amount of data that needs to be stored.
Chapter 4
Papers Overview and Results
Paper I
Aguilar, X., Schliephake, M., Vahtras, O., Gimenez, J., & Laure, E. (2011, De-cember). Scaling Dalton, a molecular electronic structure program. In E-Science (e-Science), 2011 IEEE 7th International Conference on (pp. 256-262). IEEE.
In this paper we analyzed and optimized Dalton, a molecular electronic structure program. The analysis was performed with Paraver, a state-of-the-art performance analysis tool that helped us to discover various computation and communication bottlenecks within the program, for instance, bad communication patterns and un-optimized loops in critical code sections. In addition, the analysis helped us to bet-ter understand the structure of the application and its execution model paradigm. The master-worker model used in Dalton was refactored and changed to teams of master-workers, thereby, adding another level of parallelism. Through this, Dalton was able not only to compute one function in parallel within a team of workers but several functions in parallel among teams of master-workers. Thus, reducing the execution time considerably. This new approach increased the scalability and doubled the efficiency of Dalton. The percentage of computation increased from 70% to 86%, reducing the time spent in MPI for worker processes from 30% to 14%. As a side effect, the work performed in this paper let us experience the scal-ability problems in performance tools caused by the huge amount of fine-grained performance data produced when running on a thousand processors. For instance, filesystem overloading when generating traces, and long analysis times when pro-cessing and exploring such traces.
Paper II
Schliephake, Michael, Xavier Aguilar, and Erwin Laure. Design and implementa-tion of a runtime system for parallel numerical simulaimplementa-tions on large-scale clusters. Procedia Computer Science 4 (2011): 2105-2114.
26 CHAPTER 4. PAPERS OVERVIEW AND RESULTS
This article proposes a task-based runtime system for numerical simulations that reacts in real-time to application performance. This runtime system is composed of a resource manager, a library for runtime administration and a performance monitoring component. The monitoring element feeds data to the runtime admin-istration as the application runs, for instance, time spent in user and system mode, floating-point performance, number of cache misses, or the amount of data sent and received between tasks. Thereby, the resource manager can use this information in real-time to schedule tasks on top of different hardware resources in an optimal manner.
A first prototype of the proposed runtime was tested using a molecular dynam-ics kernel simulating the collision of two bodies. This application was divided into different tasks that could be scheduled and executed by the runtime, for instance, the computation of particle forces, the computation of particle speeds, and the computation of particle positions. These top-level tasks were further subdivided into subtasks. The experiments were performed with four different implementa-tions of the molecular dynamics kernel. One was a simple parallelization using MPI, another using MPI but overlapping communication and computation, the third implementation using OpenMP for the computation of forces in the system, and the last implementation, combining the overlapping of communication with computation and OpenMP for the calculation of forces.
The tests showed that in general the load balancing performed by the runtime prototype reduced the execution time of the application tested. However, a few configurations did not improve their execution time due to limitations in the first runtime prototype, for example, lack of thread pinning capabilities when more than one processor was available per process. Nevertheless, these limitations are planned to be fixed in future versions of the runtime system.
Paper III
Aguilar, Xavier, Karl Fürlinger, and Erwin Laure. Online Performance Introspec-tion with IPM. IEEE 15th InternaIntrospec-tional Conference on High Performance Com-puting and Communications & 2013 IEEE International Conference on Embedded and Ubiquitous Computing, 2013.
This paper presents the implementation details and a complete evaluation of a full-working version of the monitoring component introduced in Paper II. This monitoring component implements a performance introspection API (PIA), built on top of the Integrated Performance Monitoring (IPM) tool, that provides access in real-time to the performance data collected from an application while it runs. In contrast to other tools, our approach is not thought to be an independent stan-dalone tool but an integrated monitored system within an application or runtime system. Thus, our solution provides each process with a view of its own local performance in real-time with very low overhead through an API written in C.
27
This API, the Performance Introspection API (PIA), provides access to two different entities: regions and activities. Regions are measurement intervals defined by the user within the application, whereas activities are statistics associated to certain program events such as MPI calls, Posix I/O calls, or OpenMP regions. Metrics associated with regions are wall clock time, CPU time, MPI time within the region, region count, and hardware performance counters. For activities, it depends on the type of activity. For example, the MPI_Recv activity would have associated the total time in the call, maximum and minimum call time, and number of bytes received by the call.
We tested the Performance Introspection API with two synthetic benchmarks, and with Sweep3D[27], a solver that models 1-group-time-independent coordinates (Sn) 3D cartesian (XYZ) geometry neutron transport problem. The first experi-ment involved the synthetic benchmarks and served to measure the access time to regions and activities. The average access time for a single regions never exceeded 250 ns for the first 8,000 regions defined within a program. For activities, their access time is higher since they are computed on-the-fly from a hash table. Never-theless, this time never exceeded 850 microseconds with a half-full hash table, as it is usually the case with many real applications[18].
The second experiment, performed with Sweep3D, served to measure the total overhead introduced in a real application. On each program iteration of Sweep3D, we checked the total time, the average time and the number of occurrences of the MPI_Send and MPI_Recv calls. We also queried the performance information (wallclock time, MPI time and number of instances executed) of the function sweep. We run Sweep3D with weak scaling up to 8,160 processors, being able to access the performance data on demand on each program iteration with less than 1% of program overhead. In other words, the total execution time of the program increases only 1% with the overhead introduced by the tool.
Finally, the paper presents a test case where the Introspection API was used together with processor frequency scaling to reduce the power consumed by a basic molecular dynamics kernel. The test case simulated a random collection of Argon atoms in a flat box and was unbalanced for the purposes of the experiment. We used the Performance Introspection API to check the percentage of time in communi-cation and computation per iteration on each process. Then, processor frequencies were adapted regarding process workload, thereby, saving power but maintaining a similar execution time. With this simple frequency scaling approach we could reduce the node power consumption by 13%.
Paper IV
Aguilar, Xavier, Karl Fürlinger, and Erwin Laure. MPI Trace Compression Using Event Flow Graphs. Euro-Par 2014 Parallel Processing. Springer International Publishing, 2014. 1-12.
ap-28 CHAPTER 4. PAPERS OVERVIEW AND RESULTS
plications using event flow graphs. Event flow graphs are directed graphs in which nodes represent MPI calls, and edges the transitions between such MPI calls. In other words, edges are the computational parts between two MPI calls. Our event flow graphs have edge sequence numbers regarding their execution order. With this information, any ordered sequence of events performed by the application can be reconstructed by traversing the graph in ascending order. Moreover, each graph el-ement has different performance metrics associated, converting thereby such graphs in enriched performance profiles. In summary, our event flow graphs are profiles that capture the temporal order of events, and thus, they can be used to reconstruct traces with the full sequence of application events ordered in time.
We tested our monitoring approach with event flow graphs using several mini-applications from the NERSC-8/Trinity Benchmark Suite. First, we measured the overhead introduced into the applications when capturing and writing the graphs to disk. The experiments showed that this overhead never exceeded 2% of total application running time.
Our second experiment consisted in measuring the compression ratios achieved with the event flow graphs. These compression ratios were computed comparing standard full event traces of each application with their respective event flow graphs. Both graphs and traces contained the same amount of information. For each MPI call, we stored the call name, bytes sent or received, communication partner, and call site. It is important to remark that each trace could be exactly reconstructed from their corresponding event flow graph. The experiments showed promising results, achieving compression ratios from 1.79x up to 119x. In terms of file size, a 119x compression ratio implies that the required disk space for storing the event flow graphs for one of the tested applications is only 10 MB, compared to 1.1 GB required for the complete set of regular trace files. This gain comes from the fact that graphs can encode structural data such as loops of events that do not need to be repeated for every event as typically done with tracers.
Our last experiment measured the increase in file size of standard traces and event flow graphs as we incremented the number of simulation time steps. The tests showed that trace files increased linearly with the number of time steps whereas event flow graphs did not. This increase in event flow graph size was caused by the addition of new nodes and edges in the graphs due to the execution of different call paths across loop iterations. However, for applications that repeated the same loop with the same MPI calls (same transfer size, communication partner, etc) the flow graph size was constant.
Chapter 5
Conclusions and Future Work
In this thesis we have presented our first steps in the development of a scalable per-formance monitoring infrastructure for MPI applications with on-line introspection capabilities. First, we have proposed and implemented a prototype of a task-based runtime system that maximizes parallel application efficiency in real-time. To that end, the runtime system prototype contains a performance monitoring component that feeds performance data in real-time to the runtime scheduler. This monitoring component differs from other tools in that it has not been thought as a stand-alone tool per se, but as an easily integrable component within other software. It pro-vides information in real-time about several performance metrics using a C API without requiring any complex configuration. We have demonstrated how this on-line information is useful in situations where the performance data is utilized to make scheduling decisions in real-time, not only with runtime systems but with self-conscious applications too. In addition, having access to the performance data immediately as it is generated, allow tools to analyze it in-situ, eliminating the necessity of storing the whole data set for its later analysis.
The current runtime prototype uses raw application performance data to make decisions about resource scheduling, for instance, time in MPI, floating point oper-ations per second, cache misses, etc. In the future, we want to investigate the use of expert systems that can provide more complex information than just raw metrics to the schedule manager. Real-time data analysis as done by tools such as Paradyn or Autopilot could be used to detect performance problems that can be commu-nicated during execution time to the runtime and to the application developer. Moreover, we also want to investigate the use of historical performance data to improve resource scheduling, e.g., maintaining a repository with performance data from previous runs together with specifications about the hardware used. Thereby, the runtime could use this historical information to improve its choice of resources for a certain problem in a certain platform.
As previously stated, there are many situations in which performance data has to be kept for its future use either by expert systems or human analysts.
30 CHAPTER 5. CONCLUSIONS AND FUTURE WORK
fore, we have been also working in compression techniques for tracing data. In this regard, we have shown that event flow graphs can be used as compressed represen-tations of MPI communication traces. Event flow graphs keep the temporal order of application events with very low overhead in terms of time and space, and can be utilized to reconstruct the full sequence of actions performed by an application ordered in time. By using the graph structure, the amount of performance data stored is much reduced as most of the structural data (like e.g. sender/receiver information) is encoded in the graph and is not repeated in every event, which is typically done in other tracers.
The use of event flow graphs for MPI monitoring opens up many possibilities. First, the utilization of automatic graph analysis techniques for application struc-ture detection. Graphs can be used to detect the loop nesting strucstruc-ture of an application without the need of any source code analysis. Knowing the structure of an application is really important as it allows, among other things, to reduce the amount of data collected. For example, the performance monitoring system can change the granularity of the data across application phases, that is, fine-grained data can be collected in relevant regions of the application whereas coarse-grained data can be captured for less important parts. Moreover, by knowing the program structure of a process we can compare and cluster processes with similar behavior. Thereby, reducing the amount of data that needs to be collected as data from simi-lar processes can be redundant, and therefore, discarded. In addition, knowing the similarities and differences in the execution flow among processes gives us a deeper understanding of the behavior of the whole application.
Our current implementation of event flow graphs for MPI monitoring does not allow the reconstruction of traces that include any continuos data such as times-tamps. Therefore, our actual reconstructed traces are useful for application debug-ging and performance evaluation through aggregated metrics, but they cannot be used to detect fine-grained problems across processes such as late sender. We are currently exploring methods to keep to some extend fine-grained time information in traces without storing fine-grained data. We hope that such techniques could be used as well for the reconstruction event traces containing any sort of continuos data, for example, hardware performance counters.
Another additional aspect that we want to explore is the use of event flow graphs for visual performance analysis of MPI applications. For example, we want to apply visual techniques such as graph coloring together with algorithms for graph cycle detection to our event flow graphs. Thereby, using our graphs not only as compressed traces but as enhanced graphical profiles that can help the human analyst in the task of performance examination.
In summary, our future work will focus on the study of event flow graphs for scalable performance data collection and analysis. First, using graphs to automati-cally gain knowledge of application structure in order to reduce trace size. Second, using graphs together with statistical methods to achieve lossless compression of time-stamped sequences of events. Finally, we will also explore the use of expert systems in conjunction with graphs for the automatic detection of performance
31
problems, or for the extraction of knowledge that could be used by the runtime system developed within this thesis work.
Bibliography
[1] Dalton, a molecular electronic structure program, Release DALTON2011, 2011.
http://daltonprogram.org/.
[2] Laksono Adhianto, Sinchan Banerjee, Mike Fagan, Mark Krentel, Gabriel Marin, John Mellor-Crummey, and Nathan R Tallent. Hpctoolkit: Tools for performance analysis of optimized parallel programs. Concurrency and
Com-putation: Practice and Experience, 22(6):685–701, 2010.
[3] Laksono Adhianto, John Mellor-Crummey, and Nathan R Tallent. Effectively presenting call path profiles of application performance. In Parallel Processing
Workshops (ICPPW), 2010 39th International Conference on, pages 179–188.
IEEE, 2010.
[4] Gene M Amdahl. Validity of the single processor approach to achieving large scale computing capabilities. In Proceedings of the April 18-20, 1967, spring
joint computer conference, pages 483–485. ACM, 1967.
[5] Amir Bahmani and Frank Mueller. Scalable performance analysis of exascale mpi programs through signature-based clustering algorithms. In Proceedings
of the 28th ACM international conference on Supercomputing, pages 155–164.
ACM, 2014.
[6] Richard F Barrett, Courtenay T Vaughan, and Michael A Heroux. Minighost: a miniapp for exploring boundary exchange strategies using stencil computa-tions in scientific parallel computing. Sandia National Laboratories, Tech. Rep.
SAND, 5294832, 2011.
[7] Robert Bell, Allen D Malony, and Sameer Shende. Paraprof: A portable, extensible, and scalable tool for parallel performance profile analysis. In
Euro-Par 2003 Euro-Parallel Processing, pages 17–26. Springer, 2003.
[8] Shajulin Benedict, Ventsislav Petkov, and Michael Gerndt. Periscope: An online-based distributed performance analysis tool. In Tools for High
Perfor-mance Computing 2009, pages 1–16. Springer, 2010.
34 BIBLIOGRAPHY
[9] David Bohme, Markus Geimer, Felix Wolf, and Lukas Arnold. Identifying the root causes of wait states in large-scale parallel applications. In Parallel
Pro-cessing (ICPP), 2010 39th International Conference on, pages 90–100. IEEE,
2010.
[10] Bryan Buck and Jeffrey K Hollingsworth. An api for runtime code patching.
International Journal of High Performance Computing Applications, 14(4):
317–329, 2000.
[11] Luiz DeRose, Bill Homer, Dean Johnson, Steve Kaufmann, and Heidi Poxon. Cray performance analysis tools. In Tools for High Performance Computing, pages 191–199. Springer, 2008.
[12] Jack J Dongarra, James R Bunch, Cleve B Moler, and Gilbert W Stewart.
LINPACK users’ guide, volume 8. Siam, 1979.
[13] Dominic Eschweiler, Michael Wagner, Markus Geimer, Andreas Knüpfer, Wolf-gang E Nagel, and Felix Wolf. Open trace format 2: The next generation of scalable trace formats and support libraries. In PARCO, volume 22, pages 481–490, 2011.
[14] Antonio Espinosa, Tomas Margalef, and Emilio Luque. Automatic performance evaluation of parallel programs. In Parallel and Distributed Processing, 1998.
PDP’98. Proceedings of the Sixth Euromicro Workshop on, pages 43–49. IEEE,
1998.
[15] Thomas Fahringer, Michael Gerndt, Graham Riley, and Jesper Larsson Träff.
Knowledge specification for automatic performance analysis: APART technical report. Citeseer, 2001.
[16] Thomas Fahringer and Clóvis Seragiotto Júnior. Modeling and detecting per-formance problems for distributed and parallel programs with javapsl. In
Su-percomputing, ACM/IEEE 2001 Conference, pages 38–38. IEEE, 2001.
[17] Thomas Fahringer and Clovis Seragiotto Jr. Aksum: A performance analysis tool for parallel and distributed applications. In Performance analysis and grid
computing, pages 189–208. Springer, 2004.
[18] Karl Fuerlinger, Nicholas J Wright, and David Skinner. Effective performance measurement at petascale using ipm. In Parallel and Distributed Systems
(IC-PADS), 2010 IEEE 16th International Conference on, pages 373–380. IEEE,
2010.
[19] Markus Geimer, Björn Kuhlmann, Farzona Pulatova, Felix Wolf, and Brian JN Wylie. Scalable collation and presentation of call-path profile data with cube. In PARCO, pages 645–652, 2007.