Effect of
Electrodeposition
Method on Ni/SiC
Composite Coating
PAPER WITHIN Product Development and Material Engineering AUTHOR: Jing Gao
TUTOR:Caterina Zanella
Postadress: Besöksadress: Telefon:
Box 1026 Gjuterigatan 5 036-10 10 00 (vx) 551 11 Jönköping
programme of the Master of Science programme. The authors take full responsibility for opinions, conclusions and findings presented.
Examiner: Illia Belov
Supervisor: Caterina Zanella Scope: 30 credits
Abstract
The work attempts to find out the effects of current parameters on particle codeposition and microhardness of composite coatings. Also, it uses pulse reverse current in increasing nanoparticle content and microhardness.
Two different coating layers, Ni and Ni/SiC, were electroplated on brass substrate using four different electroplating parameters. However, a group of the parameters have failed to produce successful coating. After plating, the origin samples are cut into small pieces to test different characteristics.
The small samples from corner of the origin one were mounted and taken thickness measurements. The samples from center were taken to measure microhardness and content of nanoparticles. To find out reason of failed samples, a Pourbaix diagram was calculated afterward.
The average content of SiC nanoparticles of each sample doesn’t have much differences but the samples using pulse reverse current have a uniform distribution. A higher microhardness is achieved by pulse current.
Keywords
Contents
1
Introduction ... 1
1.1 BACKGROUND ... 1
1.2 PURPOSE AND RESEARCH QUESTIONS ... 1
1.3 DELIMITATIONS ... 2 1.4 OUTLINE ... 2
2
Theoretical background ... 3
2.1 PROTECTING COATINGS ... 3 2.2 ELECTRODEPOSITION ... 3 2.2.1 Pourbaix diagram ... 52.2.2 Direct current electroplating ... 6
2.2.3 Pulse electroplating ... 6
2.2.4 Reverse pulse electroplating ... 7
2.3 HARD CHROME PLATING ... 8
2.4 NICKEL AND NICKEL COMPOSITE COATING ... 9
2.4.1 Nickel electroplating ... 9
2.4.2 Nickel composite electroplating ... 10
a) Nanoparticle ... 10
b) Plating parameters ... 11
c) Properties of coating layer ... 13
3
Method and implementation ... 14
3.1 EXPERIMENTAL ... 14
3.2 MEASUREMENTS AND CALCULATION ... 17
3.2.1 Thickness measurements ... 17
3.2.2 Microhardness test... 18
3.2.3 SEM and EDS ... 20
3.2.4 Pourbaix diagram ... 21
4
Findings and analysis ... 22
4.1 POURBAIX DIAGRAM ... 22
4.2 THICKNESS ... 24
4.3 MICROHARDNESS ... 26
4.4 SEM AND EDS ... 27
4.4.1 Picture of SEM ... 27
4.4.2 Content of SiC tested by EDS ... 30
5.1 DISCUSSION OF METHOD ... 31 5.2 DISCUSSION OF FINDINGS ... 31 5.3 CONCLUSIONS ... 33 5.4 FUTURE WORK ... 33
6
Acknowledgements ... 34
7
References ... 35
8
Appendices ... 38
1 Introduction
1.1 Background
Wear and corrosion of materials are very common problems for the components. A huge amount of money is spent on to control them. For many years, protective coatings, especially chromium by electrodeposition, have been the most used way to prevent them.
The hard chromium plating shows an excellent performance in protecting components against wear and corrosion and it is widely used for decades. However, it is produced starting from CrVI and because of its negative impact to the environment and human beings, CrVI is gradually banned starting from 2017 in Europe. At the state of the art there is still not a widely acceptable alternative, and therefore it’s very necessary to find an alternative coating material to replace hard chromium. According to the result from numerous research groups, metal matrix composite coating are an excellent candidate. For wear resistant application, 4 metal matrixes are proposed: they are Ni-P and Ni-W-P matrix, trivalent chromium plating and Fe-P plating. However, the properties of these metal cannot be equal to hard chromium. They need to be modified by adding a second hard phase in order to improve the properties. Carbides nanoparticles are the most used ones.
1.2 Purpose and research questions
The main object of this project is to find suitable composite coating without hexavalent chromium which can still achieve the properties of hard chromium in term of hardness. My focus will be on comparison of properties of pure Ni coating and Ni coating by adding nano-particles, for example nano-SiC in this thesis, with hard chrome to replace it.
There will be some problems about how to set suitable parameters, like current density, and preparation of these nano-particles. Because the different combination of composite coating materials has different characteristic and the hardness need to be increased. Nano-particles are the most important fact in achieving the object. However, to prepare nanoparticles will face many problems like how to make them stable in the deposition bath and how to avoid agglomeration and so on.
Research questions
1. Is the long pulse reverse current effective in increasing particles content and hardness of coatings?
2. How are the current parameters affecting the particles codeposition and final hardness?
1.3 Delimitations
The thesis only covers only one kind of nanoparticles and one metal matrix. There are still several other particles and metal matrix in need to be tested. The parameters for plating also can be more modified. At the same time, the wear resistance test is carried in the future and only microhardness values are taken into account as reference property.
1.4 Outline
This thesis begins with basic theoretical knowledge in chapter 2. Then how to carry out the experiment, such as experimental procedures, parameters, would be described in chapter 3. Following this, the results and analysis will be shown. Discussion of conclusions and future work would be put in the last chapter
2 Theoretical background
2.1 Protecting coatings
Wear and corrosion are the two main reasons of material loss in developed countries 23. Protecting coatings are considered as an effective way to prevent this problem. Protecting coatings can be produced by a wide range of different processes, for example, electrodeposition, electroless plating and thermal spray. These processes have their own profits and defects. In this project, electrodeposition is the only considered methods.
2.2 Electrodeposition
Electrodeposition is a successful process to produce a layer of metallic or alloyed coating onto a substrate by using electrochemical reduction and the metal ions from an electrolyte 47. It also requires an external current supplier (PC or DC) with two
electrodes or potential between the anode and substrate to coat. The whole process is carried out with the entire surface or object immersed in the electrolyte 36. The electrolyte is a conductive bath which contains the needed metal ions dissolved into a suitable solvent or molten salt 47.The cathode is always the substrate material which is going to be plated. The anode is the metal or alloy that will be plated on the substrate or some materials which is conductive but don’t dissolve in the electrolyte, such as platinum and graphite electrode.
Electrodeposition is widely used in industries for over 150 years. The layer it produced is thin but can provide better corrosion resistance, wear resistance, surface hardness and some other characteristics of the surface. It has been a major process for its cost efficiency and universality 23. Typical examples for industry include hard chrome, gold plating and nickel plating. Different metals or alloys are used in different circumstances and different substrates 36. For example, steel is the substrate that is mostly used metal in industrial. It can be plated with many different materials to make it adapt in different occasions. Nickel coatings and chrome coatings can increase hardness, corrosion resistance and wear resistance. Silver coatings can provide the surface a better appearance and the component can have a better electrical conductivity 34.
The solvent of electrolyte mainly has two kinds. One is aqueous solution and the other is organic solvent. However, because the application of aqueous solution is limited, there are more circumstance that the organic solvents or molten salts are used. Due to a limited number of materials that can be plated in aqueous solution, organic solvents or molten salts should be used to plate in more metals and alloys 23.
Pretreatment is a necessary step before electrodeposition. It highly depends on the material of the substrate. Typically, there are two steps of it. One is removing residuals, for example, dirt, oil and oxides, the other is activation 36.
Even though the surface is uniform in macroscopic view, from the microstructure, the coating layer is not uniform. In microscopic view, the coating surface still has ups and downs. These ups and downs on the surface will increase the contact area between coating and corrosive condition. And it also causes difference of coating thickness which can lead to distinction of characteristics, for instance, corrosion resistance, wear resistance, abrasive resistance and others. To produce a uniform layer, some parameters can be changed.
Electroplating have excellent control of thickness. According the function, the thickness can be settled as a constant parameter. Other parameters can be defined based on it. After every plating cycle, before testing the specific thickness, it can be measured by the difference of weight by Faraday’s law.
m = 𝐼 · 𝑡 · 𝑀 𝑧 · 𝐹
In this function, m is the weight of coating layer. I is the current which can also be presented as I = i · A, which i is current density and A is the area of substrate. t is the plating time. M means the molecular weight. z presents the number of electrons and F is the Faraday’s constant and its value is 96487 𝐶 𝑚𝑜𝑙⁄ .
After getting the weight of coating layer, the thickness is obvious.
d = 𝑚
𝜌 · 𝐴
In this function, d is the thickness of coating layer, m is the weight of coating layer, ρ is the density of coating material and A is the area of substrate.
Usually, to make the calculation much easier and faster, the thickness calculation is always used in this form by combining these two functions.
d = 𝑖 · 𝑡 · 𝑀 𝜌 · 𝑧 · 𝐹
By using this function, the thickness of coating can be predicted before the plating process. And it is also possible to set the target thickness at the first and then decide the current density and plating time. There are generally three kinds of electroplating methods based on the type of current.
2.2.1 Pourbaix diagram
Pourbaix diagram is also named pH-E diagram. It is created by Marcel Pourbaix37. This diagram shows the relationship between the potential of oxidation-reduction reaction and pH. The diagram is based on calculation of electrochemical equilibrium to determine the reaction products. From the diagram, it is clear to see the kinds and phases of chemicals in the solution. It is also possible to see whether the products are stable or not with the pH in the solution. The Nernst equation will be used in this circumstance. It uses standard Gibbs Free Energies (𝛥𝐺0) and standard potential (𝐸0) to calculate the potential of the whole reaction. For a chemical reaction of the type:
a A + b B c C + d D The formula is E = 𝐸0+𝑅𝑇 𝑛𝐹𝑙𝑛𝐾𝑟𝑒𝑎𝑐𝑡𝑖𝑜𝑛 Where, 𝐾𝑟𝑒𝑎𝑐𝑡𝑖𝑜𝑛 = [𝐶] 𝑐· [𝐷]𝑑 [𝐴]𝑎 · [𝐵]𝑏
in the formula, R is the ideal gas constant (8.31441 J/mol K). T is the temperature (K). n is the number of electrons circulating in the reaction. F is Faraday's number (96487 C/mol). 𝐸0 = −∆𝐺𝑟𝑒𝑎𝑐𝑡𝑖𝑜𝑛 0 𝑛𝐹 Where, ∆𝐺𝑟𝑒𝑎𝑐𝑡𝑖𝑜𝑛0 = 𝑐∆𝐺𝐶0+ 𝑑∆𝐺𝐷0 − 𝑎∆𝐺𝐴0− 𝑏∆𝐺𝐵0 For the electrochemical reactions, the reaction is
a A + ne− c C + d D The Nernst formula is changed to
E = 𝐸0+𝑅𝑇
The Pourbaix diagram is mainly used to study corrosion behavior in vary circumstance. In the graph, the regions can be defined as corrosion, passivation and alkaline corrosion areas. To electroplating, the Pourbaix diagram can help to decide the key parameters such as current density and pH. The essence of electroplating is transformation from oxidation state to reduction state. It’s essential to judge if the products can exist in electrolyte as a stable state. If the solid product cannot be stable in electrolyte, this type of electroplating is failed.
2.2.2 Direct current electroplating
Direct current plating is an electrodeposition technique which uses direct current to make the metal ions deposited onto the surface of substrate. This process is a basic and easy method to create the protective coating. The direct current is easy to produce and can be applied to a large amount of metals and alloys. However, the surface of the coating layer is not uniform and the edge effect cannot be avoided. This effect will make the coating material ions concentrate on the edge of the substrate which results in the thickness is not uniform.
In direct current electroplating, the parameters that can be controlled are current (I) and plating time (t). The current is also controlled by current density (i).
Fig2.2 Wave form of direct current plating 2.2.3 Pulse electroplating
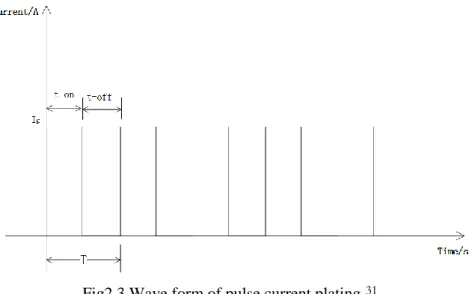
Pulse electroplating is an electroplating process using pulse current. Different from DC (direct current) plating, the pulse plating has an interval of on and off time because of the pulse current. The time duration that reaction proceeds as direct current is named on-time. The duration which stops all the electrochemical reactions is named off-time. During the on-time, the electroplating process is proceeding. The thickness of coating layer increases. During the off-time, the current is zero. The deposition process is stopped. With the effect of stirring, the concentration of ion near anode is decreased and dispersed equally in the electrolyte. Consequently, the coating layer can be more uniform.
Fig2.3 Wave form of pulse current plating31
In pulse electroplating, the duty cycle and current density can be controlled to modify the coating layer. A prolonged time of t-off is used to make metal ions well distributed in the electrolyte, since the stirrer has longer time to agitate the electrolyte. Sometimes, total time (T) is extended to achieve the same thickness of coating with reduced cycles in a fixed time duriation.
2.2.4 Reverse pulse electroplating
Reverse pulse electroplating is another type of pulse electroplating. The current altered between two values with the polarity changed. It has added a reverse pulse time, named anode time, after the cathode time. During the anode time, the current direction changes to the opposite of the cathode current. It changes the cathode and anode of on time. In the cathode time, it works the same as the pulse electroplating. During the anode time, the anode and cathode in cathode time are changed with each other. The reaction proceeds in a reverse direction. On one hand, reverse current can be used to decrease the concentration of ion near anode by depositing the ionized ions onto the anode again. On the other hand, it can dissolve surface part of the coating layer to make it uniform and decrease the porosity rate.
2.3 Hard Chrome Plating
Hard Chrome is a kind of electroplating which is widely used in industry. Normally, it uses hexavalent chromium electrolyte to produce the coating layer. The thickness of this layer will be 10-50 micron 34. It can increase the wear and corrosion resistance dramatically. The hardness will be increased to 850-1000 HV 8. It can be applied to a huge number of components, for example bearing components, hydraulic components, printing rollers and many other components. The hard chrome also has a large capacity to the diameter of applied components. In the plating, the CrVI is mostly used. The chemicals are easy to get and store in a stable condition. The cathode reactions are
𝐶𝑟2𝑂72−+ 6𝑒−+ 14𝐻+ = 2𝐶𝑟3++ 7𝐻2𝑂 2𝐻++ 2𝑒− = 𝐻2 ↑
𝐶𝑟2𝑂72−+ 6𝑒−+ 4𝐻+ = 𝐶𝑟 + 4𝑂𝐻− Anode reactions are
2𝐶𝑟3++ 6𝑒−+ 7𝐻2𝑂 = 𝐶𝑟2𝑂72−+ 14𝐻+ 2𝐻2𝑂 + 4𝑒− = 𝑂2 ↑ +4𝐻+
The most advantage of hard chrome is that the process can be operated in a low temperature. The operating temperature is around 50-60℃.Also the coefficient of friction is very low. The coefficient against steel of 0.16 lubricated 25. This also makes it suited as bearing and seal surfaces. After finishing process, it can be superfinished to mirror finishes.
Though the hard chrome has a lot of advantages in industrial applications, it still has some limits. For example, it has very low current efficiency, poor wetting properties, low material distribution and pollution of CrVI 34. The pollution is the most serious defect of all kinds of chromium coating. Hexavalent chromium is already known as a toxic chemical substance. A long time exposure will lead to cancer and other diseases. There are a lot of regulations in different aspects to control the pollution. To deal with different kinds of that, EPA and other agencies have published strict standards to control air and water emission and waste, such as, lead anodes and chromium plating bath 10,12,11,14.
The trivalent chrome is a new green material for plating and it has eliminated the harm to health and environment which is with hexavalent chrome 45. Even though the trivalent chrome is still a quite new material compared to hexavalent chrome, Y.B Song and D.-T Chin have already studied the current efficiency and reaction mechanism of it 46.
2.4 Nickel and Nickel Composite Coating 2.4.1 Nickel electroplating
Nickel plating is a widely used industrial application. The coating layer can be plated onto vary substrates and has a nice mirror-like surface finish, different hardness and good corrosion resistance 35. Nickel plating can give the coated parts better wear resistance and higher hardness, which can be up to 500HV. This can be achieved by different thicknesses of the coating layer 28.
The anodic reaction is:
Ni(s) → Ni 2++ 2e−
The cathodic reactions are:
Ni 2++ 2e−→ Ni(s)
2H+ + 2e−− → H 2(g)
The bath has three typical recipes: Watts, Nickel sulfamate and semibright bath. The Watts bath can give the coating a brighter appearance than sulfamate bath, which is more suitable for anti-corrosion application and higher thicknesses. In wear resistance and some circumstance which the appearance is not important, the sulfamate bath and semibright bath are more suitable 4,20. The classification and composition of the three recipes are shown in the table below.
Table 2.1 Table of electrolyte
Nickel plating is commonly used with other layers, for example bright chromium used it as a thin support coating. It also can be used in other decorative applications and automotive industry, such as bumpers and rims 44.
However, nickel plating can cause allergic reaction when it contacts with the skin. And another limitation of nickel plating is the environmental aspect. Since the nickel salts are cancerogenic and may cause genetic defects.
Composition Watts nickel Nickel sulfamate Typical semibright bath Nickel sulfate (NiSO4•6H2O) 225 - 400 g/L - 300 g/L Nickel sulfamate (Ni(SO3NH2)2) - 300 - 450 g/L - Nickel chloride (NiCl2•6H2O) 30 - 60 g/L 0 - 30 g/L 35 g/L Boric acid (H3BO3) 30 - 45 g/L 30 - 45 g/L 45 g/L
2.4.2 Nickel composite electroplating
Composite coating is a special process to produce the coating layer with better characteristics. It’s also called co-deposition. As its name, this process is able to create a coating layer which contains both the metal or alloy layer and enhance phase, like ceramic particles. They can be deposited at the same time. Nickel composite electroplating is a composite electroplating to add nanoparticles into the nickel matrix. To have better characteristics than nickel plating, the composite coating is considered an effective way to enhance the characteristic of ordinary coating layer. J.P. Celis, J.R. Roos, and C. Buelens have proposed a model which described the mechanism of codeposition of a particle and summarized into five stages 19. The particles are carried to the cathode by agitation of bath and embedded by reduction of adsorbed ions which is the same with D. Erglu and A.C. West’s research on Ni/SiC 7.
a) Nanoparticle
The nanoparticles are a series of particle whose size is between 1-100 nm. Generally, in composite electroplating, the nanoparticles are ceramic particles in different shapes. The ceramic particles always have good performance in hardness, wear resistance and corrosion resistance 43. They can help to enhance these characteristics and reduce the porosity rate.
The biggest differences between the coatings of same metal matrix mainly depend on the particles. Typically, the mostly used particles are SiC, Al2O3, TiO2, CNTs and others. For different purposes, different particles can be selected. To create a coating with high wear resistance, the particle can be SiC and Al2O3 or some other ceramic particles. To create a coating which has a better self-lubricating, the particle, such as lead and MoS2, can be used. The particles like them are already a lubricant which is widely used in industry. The codeposition process can make the solid lubricant particles deposited into the coating layer to increase the lubrication property.
S.T. Aruna, C.N. Bindu and others have tried Ni/CeO2 nano-composite coating 40. The microhardness and corrosion resistance are higher. O.R. Monteiro, S. Murugesan and V. Khabashesku have tried to co-deposit nano-diamond in Ni-B metal matrix 30. The hardness is improved which is similar to other particles. Kung-Hsu Hou, Han-Tao Wang and others have also tried nano-diamond but in Ni-W metal matrix 21. Their finding showed a similarity to O.R. Monteiro’s but the wear resistance is also increased.
Even the same particle, the roughness of particle will also affect the ability of codeposition. In the article of Sheng-Chang Wang and Wen-Cheng J. Wei 42, they have studied the nano-sized Al2O3, ZrO3 and ultra-fine SiC performance in the coating and co-relationship with additive. The concentration of embedded particles can be increased by higher current density or pH in the suspension. Compared to coarse SiC particles, the ultra-fine SiC particles are harder to co-deposit.
Compared to co-deposit one type of particle, some researchers have tried more than one kind of particles. In S.T. Aruna, V.K. William and K.S. Rajam’s article 41, the coating of Ni-AZY (ZrO2 and Al2O3) can dramatically increase the microhardness to 600 HK and the corrosion. Besides, wear resistance are increased compared to plain Ni coating.
b) Plating parameters
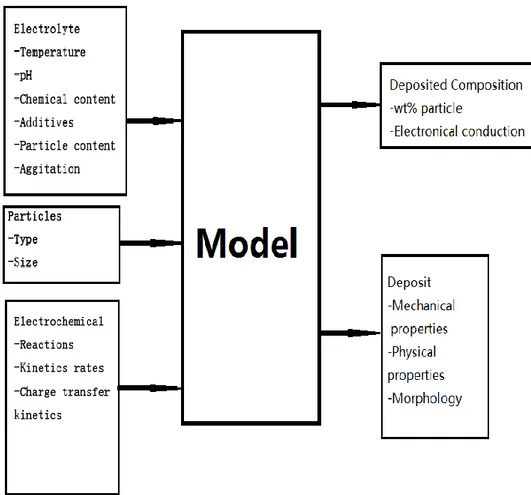
There are also some other parameters affect the characteristic of the coating. In F.C. Walsh and C. Ponce de Leon’s review 13, they have showed the factors can influence the characteristic of the composite coating.
In the results of different researches, they have shown the relation between concentration of particles and percentage volume of particles in deposit. The higher concentration of nanoparticles in electrolyte will increase the volume fraction in the coating layer and a saturation state of particles in the deposit can be achieved in a high concentration electrolyte 6. A. Hovestad and L.J.J. Janssen have reviewed different articles in experiment parameters and different models. They proposed that particle concentration, current density and bath agitation could be essential to composite electroplating, though it’s hard to conclude all the interrelationship between different parameters. 1. I. Shao and P.M. Vereecken have tried nano sized Al2O3 in codeposition. They have found that high electrode rotation rate, low current density and high particle concentration help to increase particle volume fraction which is similar to A. Hovestad’s finding 17. It’s generally agreed that the particles can improve the properties of the coating layer. The electrodeposition techniques also have some effects on it. In the research of C.T.J. Low and R.G.A. Wills 6, they have studied the coatings produced by many vary electrodeposition techniques. They have found that, in the nanocomposite coatings, the pulse current has a refined surface microstructure, higher incorporation rate and size selective entrapment. Moreover, the nanoparticles can increase the microhardness and corrosion resistance, modify crystal growth to form a nanocrystalline metal coating and reduce potential of a metal ion.
The size of particle can also affect the property of the coating layer. In some research, the smaller size of particle is, the more particles can be deposited into the layer. The point of smaller size of particles is also referred in the research of C.T.J. Low and R.G.A. Wills 6. They have found that current density, hydrodynamics and characteristics of particles can influence the incorporation rate. A high incorporation can be achieved by high nanoparticle concentration, small size of nanoparticles, low concentration of electroactive species, ultrasonication during the deposition and pulse reverse current technique. Similarly, C.F. Malfatti, J.Zoppas Ferreeira and others have a same result about small size of particles 5. In I. Shao and P.M. Vereecken’s research 17, they also referred that the small particles can lead a high hardness.
Current technique is also an essential aspect to modify the composite coating. In the research of P. Gyftou, E.A. Pavlatou and N. Spyrellis 32, comparing direct current and pulse current, the Ni/SiC coating using PC has higher incorporation and percentage of embedded particle and lower duty cycles than DC. Also, the microhardness is improved at low duty cycles and frequencies. In the article written by N. Spyrellis, E.A. Pavlatou and others 29, it also shows the pulse current can increase embedding nanoparticle percentage in the coating and the nanoparticle has a homogenous distribution in the coating. In the research on Ni-P/SiC, the researchers, A. Zoikis-Karathanasis, E.A. Pavlatou and N. Spyrellis 2, have found that the result was similar. The pulse electroplating can lead to a higher percentage of incorporated SiC nanoparticles, which can increase the hardness of coating layer. In other parameters, some researchers also have their opinions. S.A. Lajevardi and T. Shahrabi have studied the effect of duty cycle and pulse frequency in Ni/TiO2 co-deposition 39. They have found that a medium rate of pulse frequency and reduced duty cycle help to increase the particle incorporation.
c) Properties of coating layer
Different nanoparticles and different techniques can introduce and improve many other characteristics. Typically, some properties are always a common increase of the coating layer in different researches, for example the hardness, corrosion resistance and wear resistance are always increased properties which is referred in most of the articles 18. Compared to other materials, the composite coating can also provide a good performance in high temperature 38. I. Garcia, J. Fransaer and J.-P. Celis have researched the aspects can affect the wear resistance 16. They have found that a medium containing of particle helps to achieve a high wear resistance but a small size of particles can improve it. And Li Chen, Liping Wang and others have studied the surfactant in the coating of Ni/Al2O324.A high surfactant HPB can also help to promote the co-deposition of Al2O3 to achieve a uniform distribution and increase wear resistance.
Sometimes, the composite coating also brings some other benefits with the increased hardness and wear resistance. Kung-Hsu Hou, Wen-Hwa Hwu and others 22 have studied the pulse and direct current plating in Ni-P/SiC composite coating. The result showed that the SiC content is increased and phosphorus content is decreased in pulse plating compared to the direct current plating. Furthermore, the pulse plated coating has a better tribological behavior.
3 Method and implementation
3.1 Experimental
In the Pei’s article 33, a new model is used to increase the content of nanoparticles. The electroplating parameters are set by the diameter of nanoparticle. After each cycle of electroplating in tc, a layer of coating, which is as thick as the diameter of nanoparticle, is dissolved to expose all the nanoparticle on the surface during ta. This kind of plating have used the attractive force between nanoparticles to increase the nanoparticles content. In Podlaha’s article 9, the model of increasing nanoparticle content is proposed. In pulse reverse plating, the reduced duty cycle can increase the content of nanoparticles. In this model, the cathodic charge Qc in every cycle is fixed while the anode charge Qa is varied to reduce the duty cycle. Both of these two articles have achieved an excellent result of content of nanoparticles. The content is up to 23%wt.
The main target of the experiments is to repeat their articles to achieve a high content of nanoparticle. The main experimental method follows the method that Pei’s article mentioned before about alumina nanoparticle 33. However, there are some small changes.
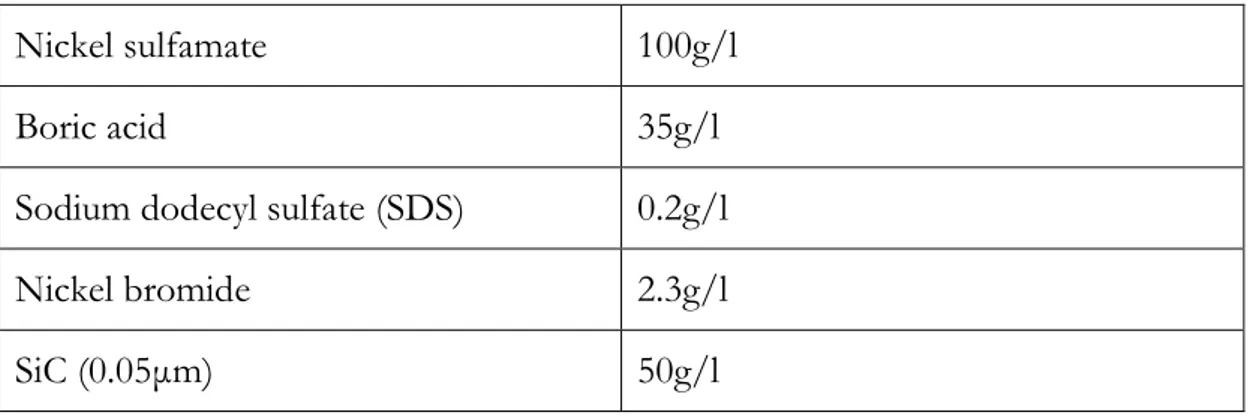
Due to the limitation of devises and substrate, magnet stirrer is used rather than a rotating cathode. The chemical composition of the electrolytes is in the table below. In the nanoparticle part, the Al2O3 is replaced by SiC. The plating temperature is controlled by water at 48±3℃ and the pH is adjusted to 4.0±0.1 at 25℃. A pure nickel plate is used as a dissolvable anode.
Table 3.1 Chemical composition of electrolyte
Nickel sulfamate 100g/l
Boric acid 35g/l
Sodium dodecyl sulfate (SDS) 0.2g/l
Nickel bromide 2.3g/l
The substrate of samples is copper which is produced by Yamamoto-MS, shown in fig. 3.1. The size of it is 10cm × 6.7cm. The plating area is controlled in 5cm × 5cm and the backside of surface is blocked by tape. The samples are divided in two general groups. One is pure Ni plating, which is set as a control group, and the other one is Ni/SiC plating. There are also 4 different process to do the electroplating in each group. In every process, three samples are plated at minimum, to enhance the results believable. Due to the working efficiency and the number of samples, the target is set as 20μm. The average current density is set as 10mA/cm2, which is the same to the article. The thickness is controlled at 20μm which is similar to the coating of hard chrome. Though the thickness of coating layer is 220μm in the article, the plating time is too long for the experiment work. To shorten plating time, the thickness is reduced. The working plan is shown in the table 3.2 below. Table 3.2 Working plan of samples (Ni and Ni/SiC)
In the working plan, n is repeat time of each cycle. It is rounded to the nearest whole number. DC means the current type is direct current. OO means pulse current. PR stands for pulse reverse and PP means these parameters are from the articles. The plating device includes a water circulating machine, pH tester and computer controlled power supply. As shown in fig. 3.2, the round container is the reacting plate. It has a hollow interlayer which allows water go through. Behind it, it’s the water circulating machine. It can heat the water and pump it in to the reacting plate.
Fig. 3.1 Substrate of sample
3.2 Measurements and Calculation
After the preparation of origin samples, the samples are cut into small pieces to test different characteristic. The microhardness, particle distribution and the thickness of coating layer need to be measured by hardness tester and Scanning Electron Microscope (SEM) machine. The data from these measurements need to be analyzed and the results are used to change the parameters in future test. To have a reliable result, the amount of samples with a same parameter will be three. The tester will measure different regions of the sample.
3.2.1 Thickness measurements
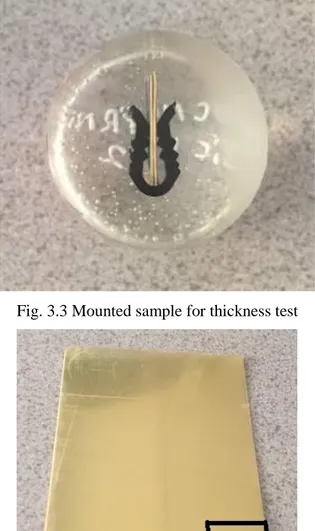
The thickness is measured by testing the crosssection of the sample with the Olympus GX71 and Stream motion. The samples are cut into 1.5cm × 1.5cm small pieces and mounted together by EpoFix Kit in fig. 3.3. The samples are taken from the edge part of the whole sample as shown in fig.3.4 and tested the edge near the center. The mounted samples are polished by Struers Tegramin-30 in fig. 3.5.
Fig. 3.3 Mounted sample for thickness test
Fig. 3.5 Polishing machine
Fig.3.6 Olympus GX71microscope 3.2.2 Microhardness test
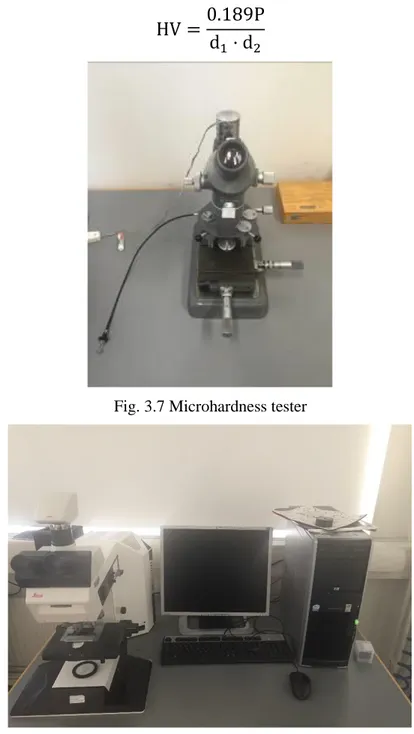
The microhardness test is carried out by Ernst Leitz microhardness tester and measured by Leica microscope as shown in fig. 3.7 and fig. 3.8. The test uses 20g, 50g, 200g, 300g and 500g load to make indentation. Then put the sample to the Leica microscope and use QWin V3 to measure the d1 and d2 of indentation under different loads. The picture seen in software is shown in fig.3.9
The samples are all from the center of the origin sample as shown in fig. 3.10. Two samples that produced by the same process will be tested. To every test cycle, each load has at least three indentation. The microhardness will take average of the calculated values. The distances of indentation of different loads are 30μm, 50μm, 80μm and 100μm. The distances of same loads are 30μm, 50μm, 80μm, 100μm and 150μm. The Vickers’s hardness will be calculated according the formula below.
HV = 0.189P d1· d2
Fig. 3.7 Microhardness tester
Fig. 3.9 Tested sample under microscope
Fig. 3.10 Place of small pieces in the origin sample
3.2.3 SEM and EDS
After microhardness test, the same small samples are taken to SEM machine. The picture of microstructure is taken by SEM in different areas at 20 kV. The pictures in one area are taken in different magnifications. The nanoparticle concentration in the coating layer is measured by EDS. EDS is a primary analysis of SEM. The tester can launch an electron beam hitting the specific area of the surface. By measuring the energy of X-ray that emitted by the molecular, it can identify the elements 15,27. The EDS analyses are taken while the magnification is 500 and analysis time is 30s at 5 random regions of the surface.
3.2.4 Pourbaix diagram
The calculation of Pourbaix diagram is basically based on the M.J. Munoz-Portero & et,al’s and B. Beverskog’s result 26,3. However, because of the difference of concentration of chemicals and temperature of experiments, the diagram is recalculated again. The aim of Pourbaix diagram in this experiment does not focus on the phases and products. It only concentrates on the corrosion and passivation regions to find out whether the reactions can be proceed or not.
4 Findings and analysis
4.1 Pourbaix diagram
The formula is used in this part, which is referred in chapter 2 and the needed data and reactions are shown in table 4.1 and 4.2. These reactions are based on the article 26.Even though there is Br- in the system, the concentration is too thin to effect the reactions. The whole system is treated as a Ni-H2O system.
Table 4.1 Standard Gibbs Free Enegies at 25℃
Species State ∆𝐺0(KJ/mol) Oxidation
Number of Ni H+ aq 0 H2 g 0 𝐻2𝑂 l -237.178 𝑂𝐻− aq -157.293 Ni s 0 0 𝑁𝑖2+ aq -46.3 2 𝑁𝑖𝐵𝑟2 aq -253.6 2 NiOOH(β) s -328.6 3 𝑁𝑖(𝑂𝐻)2 s -458.93 2 𝑁𝑖(𝑂𝐻)3− aq -586.5 2 𝑁𝑖(𝑂𝐻)42− aq -743.7 2 𝑁𝑖𝑂2(γ) s -139.5 4 𝑁𝑖𝐻0.5 s 5.9 0.5
Table 4.2 Reactions of plating Number Equation 1 𝑁𝑖2++ 0.5𝐻++ 2.5𝑒−↔ 𝑁𝑖𝐻 0.5 2 𝑁𝑖2++ 2𝑒∓↔ 𝑁𝑖 3 Ni + 0.5𝐻++ 0.5𝑒−↔ 𝑁𝑖𝐻 0.5 4 𝛽 − 𝑁𝑖(𝑂𝐻)2+ 2𝐻++ 2𝑒−↔ 𝑁𝑖 + 2𝐻2𝑂 5 𝑁𝑖(𝑂𝐻)3−+ 3𝐻++ 2𝑒−↔ 𝑁𝑖 + 3𝐻2𝑂 6 𝑁𝑖(𝑂𝐻)42−+ 4𝐻++ 2𝑒−↔ 𝑁𝑖 + 4𝐻2𝑂 7 𝑁𝑖𝑂2(γ) + 4𝐻++ 2𝑒−↔ 𝑁𝑖2++ 2𝐻2𝑂 8 NiOOH(β) + 3𝐻++ 𝑒−↔ 𝑁𝑖2++ 2𝐻 2𝑂 9 NiOOH(β) + 𝐻++ 𝑒−↔ 𝛽 − 𝑁𝑖(𝑂𝐻) 2 10 𝑁𝑖𝑂2(γ) + 𝐻++ 𝑒−↔ NiOOH(β) 11 NiOOH(β) + 𝐻2𝑂 + 𝑒−↔ 𝑁𝑖(𝑂𝐻)3− 12 𝑁𝑖𝑂2(γ) + 2𝐻2𝑂 + 2𝑒−↔ 𝑁𝑖(𝑂𝐻)42− 13 NiOOH(β) + 2𝐻2𝑂 + 𝑒−↔ 𝑁𝑖(𝑂𝐻)4−+ 𝐻+ 14 𝑁𝑖2++ 2𝐻 2𝑂 ↔ 𝛽 − 𝑁𝑖(𝑂𝐻)2+ 2𝐻+ 15 𝑁𝑖(𝑂𝐻)3−+ 𝐻+↔ 𝛽 − 𝑁𝑖(𝑂𝐻)2+ 𝐻2𝑂 16 𝑁𝑖(𝑂𝐻)4−+ 2𝐻+↔ 𝛽 − 𝑁𝑖(𝑂𝐻)2+ 2𝐻2𝑂 17 𝑁𝑖𝑂𝐻++ 𝐻+↔ 𝑁𝑖2++𝐻 2𝑂 18 𝑁𝑖(𝑂𝐻)3−+ 2𝐻+↔ 𝑁𝑖𝑂𝐻++ 2𝐻2𝑂 19 𝑁𝑖(𝑂𝐻)42−+ 𝐻+↔ 𝑁𝑖(𝑂𝐻)3−+𝐻2𝑂
The Pourbaix diagram is in fig. 4.1 below. Typically, Pourbaix diagram is used to find out the products of a reaction system. However, the products of reactions are not essential to this experiment. From the diagram, it’s clear to see the corrosion, passivation and immunity regions. The red line in the picture is the approximate reaction voltage. But at the plating pH, which is 4, the red line has a large part in passivation region. In this region, the surface shows an oxide layer after a long time plating and this layer will prevent plating a new coating after each plating cycle.
4.2 Thickness
The thickness values conclude two parts of the values. One is the theoritical value during the experiment in table 4.2. The other is measured value under the microscope through software in table 4.3. The error is an average error. The picture of measured samples are fig 4.2 and fig 4.3. The theoretical value is near the target value and edge effect is not considered. This value can also be treated as average value of the whole surface. The measured values only show a specific thickness at one point. Due to the location of the small samples in the origin samples, the thickness shows an unsmooth surface.
Table 4.2 Theoritical value of coating layer
Before/g After/g Δm/g Thickness/μm
DC-Ni-001 9.42 9.88 0.46 20.490 DC-Ni-002 9.36 9.80 0.44 19.599 DC-Ni-003 9.83 10.27 0.44 19.599 DC-Ni-004 9.82 10.23 0.41 18.263 DC-Ni-005 9.84 10.29 0.45 20.045 oo-Ni-001 9.64 10.10 0.46 20.490 oo-Ni-002 9.66 10.11 0.45 20.045 oo-Ni-003 9.81 10.28 0.47 20.935 PR-Ni-001 9.85 10.28 0.43 19.154 PR-Ni-002 9.77 10.20 0.43 19.154 PR-Ni-003 9.84 10.23 0.39 17.372 DC-Ni-SiC-001 9.834 10.299 0.465 20.713 DC-Ni-SiC-002 9.761 10.211 0.450 20.045 DC-Ni-SiC-003 9.831 10.289 0.458 20.401 oo-Ni-SiC-001 9.82 10.296 0.476 21.203 oo-Ni-SiC-002 9.777 10.204 0.427 19.020 oo-Ni-SiC-003 9.872 10.333 0.461 20.535 PR-Ni-SiC-001 9.725 10.168 0.443 19.733 PR-Ni-SiC-002 9.873 10.303 0.430 19.154 PR-Ni-SiC-003 9.78 10.206 0.426 18.976
Table 4.3 Measured value of coating layer
Fig. 4.2 Thickness picture of PR-Ni-1
Point1/μm Point2/μm Point3/μm Average/μm Error/μm
DCNi1 17.17 17.39 17.28 17.28 0.07 DCNI2 18.79 18.57 18.63 18.66 0.08 DCNi4 17.02 16.75 17.13 16.97 0.14 DCNiSiC1 15.82 16.04 15.66 15.84 0.13 DCNiSiC2 13.93 14.20 14.47 14.20 0.18 DCNiSiC3 16.14 16.2 16.79 16.38 0.28 OONi1 17.00 17.17 17.17 17.11 0.08 OONi2 17.11 17.28 16.95 17.11 0.11 OONi3 15.87 15.66 15.87 15.80 0.09 OONiSiC1 17.65 17.44 17.38 17.49 0.11 OONiSiC2 14.82 14.83 14.93 14.86 0.05 OONiSiC3 14.16 14.92 14.48 14.52 0.27 PRNi1 16.41 16.52 16.95 16.63 0.22 PRNi2 16.96 17.33 17.55 17.28 0.21 PRNi3 15.55 16.74 16.09 16.13 0.41 PRNiSiC1 18.19 18.03 18.19 18.14 0.07 PRNiSiC2 19.27 19.49 19.54 19.43 0.11 PRNiSiC3 17.44 17.38 17.49 17.44 0.04
Fig. 4.3 Thickness picture of PR-Ni-SiC-3
4.3 Microhardness
The table 4.4 has summarized the microhardness and errors of samples under different loads. From the origin measurement of indentation, d1 and d2 have shown a large value at 200g to 500g, which is longer than the thickness of coating layer. Meanwhile, in the calculation of microhardness, the value has an enormous decrease at 200g to 500g. Due to some values of indentation have already been close to the target of thickness at 50g, the microhardness value at 25g is the only reliable one. Because of these, the microhardness value of 50g, 200g, 300g and 500g are excluded. The final microhardness shows in fig. 4.4.
4.4 SEM and EDS 4.4.1 Picture of SEM
The pictures of SEM show a general appearance of the coating layer in micro scale. The surface of DC-Ni-SiC-2 is not very smooth from the fig. 4.5. In the picture (a) and (b), under different magnification, the roughness of coating can be seen vividly. The white edge can be treated as a concentrated part. In the picture (c), it is clear to see the separated and a small aggregation of SiC nanoparticle in the coating.
Fig.4.5 SEM picture of DC-Ni-SiC-2 at different magnification
The OO-Ni-SiC-2 shows a smooth surface in fig. 4.6. The nanoparticles shows on the surface as several small aggregation distributed in the surface in (a). When the magnification is higher in (b) and (c), some edges of SiC aggregation show a highlight appearance and some don’t. This aggregation part could have a steep edge compared to the less light one. Part of this aggregation is inside coating and other part is shown as a protuberant appearance on the surface.
Fig. 4.6 SEM picture of OO-Ni-SiC-2 at different magnification
Fig. 4.7 is the surface of PR-Ni-SiC-1. In (a), it shows a smooth appearance in general, though there are some aggregations on the surface. In pictures with higher magnification as (b) and (c), the coating surface shows a uniform distribution of nanoparticles in the region. Especially in (c), it shows a surface without large aggregations.
Fig. 4.7 SEM picture of PR-Ni-SiC-1 at different magnification
Generally, the surface in fig. 4.8 is uniform and some aggregation cannot be avoid under small magnification in (a). As the magnification is increased in (b) and (c), large aggregation has disappeared and single SiC nanoparticle has appeared in the picture.
Fig. 4.8 SEM picture of PR-Ni-SiC-2 at different magnification
4.4.2 Content of SiC tested by EDS
On every sample, all the five regions are selected randomly. The content values vary a lot in different regions. Due to the EDS can only measure the element, the content of SiC is a calculated value. In the origin data, the content of silicon is only from SiC while carbon can come from contamination. In fig. 4.9, the average content of SiC and average error of samples have summarized. The average content values of three plating types are almost the same. But it’s obvious that the PR samples have a smaller average error.
5 Discussion and conclusions
5.1 Discussion of method
The target thickness is a little thin compared to the article 33 which is 220μm. A thin coating layer may lead to some different results.
The nanoparticles are only stirred by ultrasonic while they were adding into the plating bath, which is not efficient enough to keep the particles separated during plating. The agitation is achieved by using magnetic stirrer during plating. Firstly, a sufficient rpm of stirrer has not had a generally agreed value yet. Because of that, the rpm cannot be set at a stable speed. Meanwhile, a magnetic stirrer cannot break the force between nanoparticles. It means that the nanoparticles can aggregate in the bath and cannot be split. It is obvious in the SEM pictures.
During the plating, the pH may vary because of consumption of H+ ions and raising temperature. Even though the bath has added boric acid as a buffer, it is still not convenient to track the change of pH during plating.
The plated samples are cut into small pieces to be mounted and measured. In this step, the coating layer may be ruined which may influence some properties of the coating. Because the center part is used to test the microhardness and EDS, the samples taking thickness measurement are corner parts of the origin sample. The thickness has a general regular pattern. Maybe the thickness of tested part cannot show the exact properties of tested part of microhardness and EDS. In the microhardness test, the tested spots are random selected but close to the center of the sample. It’s generally noticed that the center part is the thinnest part of coating. Different spots on different samples may influence the result of measurement.
5.2 Discussion of findings
The attempts of revising the articles 9,33 are failed. The surface using the parameters of Pei’s shows a terrible surface. Compared to other samples used DC, OO and PR with short pulse, the coating layer always shows a burnt appearance in the center of the sample and the adhesion is extremely bad. It can be easily removed from the substrate. First, this result of long pulse samples might be caused by a high current density and long-time duration. From table 3.2, it’s obviously to see that the time durations are increased from several milliseconds to several seconds. The long pulse may affect the performance of electroplating. Furthermore, after calculating the potential and making the Pourbaix diagram, the diagram in fig. 4.1 shows a huge passivation region, which influence the coating layer. The red line in the diagram shows the approximate plating potential. The pH of this line is 4 and the calculated nickel plating pH is 3.8. The plating pH can be reached in the experiment. However, this line have almost 2/3 part in the passivation region. In this region, in every plating round, the newly plated coating layer will be oxidized under long pulse. The oxidation of coating layer can prevent another plating layer plated onto it. To determine a specific new current parameter, the pulse should be considered in the future work.
The charge duty cycle of PR samples is 60% by using function, (|Qc|-|Qa|)/|Qc|. Due to the concentration of SiC nanoparticle in the electrolyte is twice higher than the article’s parameter. The theoretical nanoparticle should be around 12%. However, the actual values are only around 0.16% and 0.18%. A low duty cycle cannot increase content of nanoparticle. To make a more reliable result, more changes on Qa should be carried out in the future work. Though a lower time duty cycle cannot achieve a high content of nanoparticles, a higher microhardness is achieved by using pulse current. In future work, the time duration is a possible choice in pulse reverse current plating.
Through the thickness values, it can be found that the efficiency is around 70-90%, which is reasonable. The microhardness may have some relationship with the concentration of nanoparticles and thickness. But it’s hard to distinguish which one is more essential for now. Though a new parameter is used, the average concentrations are still quite low. The concentration of nanoparticles of all three plating techniques cannot reach a very high level but they are quite similar. However, the number of taking EDS samples is quite small. Four results of EDS cannot have a reliable conclusion.
In the SEM part, it can be clearly seen that the nanoparticles are inside the Ni coating. The coating using pulse reverse current always have a more uniform surface. And from the SEM picture of aggregation part in fig.5.1, it is clear to find that the aggregation have gathered number of nanoparticles. It will impede to make the distribution uniform. The nanoparticles already have an attractive force between which makes them easier to gather together. And also the experiments have used magnetic agitator to stir the bath. A magnetic agitator is enough for stirring electrons in the bath but it’s not strong enough to break the force between nanoparticles. And then the rpm of stirrer is not kept in an extremely same speed, especially in plating experiments with nanoparticles. In the experiments with nanoparticles, the most essential thing is to make the nanoparticles are well-distributed in the bath. However, due to ultrasonic device is not used during plating, the stirrer is hard to control the distribution in the bath. In the future work, the whole plating system can be placed in an ultrasonic environment which will help to reduce aggregated nanoparticles.
The content of SiC shows a similar average percentage in different samples. However, the samples produced by pulse reverse current have a higher base line and a lower average error. The lowest content is 0.14% in PR-Ni-SiC-1. Thus, the content of SiC nanoparticles has a more uniform distribution by using pulse reverse current. Besides, considering microhardness and thickness, PR samples also have a higher current efficiency and higher microhardness. In turn, samples produced by direct current and pulse current have a very high upper bound which is around 0.3% and a really low lower bound which is 0.08%. The average error is also larger than PR samples. Considering thickness and microhardness, even though the microhardness is very high, the thickness is apart from target thickness. The current efficiency is low. Since there are some regions showing a high content of SiC nanoparticles, it is possible to express a high microhardness in some region. In general, PR samples always have a better distribution of SiC content and microhardness.
5.3 Conclusions
After this study, the following conclusions can be made. The pulse reverse current with short pulse can increase hardness of coatings effectively. Furthermore, short pulse current can make the distribution of nanoparticle contents uniform. Comparing different current mode of plating, the current mode cannot affect the nanoparticles codeposition. Pulse current can increase the final hardness but don’t have a good distribution. Pulse reverse current can make distribution uniform but cannot increase the final hardness effectively. Besides, lower time duty cycle cannot achieve a high content of nanoparticles but a higher microhardness can be achieved.
5.4 Future work
Revise long pulses reverse-samples again with modified chemistry to avoid passivation.
Modify the parameters of pulse reverse plating:
A series of experiments with constant Qc and vary Qa should be carried out. Wear resistance testing should be carried out in the future.
6 Acknowledgements
I would like to thank Caterina Zanella for her giving me this and for her generous supervision and guidance throughout the work.
Thanks to Åsa Hansen for her help during the experiments and trainings she gave me in the lab.
Thanks to Baiwei Zhu and Dimosthenis Manitsas for teaching me use different devices and chemicals in the lab.
7 References
1 L.J.J. Janssen A. Hovestad, 'Electrochemical Codeposition of Inert Particles in a Metallic Matrix', Journal of Applied Electrochemistry, 25 (1995), 9.
2 E.A. Pavlatou A.Zoikis-Karathanasis, N. Spyrellis, 'Pulse Electrodeposition of Ni-P Matrix Composite Coatings Reinforced by Sic Particles', Journal of Alloys and Compounds, 494 (2010), 8.
3 I. Puigdomenech B. Beverskog, 'Revised Pourbaix Diagrams for Nickel at 25-300℃', Corrosion Science, 39 (1997), 12.
4 George A. Di Bari, Nickel Plating. Vol. 5, Asm Handbook (American Society For Metals, 1994), pp. 201-12.
5 J. Zoppas Ferreria C.F. Malfatti, C.B. Santos, B. V. Souza, E.P. Fallavena, S.Vailant, J.-P. Bonino, 'Nip/Sic Composite Coating: The Effects of Particles on the Electrochemical Behaviour', Corrosion Science, 47 (2005), 14.
6 R.G.A. Wills C.T.J. Low, F.C. Walsh, 'Electrodeposition of Composite Coatings Containing Nanoparticles in a Metal Deposit', Surface & Coatings Technoloogy, 201 (2006), 12.
7 A.C. West D. Erglu, 'Methematical Modeling of Ni/Sic Co-Deposition in the Presence of a Cationic Dispersant', Journal of The Electrochemical Society, 160 (2013), 6. 8 Inc. Dynamic Chromium Industries, 'Hard Chrome'2016)
<http://www.dynachrome.com/hard-chrome.html> [Accessed 9/16 2016].
9 D. Landolt E.J. Podlaha, 'Pulse-Reverse Plating of Nanocomposite Thin Films', Jornal of The Electrochemical Society, 144 (1997), 3.
10 EPA, 'Chromium Compounds'2016)
<http://www.epa.gov/ttn/atw/hlthef/chromium.html> [Accessed 9/16 2016]. 11 EPA, 'Guide to Cleaner Technologies: Alternative Metal Finishes'1994)
<http://nepis.epa.gov/> [Accessed 9/16 2016].
12 EPA, 'National Emission Standards for Hard and Decorative Chromium Electroplating and Chromium Anodizing Tanks'2016)
<https://www3.epa.gov/airtoxics/chrome/chromepg.html> [Accessed 9/16 2016]. 13 C. Ponce de Leon F.C. Walsh, 'A Review of the Electrodeposition of Metal Matrix
Composite Coatings by Inclusion of Particles in a Metal Layer: An Established and Diversifying Technology', TTransactions of the IMF, 92 (2014), 16.
14 A. Crawford Gerald, 'Nickel Exposures in the Plating Workplace and Environment'1996) < http://www.pfonline.com/articles/nickel-exposures-in-the-plating-workplace-and-environment> [Accessed 9/16 2016].
15 Bob Hafner, 'Energy Dispersive Spectroscopy on the Sem: A Primer ' <http://www.charfac.umn.edu/instruments/eds_on_sem_primer.pdf>.
16 J. Fransaer I. Garcia, J.-P. Celis, 'Electrodeposition and Sliding Wear Resistance of Nickel Composite Coatings Containing Micron and Submicron Sic Particles', Surface & Coatings Technoloogy, 148 (2001), 8.
17 P.M. Vereecken I. Shao, C.L. Chien, P.C. Searson, R.C. Cammarata, 'Synthesis and Characterization of Particle-Reinforced Ni/Al2o3 Nanocomposites', Materials
Chemistry and Physics, 17 (2002), 7.
18 B. Etheverry J.Alexis, J.D. Beguin, J.P. Bonino, 'Structure, Morphology and Mechanical Properties of Electrodeposition Composite Coating Ni-P/Sic', Materials Chemistry and Physics, 120 (2010), 6.
19 J.R. Roos J.P. Celis, and C.Buelens, 'A Mathematical Model for the Electrolytic Codeposition of Particles with a Metallic Matrix', Journal of Electrochemistry Society, 134 (1987).
20 Dr. Dmitri Kopeliovich, 'Nickel Electroplating'2013)
<http://www.substech.com/dokuwiki/doku.php?id=nickel_electroplating>.
21 Han-tao Wang Kung-Hsu Hou, Hung-Hua Sheu, Ming-Der Ger, 'Preparation and Wear Resistance of Electrodeposited Ni-W/ Diamond Composite Coatings', Applied Surface Science, 308 (2014), 7.
22 Wen-Hwa Hwu Kung-Hsu Hou, Shih-Tsung Ke, Ming-Der Ger, 'Ni-P-Sic Composite Produced by Pulse and Direct Current Plating', Materials Chemistry and Physics, 100 (2006), 5.
23 D. Landolt, 'Electrodeposition Science and Technology in the Last Quarter of the Twentieth Century', Jornal of The Electrochemical Society, 149 (2002), 12.
24 Liping Wang Li Chen, Zhixiang Zeng, Junyan Zhang, 'Effect of Surfactant on the Electrodeposition and Wear Resistance of Ni-Al2o3 Composite Coatings', Materials
Science & Engineering A, 434 (2006), 7.
25 Hardchrome Engineering Pty Ltd, 'Hardchrome Plating'2016)
<http://www.hardchrome.com.au/technologies/hardchrome-plating/> [Accessed 9/16 2016].
26 J. Garcia-Anton M.J. Munoz-Portero, J.L. Guinon, V. Perez-Herranz, 'Pourbaix Diagrams for Nikel in Concentrated Aqueous Lithium Bromide Solutions at 25℃', Corrosion Science, 63 (2007), 10.
27 Michael V. Martinez, 'A Basic Understanding of Scanning Electron Microscopy (Sem) and Energy Dispersive X-Ray Detection (Edx)'
<http://www.forensicevidence.net/iama/sem-edxtheory.html>.
28 D. S. L. Joseph Mazia, Electroplating Coatings. Vol. 13, Asm Handbook (American Society For Metals, 1987), pp. 419-31.
29 E.A. Pavlatou N. Spyrellis, S. Spanou, A. Zoikis-Karathanasis, 'Nickel and Nickel-Phosphorous Matrix Composite Electrocoatings', Transactions of Nonferrous Metals Society of China, 19 (2009), 4.
30 S. Murugesan O.R. Monteiro, V. Khabashesku, 'Electroplated Ni-B Films and Ni-B Metal Matrix Diamond Nanocomposite Coatings', Surface & Coatings Technoloogy, 272 (2015), 7.
31 Norman M. Osero, 'An Overview of Pulse Plating', Plating and surface finishing. 32 E.A. Pavlatou P. Gyftou, N. Spyrellis, 'Effect of Pulse Electrodeposition Parameters on
the Properties of Ni/Nano-Sic Composites', Applied Surface Science, 254 (2008), 6. 33 D. Engelhaupt Pei Xiong-Skiba, R. Hulguin, B. Ramsey, 'Effect of Pulse Plating
Parameters on the Composition of Alumina/Nickel Composite', Jornal of The Electrochemical Society, 152 (2005), 6.
34 Lars Pleth Nielsen Per Møller, 'Electrolytic Plating of Chromium', in Advanced Surface Technology (Møller & L. P. Nielsen, 2013), pp. 255-72.
35 Lars Pleth Nielsen Per Møller, 'Electrolytic Plating of Nickel', in Advanced Surface Technology (Møller & L. P. Nielsen, 2013), pp. 205-25.
36 Lars Pleth Nielsen Per Møller, 'Introduction to Chemical and Electrochemical Processes', in Advanced Surface Technology (Møller & L. P. Nielsen, 2013), pp. 105-47.
37 Marcel Pourbaix, Atlas of Electrochemical Equilibria in Aqueous Solutions (National Association of Corrosion Engiineers, 1974).
38 Prinston, 'Metal Matrix Composites'
<https://www.princeton.edu/~ota/disk2/1988/8801/880107.PDF> [Accessed 9/16 2016].
39 T. Shahrabi S.A. Lajevardi, 'Effects of Pulse Electrodeposition Parameters on the Properties of Ni-Tio2 Nanocomposite Coatings', JApplied Surface Science, 256 (2010),
6.
40 C.N. Bindu S.T. Aruna, V. Ezhil Selvi, V.K. William Grips, K.S. Rajam, 'Synthesis and Properties of Electrodeposited Ni/Ceria Nanocomposite Coatings', Surface & Coatings Technoloogy, 200 (2006), 10.
41 V.K. William Grips S.T. Aruna, K.S. Rajam, 'Ni-Based Electrodeposited Composite Coating Exhibiting Improved Microhardness, Corrosion and Wear Resistance Properties', Journal of Alloys and Compounds, 468 (2009), 6.
42 Wen-Cheng J. Wei Sheng-Chang Wang, 'Kinetics of Electroplating Process of Nano-Sized Ceramic Particle/Ni Composite', Materials Chemistry and Physics, 78 (2003), 7. 43 The American Ceramic Society, 'Structure and Properties of Ceramics'2014)
<http://ceramics.org/learn-about-ceramics/structure-and-properties-of-ceramics> [Accessed 9/16 2016].
44 Thermasnet, 'The Electro Nickel Plating Process'2016)
< http://www.thomasnet.com/articles/custom-manufacturing-fabricating/electro-plating-process> [Accessed 9/16 2016].
45 'Trivalent Chromium Technology', Master Finish Company,
(< http://www.masterfinishco.com/specialty-finishes-and-process/trivalent-chromium-technology/>.
46 D.-T Chin Y.B Song, 'Current Efficiency and Polarization Behavior of Trivalent Chromium Electrodeposition Process', Electrochimica Acta, 48 (2002).
47 G. Zangari Y.D. Gamburg, Theory and Practice of Metal Electrodeposition (Springer Science+Business Media, LLC, 2011).
8 Appendices
Appendice 1 Origin data and calculated SiC content
PRSiC1 1 2 3 4 5
Element Weight % Weight % Weight % Weight % Weight % Average % Error %
C K 4.08 3.46 4.1 4.85 7.32 O K 1.22 1.22 1.29 1.18 1.35 Si K 0.1 0.08 0.15 0.09 0.11 Ni K 94.6 95.24 94.46 93.89 91.22 SiC 0.14 0.11 0.21 0.13 0.16 Total 0.15 0.12 0.23 0.14 0.17 0.16 0.03 PRSiC2 1 2 3 4 5
Element Weight % Weight % Weight % Weight % Weight % Average % Error %
C K 3.38 3.53 3.92 4.21 3.72 O K 1.25 1.21 1.22 1.24 1.22 Si K 0.11 0.18 0.1 0.12 0.1 Ni K 95.26 95.08 94.75 94.44 94.96 SiC 0.16 0.26 0.14 0.17 0.14 Total 0.16 0.27 0.15 0.18 0.15 0.18 0.03 DCSiC1 1 2 3 4 5
Element Weight % Weight % Weight % Weight % Weight % Average % Error %
C K 4.41 4.9 5.03 4.53 5.34 O K 1.24 1.26 1.41 1.27 1.29 Si K 0.17 0.05 0.12 0.14 0.1 Ni K 94.19 93.79 93.44 94.07 93.26 SiC 0.24 0.07 0.17 0.20 0.14 Total 0.26 0.08 0.18 0.21 0.15 0.18 0.05 OOSiC2 1 2 3 4 5
Element Weight % Weight % Weight % Weight % Weight % Average % Error %
C K 4.23 3.77 3.87 4.6 3.5 O K 1.38 1.23 1.25 1.46 1.26 Si K 0.09 0.06 0.07 0.2 0.11 Ni K 94.29 94.94 94.8 93.74 95.14 SiC 0.13 0.09 0.10 0.29 0.16 Total 0.14 0.09 0.11 0.30 0.16 0.16 0.06