LINA ALDÉN & MATS HAMMARSTEDT
2015:14
Exits from immigrant
self-employment
1
Exits from immigrant self-employment: when, why and where to?
Lina Aldén
Centre for Labour Market and Discrimination Studies Linnaeus University
SE-351 95 Växjö Sweden lina.alden@lnu.se Mats Hammarstedt
Centre for Labour Market and Discrimination Studies Linnaeus University
SE-351 95 Växjö Sweden
mats.hammarstedt@lnu.se Abstract
This paper is a study of exit rates from self-employment among immigrants in Sweden. A survey was administered to all immigrants who became self-employed during the period 2001–2005 and to the members of a native comparison group. The respondents were then followed up to the year 2010. Immigrants were found to have a lower propensity than natives of exiting self-employment for wage-employment but a higher propensity than natives of exiting self-employment for unemployment or for economic inactivity. Oaxaca-Blinder decompositions are conducted to study the extent to which different background characteristics affect differences in exit rates between immigrants and natives. In line with previous research, we find that labour market and employment experience prior to self-employment as well as access to financial capital are important explanations for the difference between non-European immigrants and natives in exit rates from self-employment to unemployment and to being economically inactive.
This paper is part of the project “Intergenerational redistribution among immigrants – Does that explain self-employment and labour market differences?” financed by the Swedish Research Council for Health, Working Life and Welfare”. The Council’s support is gratefully acknowledged. Please direct all correspondence to Lina Aldén. lina.alden@lnu.se
2
1. Introduction
Immigrant self-employment has gained increasing interest among researchers in recent years. The self-employment rates among immigrants have been documented to be higher than those of natives in several OECD countries.1 Furthermore, besides the high rates of
self-employment, the exit rates from self-employment have been found to be higher among immigrants than among natives around the world.2
There are several reasons to expect differences in exit rates from self-employment between immigrants and natives. Firstly, access to financial capital is known to be of importance for self-employment opportunities and for self-employment survival.3 Previous research has
documented differences in access to financial capital between self-employed immigrants and self-employed natives and has concluded that self-employed immigrants are discriminated against when they apply to banks for financial capital.4 Secondly, self-employed immigrants
also run a higher risk than natives of being discriminated against by customers and suppliers.5
Thirdly, family traditions in self-employment and self-employment traditions from home-countries may also vary between immigrants and natives and between immigrant groups.6
In the US, Bates (1999) found that Asian immigrant business owners had higher exit rates from self-employment than white business owners and that this differential was explained by differences in educational attainment between the groups and also by in which branches the self-employed were active. Fairlie (1999) found that while wealth and family traditions were important determinants of self-employment entry among African-American business owners, differences in access to wealth and family traditions could only explain a small part of the self-employment exit rate between African-American and white business owners in the US. In a more recent study, Fairlie and Robb (2007) found that high exit rates among black business owners were explained by their lack of experience of having worked in a family business. Black business owners were much less likely than white owners to have had a self-employed family member prior to starting their business, and therefore they were less likely than white business owners to have worked in a family member’s business. In Sweden, Andersson-Joona (2010) found that the relatively high exit rates from self-employment among non-European immigrants were explained by the fact that these immigrants were to a greater extent than others pushed into self-employment due to lack of alternatives on the labour market.
The aim of this paper is to study exit rates from self-employment and their causes among immigrants in Sweden. Large differences in self-employment rates among immigrants in Sweden have been documented in previous research. High rates of self-employment have been found for certain groups from countries in the Middle East (e.g. Turkey, Lebanon and
1 For studies from the US, see Borjas (1986), Fairlie and Meyer (1996), Fairlie (1999), Hout and Rosen (2000),
Fairlie and Robb (2007) and Robb and Fairlie (2009). For a study from Australia, see Le (2000). For a study from the UK, see Clark and Drinkwater (2000). For a study from Germany, see Constant and Zimmermann (2006). For studies from Sweden, see Hammarstedt (2001, 2004, 2006).
2 For studies from the US, see Fairlie and Meyer (1996), Bates (1999), Fairlie (1999), Lofstrom and Wang
(2006) and Fairlie and Robb (2007). For a study from Sweden, see Andersson-Joona (2010).
3 See Evans and Jovanovic (1989), Blanchflower and Oswald (1996).
4 For studies from the US, see Cavalluzzo and Cavalluzzo (1998), Blanchflower et al. (2003), Blanchard et al.
(2008) and Asiedu et al. (2012). For a study from Sweden, see Alden and Hammarstedt (2015).
5 See Borjas and Bronars (1989).
6 Family traditions and intergenerational links in self-employment among immigrants have been studied by e.g.
Fairlie (1999), Hout and Rosen (2000), Andersson and Hammarstedt (2010, 2011a). The importance of self-employment traditions from the home-country have been studied by e.g. Yuengert (1995), Fairle and Meyer (1996) and Hammarstedt and Shukur (2009).
3 Syria) while much lower rates have been found among immigrants from the Nordic countries.7
Aldén and Hammarstedt (2015) have found that non-European immigrants in Sweden were facing different problems and obstacles in their self-employment activities from those facing natives and European immigrants. A disproportionally large share of the self-employed from non-European countries reported that they considered access to financial capital and discrimination from banks and customers as formidable problems in their self-employment activities.
Thus, we have reason to believe that there are differences in exit rates, and in the explanations behind these exit rates from self-employment, especially between non-European immigrants and natives. In order to explore this issue, we have administered a unique survey to self-employed immigrants and natives in Sweden. The survey was conducted during 2010 and all
immigrants from ten of Sweden’s largest immigration countries as well as a comparison group of natives who became self-employed during the period 2001–2005 were recruited.8
There were 7,927 immigrants and 3,000 members of the native control group. The respondents were followed until 2010 to study the extent to which they survived as self-employed. The individuals were asked questions about the possibilities and obstacles they have experienced in their self-employment activities, how they financed their firms and the different kinds of discrimination from customers and banks they might have encountered. The respondents were also asked about their previous experience with self-employment. The survey data was then combined with data from public registers. From these registers we have access to information about variables such as the respondents’ age, educational attainment, family situation, and in which branch of business they are active. We also have access to data on their employment history, whether they were wage-employed, unemployed or inactive before entering into self-employment.
Our empirical analysis will answer the following questions. To what extent are there differences in exit rates from self-employment between immigrants and natives? Among those who exit self-employment, are there differences between immigrants and natives in the extent to which they exit into wage-employment, unemployment and other states? To what extent can these differences be explained by differences in background factors such as demographics and human capital (e.g., age, gender, education), family self-employment traditions, wealth and access to financial capital, prior self-employment experience and labour market history, in which branches they are active, the extent to which they perceive that they have experienced discrimination from customers, and regional unemployment.
Our analyses proceed as follows. In Section 2 we present the survey, how it was conducted and some descriptive statistics. In Section 3 we present the empirical specification. Thereafter, in Section 4, we present an empirical analysis of differences in exit rates from self-employment and their determinants. In the final section, Section 5, we present conclusions and a discussion.
7 See e.g. Andersson and Hammarstedt (2011).
4
2. Data and descriptive statistics 2.1 Data
We used unique survey data combined with public register data from the LISA database at Statistics Sweden for the years 2000-2007.
The survey was conducted in cooperation with Statistics Sweden from August to October 2010. The survey was sent to all immigrants, aged 25 to 64 in 2005, born in one of the ten countries sending the most immigrants to Sweden, and who started a private firm between 2001 and 2005. The ten countries comprised Finland, Greece, Germany, Poland Iraq, Iran, Lebanon, Syria, Turkey, and Thailand. The survey was also sent to a comparable random sample of natives. Immigrants were defined as individuals born abroad to parents who were not born in Sweden. Natives, on the other hand, were defined as individuals born in Sweden whose mother and father were also born in Sweden.
The respondents were asked questions about their possibilities and obstacles while self-employed, how they financed their firms, and about any discrimination they had experienced from customers and banks. The respondents were also asked about previous experience with self-employment. The response rate of the survey was approximately 21 per cent among immigrants and 36 per cent among natives; 1,653 of the immigrants and 1,071 of the natives who were polled completed the survey.
We use this sample to compare and contrast differences in exit rates from self-employment between immigrants and natives. We thus focus on individuals who established a private firm in 2001-2005. We exclude those who started multiple firms. Among immigrants we focus on individuals born in Europe and in the Middle East. People born in Thailand are thus excluded. We also exclude farmers and individuals with missing information on the variables used in the analysis. This left a final sample of 729 natives and 868 immigrants.
From the LISA database we have information about the respondents’ employment status in 2000-2007. The individual enters the sample the year in which he or she becomes self-employed. The individual is then observed each year until he/she exits self-employment or until the study period ends. This means that we have right-censored data. Since we focus on firms that started a private firm in 2001-2005, we have information about the individual’s employment status one year before and for two to six years following the start-up.
An individual is defined as having started a business if the earnings from self-employment in year t comprise the main source of income; the individual is not defined as self-employed in year t-1. This definition allows the individual to have had income from wage-employment and/or unemployment during the start-up year. We use this definition to allow for that fact that individuals may start their business on a part-time basis and combine their self-employment activities with other types of income during the start-up year. In the following years we use a stricter definition of self-employed. In years t+i, where i = 1, …, 6, an individual is defined as employed if he or she has positive earnings from self-employment in that year and no income from wage-self-employment or unself-employment.
We then explore the extent to which an individual exits from self-employment. An individual is defined as having exited self-employment in year t+i if he or she is no longer defined as self-employed. In the data, we can observe to what state the individual exits. More
5 specifically, we can observe whether the individual exits to wage-employment, unemployment or other the labour market states. Other labour market states comprise being on parental leave, studying or being economically inactive.
The immigrant sample is divided into two groups based on region of origin: 1) European countries and 2) non-European countries.
From the LISA database we have access to information about demographic variables such as age, gender, marital status, and the presence of young children in the household. In addition, we have information about educational attainment, region of residence, year of immigration, net wealth, and business line.
From the survey we collect information about whether the individual has been previously self-employed in Sweden or in the home country. As regards immigrants, this information is typically not available to the researcher, as one seldom observes the individual’s lifetime job history prior to immigration in the data. The survey also provides us with information about whether the firm owner’s mother and/or father have been self-employed, and whether the individual has subjectively perceived discrimination from customers.
2.2 Background variables
Table 1 presents descriptive statistics for the background variables at the start-up year. The variables are presented for natives, European immigrants, and non-European immigrants. We have divided the variables into six categories: demographic characteristics, human capital
characteristics, family traditions, access to financial capital, labour market and self-employment experience, branches of business, perceived discrimination, and unself-employment.
Looking at demographic characteristics, we find that the individuals are on average about 40 years old. More males than females are included in the sample. Among non-European immigrants, more than 80 per cent are males; the corresponding numbers among natives and European immigrants are roughly between 60 and 70 per cent.9 Non-European immigrants are
more likely to be married than the other groups. More than 72 per cent of the non-European immigrants were married at the business start-up year.
The human capital characteristics reveal that non-European immigrants comprised a larger share of individuals with primary school education and a lower share of individuals with university education than the other groups. In terms of family traditions, about 40 per cent of the self-employed natives and non-European immigrants had a self-employed father. Among European immigrants the comparable share was about 30 per cent. The share with a self-employed mother was higher among European immigrants than among the other groups.
9 Self-employment is a male-dominated occupational status among immigrants and natives in Sweden, see i.e.
6 Table 1: Sample means for natives, European immigrants and non-European immigrants at business start-up year.
Natives Europe Non-European countries
Demographic characteristics
Years since migration – 24.35 13.60 Age 40.19 44.33 38.75 Female 0.328 0.446 0.186 Married 0.464 0.538 0.728 Children under age of 7 0.248 0.174 0.431
Human capital characteristics
Primary school 0.089 0.114 0.189 Secondary school 0.535 0.462 0.468 University education 0.376 0.424 0.342 Family traditions Self-employed father 0.406 0.304 0.407 Self-employed mother 0.165 0.206 0.105
Access to financial capital
Zero net wealth 0.004 0.041 0.126 Negative net wealth 0.329 0.415 0.584 Positive net wealth 0.667 0.544 0.290 Receipt of start-up subsidy 0.252 0.231 0.182
Labour market and self-employment experience
Entered self-employment from wage-employment 0.711 0.516 0.348 Entered self-employment from unemployment 0.148 0.202 0.281 Entered self-employment from other state 0.141 0.282 0.371 Experience from self-employment 0.523 0.544 0.551
Business line
Manufacturing/construction 0.193 0.171 0.027 Retail trade 0.154 0.161 0.438 Financial services 0.361 0.354 0.041 Personal and other services 0.119 0.108 0.281 Other or unspecified 0.173 0.206 0.213 Unspecified 0.114 0.139 0.193
Perceived discrimination
Subjectively perceived customer discrimination 0.096 0.108 0.355
Unemployment rate
Regional unemployment rate 4.753 4.413 4.359
N individuals 729 316 555
The characteristics that measure access to financial capital show that natives are more likely than immigrants have positive net wealth. About 67 per cent of the natives who started a business had a positive net wealth at the business start-up year. The corresponding figure among non-European immigrants was less than 30 per cent. Furthermore, about 25 per cent of the natives and European immigrants received a start-up subsidy while the corresponding figure among non-European immigrants was 18 per cent.10
10 Start-up subsidies can be given to individuals who are registered as unemployed in Sweden and who also fulfil
7 Looking at previous labour market and self-employment experience we find that more than 70 per cent of natives had been wage-employed prior to starting their business. Among non-European immigrants this share amounted to only 35 per cent. Among non-non-European immigrants who started a business more than 28 per cent had been previously unemployed. This share amounted to only about 15 per cent among natives. Furthermore, more than 37 per cent of the non-European immigrants who started a business entered self-employment from other labour market states. This implies that a large number of the non-European immigrants had been economically inactive before starting their business. Thus, in line with previous research, our results indicate that many non-European immigrants in Sweden are pushed towards self-employment by lack of alternatives on the labour market.11 Finally, about 50 per
cent of those who are included in our sample have had previously been self-employed. There are only slight differences between immigrants and natives in this respect.
However, there are large differences between immigrants and natives in the business line in which they become self-employed. Natives and European immigrants are often self-employed in the construction/manufacturing sector or in financial services, while non-European immigrants most often start businesses in the retail trade or service sector.
Finally, Table 1 reveals that non-European immigrants are more likely than natives and European immigrants to perceive customer discrimination. About 35 per cent of the non-European immigrants reported having had experienced discrimination from customers; only about 10 per cent of natives and among European immigrants reported this.12
2.2 Exit rates
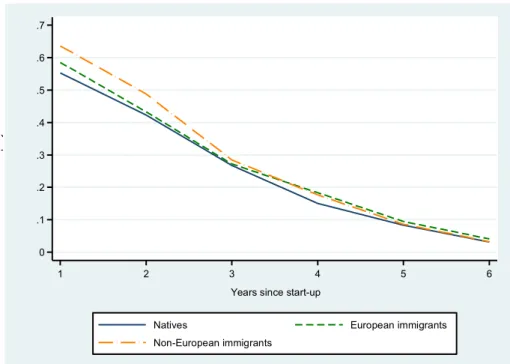
Figure 1 shows variations in the rate of self-employment among native, European immigrants, and non-European immigrants in relation to years since business start-up. At year 0 (note shown in the figure) all individuals are employed. Figure 1 indicates that the self-employment rate among natives is lower than that of non-European immigrants in the first three years after start-up. The difference in self-employment rate between natives and European immigrants at that time is less pronounced, suggesting that non-European immigrants have less of a tendency to exit self-employment than do natives and European immigrants. Five years after business start-up the self-employment rate is similar for all groups.
11 See Andersson-Joona (2010).
8 0 .1 .2 .3 .4 .5 .6 .7 py 1 2 3 4 5 6
Years since start-up
Natives European immigrants Non-European immigrants
Figure 1: Self-employment rate of the different groups by years since start-up
Table 2 shows the share of respondents that exits self-employment conditional on having survived for 1 (2, 3, 4+ years) year. More natives (about 45 per cent) than immigrants (42 per cent among European immigrants and 36 per cent among non-European immigrants) exit self-employment during the first year. After three years of self-self-employment, the highest exit rate is found among non-European immigrants.
Table 2: Share exiting self-employment after 1 year, 2 years, 3 years, and 4+ years, conditional on having survived up until that year
Natives European immigrants Non-European immigrants Share exiting after 1 year 0.447 0.415 0.363
Share exiting after 2 years 0.233 0.259 0.232 Share exiting after 3 years 0.184 0.149 0.255 Share exiting after 4+ years 0.181 0.129 0.200
N individuals 729 316 555
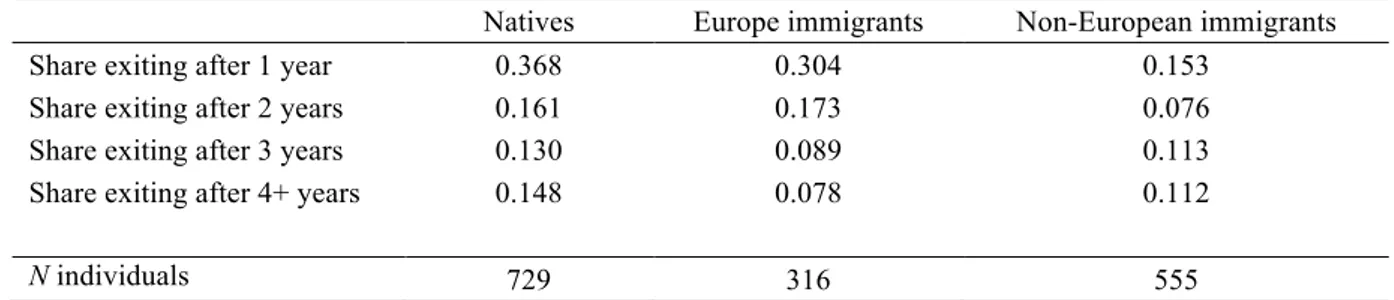
Tables 3–5 show the share exiting self-employment for different states. Starting with exit to wage-employment in Table 3 we find that natives exit self-employment for wage-employment more than immigrants do. After one year, about 37 per cent of the self-employed natives exit for wage-employment while only about 15 per cent of the non-European immigrants do. Among non-European immigrants, the share that exits for wage-employment remains fairly constant. After three years or more than three per cent exit self-employment for wage-employment among non-European immigrants. This share is lower than the corresponding share in the native population.
9 Table 3: Share exiting self-employment for wage-employment after 1 year, 2 years, 3 years, and 4+ years, conditional on having survived up until that year
Natives Europe immigrants Non-European immigrants Share exiting after 1 year 0.368 0.304 0.153
Share exiting after 2 years 0.161 0.173 0.076 Share exiting after 3 years 0.130 0.089 0.113 Share exiting after 4+ years 0.148 0.078 0.112
N individuals 729 316 555
The share of non-European immigrants that exits to unemployment or to other states is considerably higher than among natives (see Table 4 and Table 5). About 12 per cent of the non-European immigrants exit for unemployment after one year. The corresponding shares among natives and European immigrants are about 4 per cent. It is worth noting that the share that exits for unemployment after three years or more is very low among natives and European immigrants; among non-European immigrants around 8 per cent are exiting for unemployment after three years and about 4 per cent are exiting for unemployment after four years or more.
Table 4: Share exiting self-employment for unemployment after 1 year, 2 years, 3 years, and 4+ years, conditional on having survived up until that year
Natives Europe immigrants Non-European immigrants Share exiting after 1 year 0.041 0.044 0.119
Share exiting after 2 years 0.027 0.016 0.076 Share exiting after 3 years 0.004 0.010 0.085 Share exiting after 4+ years 0.004 0.009 0.039
N individuals 729 316 555
Almost ten per cent of the non-European immigrants are exiting from self-employment to the category other states after one year. The corresponding share among natives is less than 4 per cent. The share that exits to other states is somewhat higher among Non-European immigrants than among natives and European immigrants also after three years or more.
Table 5: Share exiting self-employment for other states after 1 year, 2 years, 3 years, and 4+ years, conditional on having survived up until that year
Natives Europe immigrants Non-European immigrants Share exiting after 1 year 0.038 0.066 0.092
Share exiting after 2 years 0.045 0.070 0.079 Share exiting after 3 years 0.050 0.050 0.057 Share exiting after 4+ years 0.030 0.043 0.049
N individuals 729 316 555
3. Empirical specification
To explore differences in exits from self-employment between immigrants and natives, we estimate a discrete time proportional hazard model. We estimate a single risk model to study the probability of exiting self-employment without distinguishing between exits to different states. We also estimate a competing risk model to explore the extent to which the
self-10 employment spell ends with wage-employment, unemployment or with other labour market states. Following Jenkins (1995), we estimate the discrete time proportional hazard model using a logit model. To account for duration dependence we add dummy variables indicating the length of the employment. As a result, we estimate the probability of exiting self-employment in a certain year, conditional on having survived up until that year.13
In the single-risk model, the dependent variable is the probability of exiting self-employment within the first two to six years. In the competing-risk model, the dependent variable is the probability of exiting self-employment for wage-employment, unemployment, and other states.
The main variables of interest are dummy variables indicating whether the firm owner is born in Europe or in a non-European country. Natives thus constitute the reference category. In the results tables we report the odds ratio. The odds ratio should be interpreted as differences in the odds of exiting self-employment between the different immigrant groups and natives. A value lower than 1 indicates that the odds of the immigrant group for exiting self-employment is lower than the odds of natives. In contrast, if the value is higher than 1, the immigrant groups have a higher odds of exiting self-employment than natives.
We include time-invariant controls for gender, educational attainment, net wealth, and whether or not the firm owner has been granted a start-up subsidy, and industry. We also control for the employment status the year before employment entry, previous self-employment experience, and for the parents’ self-self-employment experience. In addition, we include a control indicating whether the firm owner has subjectively perceived customer discrimination. Apart from time-invariant variables, we add several time-variant controls. More specifically, we control for age, marital status, having young children (<7), regional unemployment, region of residence, number of years in Sweden (for immigrants), and year of observation.14
We also estimate a non-linear Blinder-Oaxaca decomposition to elucidate how much of the native-immigrant gap in exits from self-employment that can be explained, together and separately, by group differences in the included covariates, such as differences in human capital and previous labour market experience. In this case we decompose the native-immigrant gap in exits from self-employment in the first year after the business start-up. The decomposition is made for non-European immigrants only. We perform a two-fold decomposition using the approach suggested by Neumark (1988).15 In the detailed
composition, we divide the variables into eight groups: 1) demographic characteristics, 2)
human capital characteristics, 3) family traditions, 4) access to financial capital, 5) labour market and self-employment experience, 6)_branches of business, 7) perceived discrimination, and 8) unemployment (see Table 1).
13 Logistic regression produces similar results as e.g. Cox proportional hazard models for short or fixed
follow-up periods. However, the results may differ if the individuals have varying follow-follow-up periods. We test the robustness of the results by estimating the discrete time proportional hazard model with a follow-up period of 3 and 4 years, instead of 6. In all essentials, the results remain the same.
14 See Table A1 in the Appendix for a description of how the variables are constructed.
15 Using this approach, we may inappropriately transfer some of the unexplained part of the native-immigrant
11
4. An empirical analysis of native-immigrant differentials in self-employment exit rates 4.1 Single risk and competing risk models
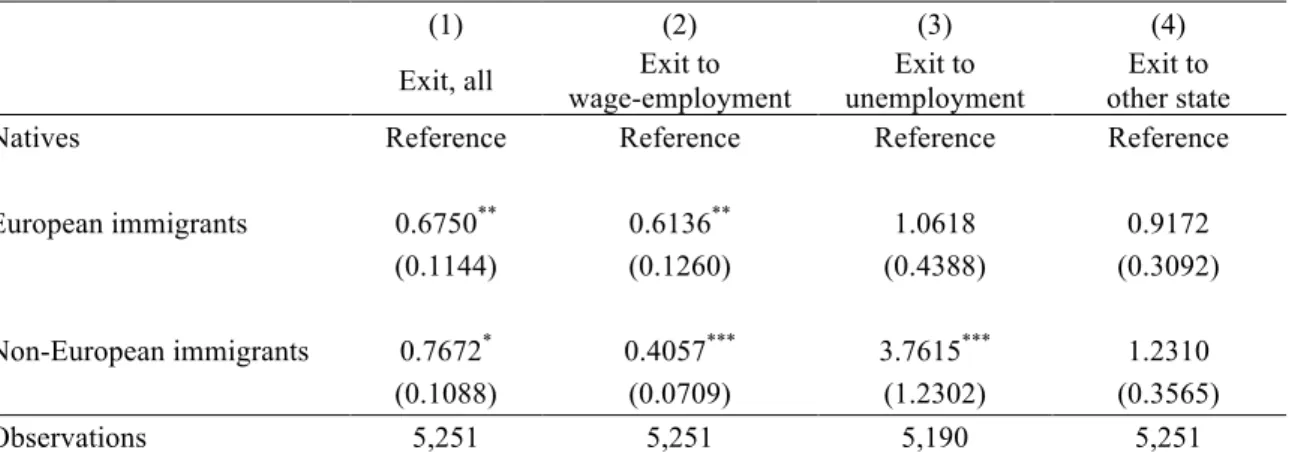
We begin by comparing the differences in exits from self-employment between natives and the immigrant groups. Table 6 presents the results from the discrete time proportional hazard model for natives, European immigrants, and non-European immigrants. The table shows results from both the single- and the competing-risk models.
Column (1) shows the estimated odds ratio for exiting self-employment, regardless of destination, between natives and the two immigrant groups. It emerges that both European and non-European immigrants have lower odds of exiting self-employment than do natives. For European immigrants the odds of exiting self-employment are about 0.68 times lower than the odds of natives. The corresponding figure for non-European immigrants amounts to about 0.78. However, the difference in odds ratio between the two immigrant groups is not statistically significant. Thus, the pattern we observed for the unconditional exit rates remains when we add a large set of covariates.
Next, we explore the extent to which natives and immigrants exit to various labour market states. Columns (2)-(4) show the results from the competing risk models. As indicated in the descriptive statistics, column (2) reveals that immigrants have a lower risk of exiting self-employment for self-employment. For European immigrants the odds of exiting for wage-employment are 0.61 times lower than the odds of natives. For non-European immigrants the odds ratio is even lower: 0.41. In this case the odds ratios of the two immigrant groups are statistically significantly different from each other. Immigrants from non-European countries are thus the least likely to exit self-employment for wage-employment.
Table 6: Single and competing discrete hazard estimates for natives and immigrants, odds ratio (standard errors in parentheses)
(1) (2) (3) (4) Exit, all wage-employment Exit to unemployment Exit to other state Exit to Natives Reference Reference Reference Reference European immigrants 0.6750** 0.6136** 1.0618 0.9172
(0.1144) (0.1260) (0.4388) (0.3092) Non-European immigrants 0.7672* 0.4057*** 3.7615*** 1.2310
(0.1088) (0.0709) (1.2302) (0.3565) Observations 5,251 5,251 5,190 5,251
Note: In the regressions we control for demographic characteristics (years since migration, age, gender, marital status, presence of young children), human capital (educational attainment), family traditions (self-employed father and/or self-employed mother), access to financial capital (net wealth, receipt of start-up subsidy), labour market and self-employment experience (employment status one year before business start-up, previous experience from self-employment), business line, subjectively perceived customer discrimination, regional unemployment rate, place of residence, self-employment duration, and year. We present odds ratios, i.e. exponentiated coefficients. * p < 0.10, ** p < 0.05, *** p < 0.01.
If we turn to the risk of exiting self-employment for unemployment in column (3) we observe a different pattern. For European immigrants the odds of exiting to unemployment are about the same as for natives, but the estimate is not statistically significant. In contrast, the odds of exiting self-employment for unemployment for non-European immigrants are about 3.8 times
12 larger than are the odds for natives. This difference is statistically significant. This pattern is also in line with what we observed in the descriptive statistics.
Finally, column (4) shows the risk of exiting self-employment for other states. In this case European immigrants appear to have slightly lower odds than natives while non-European immigrants have slightly higher odds. However, this difference is not statistically significant. To sum up, natives are less likely to exit self-employment than are either European or European immigrants. As regards destination after exit, immigrants, and especially non-European immigrants, are less likely to exit self-employment for wage-employment. Non-European immigrants are also more likely than the other groups to exit self-employment for unemployment.
Table 7: Single and competing discrete hazard estimates for natives and non-European immigrants, odds ratio (standard errors in parentheses)
(1) (2) (3) (4) Exit, all wage-employment Exit to unemployment Exit to other state Exit to Natives Reference Reference Reference Reference Iraq 0.7962 0.2819*** 4.7272*** 1.7158 (0.1626) (0.0796) (1.8667) (0.6776) Iran 0.7496 0.3704*** 3.1606*** 1.3856 (0.1690) (0.1146) (1.3760) (0.5936) Lebanon 0.7679 0.2807*** 3.2235** 2.5541** (0.1972) (0.1041) (1.5583) (1.2021) Syria 0.6743 0.2607*** 2.7922** 1.9192 (0.1764) (0.0968) (1.3663) (0.9241) Turkey 0.5273** 0.2250*** 2.7711** 1.2760 (0.1441) (0.0868) (1.3758) (0.6719) Observations 4,223 4,223 4,177 4,223
Note: In the regressions we control for demographic characteristics (years since migration, age, gender, marital status, presence of young children), human capital (educational attainment), family traditions (self-employed father and/or self-employed mother), access to financial capital (net wealth, receipt of start-up subsidy), labour market and self-employment experience (employment status one year before business start-up, previous experience from self-employment), business line, subjectively perceived customer discrimination, regional unemployment rate, place of residence, self-employment duration, and year. We present odds ratios, i.e. exponentiated coefficients. * p < 0.10, ** p < 0.05, *** p < 0.01
Non-European immigrants clearly stand out. Therefore, in Table 7 we explore whether there are differences in the risk of exiting self-employment among non-European immigrants (i.e., those born in Iraq, Iran, Lebanon, Syria, and Turkey).16 The table reveals a similar pattern for
all groups with some exceptions. First, although column (1) suggests that the odds of exiting self-employment is lower for all immigrant groups than for natives, the difference in odds is statistically significant only for immigrants born in Turkey. For this group the odds of exiting
16 For a study of self-employment among Middle Eastern immigrants in Sweden, see e.g. Andersson &
13 employment are 0.53 times lower than for natives. As regards exits from self-employment to wage-self-employment, we observe a similar pattern in all groups. The odds ratio ranges from about 0.23 for Turkish immigrants to about 0.37 for Iranian immigrants. Further, all groups are at a much higher risk than natives of exiting self-employment for unemployment. The difference in odds compared to natives is largest for immigrants born in Iraq. The odds of this group are nearly five times larger than the odds of natives. For the other groups the odds ratio hovers around 3. Finally, column (4) in Table 7 shows that the odds of exiting self-employment to other labour market states appear higher for all non-European immigrant groups than for natives. However, the difference in odds is statistically significant only for immigrants from Lebanon. For Lebanese immigrants, the odds of exiting for other labour market states is about 2.6 times higher than the odds of natives.
To sum up, there appear to be no large differences among non-European immigrants in the risk of exiting self-employment or of exiting to different labour market states. The only significant exception is found among immigrants born in Iraq. This group has a much higher risk than the other groups of exiting self-employment for unemployment.
4.2 Blinder-Oaxaca decomposition
As a final step in our analysis we explore the extent to which the native-immigrant gap in exits from self-employment can be attributed to group differences in the included covariates. This is done using Blinder-Oaxaca decomposition. Since the differences between natives and European immigrants in exits from self-employment but also in exits to different labour market states were generally negligible, we perform the decomposition for non-European immigrants only.
Table 8 presents the decomposition of the gap in exits between natives and non-European immigrants. The table shows the native-immigrant gap in exits to self-employment and in exits to various labour markets states. The table also shows how group differences in demographic characteristics, human capital, family traditions, access to financial capital, labour market and self-employment experience, business line, perceived discrimination, and in regional unemployment contribute to this gap. The last row in Table 8 shows how much of the gap in exits can be attributed to differences in all included covariates.
First we turn to the possible group differences that explain that natives have higher exit rates from self-employment than non-European immigrants. From column (1) in Table 8 we can see that the native-immigrant gap amounts to about 8 percentage points. Table 8 further shows that about 55 per cent of this gap is explained by group differences in the covariates.17 If we
turn to the detailed decomposition, we find that differences in demographic characteristics, human capital, business line, and regional unemployment contribute to explaining the gap in exits, since these differences tend to widen the gap between immigrants and natives. However, the contributions of human capital and unemployment rate are the only ones that are statistically significant. Out of these, the main contributor to the observed gap in exits between natives and non-European immigrants is differences in regional unemployment, explaining about 23 per cent of the gap. Table 1 shows that non-European immigrants tend to live in areas with less unemployment than do natives. Since higher levels of unemployment increases exits from self-employment, the group differences in regional unemployment
17 The percentage contribution from group differences in covariates is calculated by dividing the total or each
contribution by the native-immigrant gap. The percentage contribution from group differences in all included covariates is 0.0461/0.0832=0.5541.
14 contribute to the higher exit rate of natives.18 Differences in human capital explain about 10
per cent of the native-immigrant gap in exits. In this case, a higher level of educational attainment tends to increase exits from self-employment and natives have, on average, a higher educational attainment than do non-European immigrants. These group differences thus increase exits among natives relative to non-European immigrants.
Some group differences, such as family tradition, tend to narrow the gap. Natives with self-employed parents, and especially a self-self-employed mother, are more likely than non-European immigrants to exit from self-employment. Since exits from self-employment are lower among individuals with self-employed parents, this group difference decreases exits among natives relative to non-European immigrants.
Column (2) in Table 8 shows the group differences that contribute to the positive native-immigrant gap in exits to wage-employment. The joint contribution of differences in the included covariates to the observed gap is small, about 7 per cent. In this case, group differences in previous labour market experience are the most important determinant, explaining about 13 per cent of the gap. Entering self-employment from unemployment or inactivity decreases exits to wage-employment. Table 1 shows that non-Europeans enter self-employment from these labour market states to a larger extent than do natives, and this group difference thus decreases exits to wage-employment among non-European immigrants relative to natives. Differences in human capital also contribute to the gap in exits to wage-employment but to a lesser extent, explaining about 5 per cent of the gap. In this case, higher levels of educational attainment increase exits to wage-employment and non-European immigrants have lower levels of education than do natives.
As on the aggregate level, differences in family traditions work in the direction of decreasing the gap in exits to employment. Having self-employed parents decreases exits to wage-employment and natives tend to have self-employed parents to a larger extent than do non-European immigrants.
Column (3) presents possible contributions to the higher exit rate to unemployment among non-European immigrants. Here the main contributor the native-immigrant gap is differences in access to financial capital, explaining about 17 per cent of the gap. People who have access to positive net wealth and have been granted a start-up subsidy are less likely to exit to unemployment. The difference in exits to unemployment is thus partly explained because non-European immigrants are more likely to have positive net wealth and a start-up subsidy. Group differences in unemployment rate and family traditions, in contrast, tend to decrease the native-immigrant gap in exits to unemployment. Living in regions with more unemployment increases exits to unemployment; and non-European immigrants live in areas with a lower level of unemployment than do natives (e.g. metropolitan areas). Further, having self-employed parents actually increases exits to unemployment and natives are more likely than non-European immigrants to have self-employed parents.
18 The impact of the covariates comes from the pooled regression estimated to perform the decomposition. These
15 Table 8: Decomposition of exit from self-employment 1 year after business start-up for non-European immigrants
Exit, all wage-employment Exit to unemployment Exit to other state Exit to Native exit rate 0.4472 0.3676 0.0412 0.0384 Non-European exit rate 0.3640 0.1532 0.1189 0.0919 Native/immigrant gap 0.0832 0.2145 -0.0778 -0.0535 Contribution from differences in:
Demographic characteristics 0.0475 -0.0202 0.0413 0.0264 (0.0502) (0.0381) (0.0328) (0.0327) Human capital 0.0084* 0.0099** 0.0002 -0.0017 (0.0048) (0.0018) (0.0024) (0.0023) Family traditions -0.0048* -0.0056** 0.0029* -0.0021* (0.0015) (0.0028) (0.0017) (0.0013)
Access to financial capital -0.0120 0.0022 -0.0130* -0.0012
(0.0127) (0.0106) (0.0073) (0.0076)
Labour market and self-employment
experience -0.0017 0.0269*** -0.0059 -0.0226*** (0.0110) (0.0102) (0.0058) (0.0056) Business line 0.0045 -0.0017 0.0074 -0.0012 (0.0109) (0.0175) (0.0091) (0.0085) Perceived discrimination -0.0027 -0.0007 0.0012 -0.0032 0.0091 0.0076 0.0054 0.0049 Unemployment rate 0.0191* -0.0003 0.0102* 0.0092* (0.0101) (0.0088) (0.0054) (0.0051) Total 0.0461 0.0140 0.0374 -0.0053 Note: The decomposition of the gap in exit rate from self-employment is computed using a pooled sample of the two groups (see Neumark, 1988). Other covariates that contribute to thin the native-immigrant gap in exits from self-employment, but not shown here, are year and place of residence. The contributions of demographic characteristics, human capital, family traditions, access to financial capital, labour market and self-employment experience, business line, subjectively perceived discrimination, and regional unemployment comprise the covariates reported in Table 1. * p < 0.10, ** p < 0.05, *** p < 0.01
Finally, column (4) lists the contributions of group differences to the native-immigrant gap in exits to other labour market states. The main contributor in this case is differences in labour market experience prior to business start-up, which explains about 42 per cent of the gap. Non-European immigrants tend to enter self-employment from unemployment and inactivity to a larger extent than natives and these routes increase exits to inactivity. We also find that differences in family traditions explain about 4 per cent of the gap. In contrast, group differences in unemployment tend to decrease the gap since non-European immigrants live in
16 regions with a relatively lower unemployment rate and this decreases the observed gap in exits.
To sum up, group differences in regional unemployment contribute the most to differences in exits from self-employment at the aggregate level. Non-European immigrants tend to live in regions with lower levels of unemployment, (e.g. metropolitan areas) and this decreases their exits in general. However, as regards the labour market state to which the individuals exit, group differences in previous labour market experience play an important role. Non-European immigrants are more likely to enter self-employment from unemployment or inactivity and so they are less likely to exit to wage-employment and more likely to exit to inactivity. In addition, non-European immigrants’ relative lack of access to financial capital put them at a higher risk of exiting to unemployment.
5. Conclusions and discussion
This paper has been devoted to a study of exit rates from self-employment among immigrants in Sweden. A survey was conducted among all immigrants who became self-employed during the period 2001–2005 and among a native comparison group. The individuals were then followed up to the year 2010.
We find that immigrants have lower exit rates from self-employment than natives. The main explanation for this is that natives have higher exit rates to wage-employment than immigrants. Furthermore, there are also differences between immigrants and natives since immigrants have a higher propensity than natives of exiting self-employment for unemployment.
Special attention is paid to determinants of the gap in exit rates between non-European immigrants and natives with the help of a Blinder-Oaxaca decomposition. We find that the gap in exit rates from self-employment to wage-employment between non-European immigrants and natives is largely driven by group differences in prior labour market and self-employment experience.
Furthermore, we find that differences in prior labour market and self-employment experience increases the gap between non-European immigrants and natives in the propensity of exiting to other states, such as being economically inactive. Our results also reveal that access to financial capital (measured by net wealth and receipt of a start-up subsidy) is an important determinant in reducing the risk of exiting to unemployment. The gap in exits to unemployment between non-European immigrants and natives is thus partly driven by self-employed non-European immigrants’ positive net wealth and their receipt of a start-up subsidy.
In summary, our results confirm from the findings of previous research. We find that non-European immigrants to a larger extent than natives are entering self-employment from unemployment. In line with Andersson-Joona (2010), we find that relatively high exit rates to the category other states among the among non-European immigrants are driven by the fact that this group more often than natives are pushed towards self-employment by unemployment and lack of alternatives. Furthermore, problems with access to financial capital seem to drive the gap in exit rates to unemployment between non-European immigrants and natives. Thus, in line with Aldén and Hammarstedt (2015) we find that lack of access to
17 financial capital is a more serious problem for employed immigrants than for self-employed natives.
18
References
Aldén, L. & Hammarstedt, M. (2015).Discrimination in the credit market? Access to financial capital among self-employed immigrants, forthcoming in Kyklos.
Andersson, L. & Hammarstedt, M. (2010). Intergenerational transmissions in immigrant self-employment: Evidence from three generations, Small Business Economics, 34, 261–276. Andersson, L. & Hammarstedt, M. (2011a). Transmission of self-employment across immigrant generations: The importance of ethnic background and gender, Review of
Economics of the Household, 9, 555–577.
Andersson, L. & Hammarstedt, M. (2011b) ”Invandrares egenföretagande – trender, branscher, storlek och resultat”, Ekonomisk Debatt, 39, 31–39.
Andersson, L. & Hammarstedt, M. (2015). Ethnic enclaves, networks and self-employment among Middle Eastern immigrants in Sweden, International Migration, 53, 27–40.
Andersson-Joona, P. (2010). Exits from self-employment: Is there a native-immigrant difference in Sweden?, International Migration Review, 44, 539–559.
Arbetsförmedlingen (2014). Arbetsförmedlingens faktablad, 2014-09.
Asiedu, E., Freeman, J.A. & Nti-Addae, A. (2012). Access to credit by small businesses: How relevant are race, ethnicity and gender?, American Economic Review: Papers & Proceedings. 102: 532–537.
Bates, T. (1999). Exiting self-employment: An analysis of Asian immigrant-owned mall businesses, Small Business Economics, 13, 171–183.
Borjas, G. J. (1986). The self-employment experience of immigrants, Journal of Human
Resources, 21, 487–506.
Borjas, G.J. & Bronars, S.G. (1989). Consumer discrimination and self-employment, Journal
of Political Economy, 95, 581–565.
Bates, T. (1999). Exiting self-employment: An analysis of Asian-immigrant owned businesses, Small Business Economics. 13: 171–183.
Blanchard, L., Zhao, B. & Yinger, J. (2008). Do lenders discriminate against minority and woman entrepreneurs?, Journal of Urban Economics. 63: 467–497.
Blanchflower, D.G., Levine, P.B. & Zimmermann, D.J. (2003). Discrimination in the small-business credit market, Review of Economics and Statistics. 85: 930–943.
Blanchflower, D.G. & Oswald, A. (1998). What makes an entrepreneur?, Journal of Labor
Economics. 16: 26–60.
Cavalluzzo, K.S. & Cavalluzzo, L.C. (1998). Market structure and discrimination: The case of small businesses, Journal of Money, Credit and Banking. 30: 771–792.
19 Clark, K. & Drinkwater, S. (2000). Pushed out or pulled in? Self-employment among ethnic minorities in England and Wales, Labour Economics, 7, 603–628.
Constant, A. & Zimmermann, K. F. (2006). The making of entrepreneurs in Germany: Are immigrants and natives alike?, Small Business Economics, 26, 279–300.
Evans, D. & Jovanovic, B. (1989). An estimated model of entrepreneurial choice under liquidity constraints, Journal of Political Economy, 97, 808–827.
Fairlie, R. W. (1999). The absence of the African-American owned businesses: An analysis of the dynamics of self-employment, Journal of Labor Economics, 17, 80–108.
Fairlie, R. W. & Meyer, B. D. (1996). Ethnic and racial self-employment differences and possible explanations, Journal of Human Resources, 31, 757–793.
Fairlie, R.W. & Robb, A. M. (2007). Why are black-owned businesses less successful than white-owned businesses? The role of families, inheritances, and business human capital,
Journal of Labor Economics, 25, 289–323.
Hammarstedt, M. (2001). Immigrant self-employment in Sweden – its variation and some possible determinants, Entrepreneurship and Regional Development, 13, 147–161.
Hammarstedt, M. (2004). Self-employment among immigrants in Sweden – an analysis of intragroup differences, Small Business Economics, 23, 115–126.
Hammarstedt, M. (2006). The predicted earnings differential and immigrant self-employment in Sweden, Applied Economics, 38, 619–630.
Hammarstedt, M. & Shukur, G. (2009). Testing the home-country self-employment hypothesis on immigrants in Sweden, Applied Economics Letters, 16, 745–748.
Hout, M. & Rosen, H. (2000). Self-employment, family background, and race, Journal of
Human Resources, 35, 670–691.
Jann, B. (2008). A Stata implementation of the Blinder-Oaxaca decomposition, Stata Journal, 8, 453-479.
Le, A. T. (2000). The determinants of immigrant self-employment in Australia, International
Migration Review, 34, 183–214.
Lofstrom, M. & Wang, C. (2006). Hispanic self-employment: A dynamic analysis of business ownership, IZA Discussion Paper, 2101.
Neumark, D. (1988). Employers’ discriminatory behaviour and the estimation of wage discrimination, Journal of Human Resources, 23, 279-295.
Robb, A. M. & Fairlie, R. W. (2009). Determinants of business success: An examination of Asian-owned businesses in the USA, Journal of Population Economics, 22, 253–266.
20 Yuengert, A. M. (1995). Testing hypotheses of immigrant self-employment. Journal of
21
Appendix A
Table A1: List of variables
Dependent variables
Exit from self-employment 1 the individual is no longer defined as self-employed, 0 otherwise
Exit to wage-employment 1 the individual exits self-employment and is defined as wage-employed, 0 otherwise
Exit to unemployment 1 the individual exits self-employment and is defined as unemployed, 0 otherwise
Exit to other states 1 the individual exits self-employment and is not defined as wage-employed or unemployed, 0 otherwise
Independent variables
Natives Reference
European immigrant 1 if the firm owner was born in a European country, 0 otherwise
Non-European immigrant 1 if the firm owner was born in a non-European country, 0 otherwise
Demographic characteristics
Years since migration Year minus year of immigration (numerical) Age Firm owner’s age (numerical)
Female 1 if the firm owner is female, 0 otherwise Married 1 if the firm owner is married, 0 otherwise
Human capital characteristics
Primary school Reference
Secondary school 1 if the firm owner has secondary schooling, 0 otherwise University degree 1 if the owner has a university degree, 0 otherwise Family traditions
Self-employed father 1 if the firm owner has a self-employed father, 0 otherwise Self-employed mother 1 if the firm owner has a self-employed mother, 0 otherwise
Access to financial capital
Zero net wealth Reference
Negative net wealth 1 if the firm owner has negative net wealth at business start-up, 0 otherwise
Positive net wealth 1 if the firm owner has positive net wealth at business start-up, 0 otherwise
Receipt of start-up subsidy 1 if the firm owner has received a start-up subsidy, 0 otherwise
Labour market and self-employment experience
Entered self-employment from
wage-employment Reference
Entered self-employment from unemployment 1 if the firm owner was defined as unemployed the year before business start-up, 0 otherwise
Entered self-employment from other state 1 if the firm owner was not defined as wage-employed or unemployed the year before business start-up, 0 otherwise Experience from self-employment 1 if the firm owner has been self-employed in Sweden or in
the home country prior to the business start-up, 0 otherwise
22 Table A1 continued.
Business line
Manufacturing/construction Reference
Retail trade 1 if the firm owner is active in retail trade, 0 otherwise Financial services 1 if the firm owner is active in retail trade, 0 otherwise Personal and other services 1 if the firm owner is active in personal or other services, 0
otherwise
Other or unspecified 1 if the firm owner is active other business lines or has no specified business line, 0 otherwise
Perceived discrimination
Subjectively perceived customer
discrimination 1 if the firm owner has subjectively perceived customer discrimination, 0 otherwise
Unemployment rate
Regional unemployment rate County unemployment rate
Place of residence Dummy variables indicating in which county the firms owner lives.
Self-employment duration Dummy variables indicating the length of the self-employment spell (2 to 6 years).