The Supply Chain Cockpit
A High-level Performance Measurement System for a
Semiconductor Supply Chain
Master Thesis in Production Management,
Lund University - Faculty of Engineering
Author: Carl-Johan Dhejne Tutor: Bertil I Nilsson
Preface
This study was conducted at, and sponsored by ST-Ericsson in Lund during five months in the winter and spring of 2010. This dissertation is the final examination of my master in Industrial Engineering and Management. My field of interest is in business development and strategy formation and when I got the opportunity to do my master thesis for ST-Ericsson, studying the implementation of a High-level performance measurement system for ST-Ericsson’s supply chain, I jumped to the challenge. I have got a unique experience following ST-Ericsson’s transformation to become a unified company and a global player in the semiconductor industry, from first row.
ST-Ericsson has openly welcomed me to the organization and given me all help needed for this study, which I am very thankful for. I would like to express a special thanks and deep appreciation to Jesper Löfberg for his guidance as my supervisor and mentor at ST-Ericsson. I also would like to thank Peter Unelind, Mikael Tordenmalm and Charlie Yeh for their valuable input on my work. You have all given me not only professional input to my thesis, but also supported me in my personal development through construct criticism and always challenging my stand point.
A special thanks also goes to Bertil I Nilsson, my tutor from the department of Industrial Management and Logistics, for his input and always positive feedback on my work. You have guided me through the academic part of my thesis and taken a lot time to reinsure I was on the right path.
Lund, June 2010
Abstract
Organizations have over the latest decades seen a growing need for new multi-dimensional measures for evaluating their business performance, since traditional accounting models for long have proven not to be applicable to the modern business environment. Together with the need for timely information this has caused extensive requirements on the ERP-systems which often do not meet the needed requirements. This study investigates how a performance measurement cockpit can be developed for a supply chain to serve this purpose.
The wireless semiconductor company, ST-Ericsson, was formed in 2009 by bringing together Ericsson Mobile Platforms (EMP) and ST-NXP Wireless, into a joint venture between the parent companies Ericsson and STMicroelectronics. As a result of the merger ST-Ericsson became one of the market leaders in wireless technology and a supplier to four of the top five handset manufacturers in the world.
After the merger the division L3M was created, mainly from parts of the past EMP organization, and became operational in 2010. EMP was a design house for mobile platforms which relied on partners for supplying the hardware, only delivering the accompanying software themselves. ST-Ericsson was also made into a non-manufacturing company that outsourced its production, but still had full product ownership. For the former EMP employees and the L3M team this meant a whole new supply chain process, with real hardware ownership. L3M partly lacked capabilities and competences in the supply chain management field. Another problem was keeping track of the allocated cost in the supply chain, which resulted in a need for a performance measurement system.
With the use of the business intelligence tool QlikView a performance measurement system-prototype, named the Supply Chain Cockpit was developed, and studied in a clinical method, for L3M’s supply chain. By mapping the supply chain process, the cockpit was developed to align the performance measurement system with the division’s strategy and targets to enable competitive advantage through sustainable supply chain performance.
Together with deeper knowledge of the supply chain, the result was a prototype of a user-friendly, clear and visual performance measurement tool, with the ability to extract timely reports for upper management. The prototype compiles and stores data, with a powerful ability to drill down into the data for analysis of the material. Organizations can easily drown in their own data and the Supply Chain Cockpit displays how data can be compiled and performance visualized without lowering the data granularity.
Sammanfattning
Organisationer har under de senaste decennierna sett ett växande behov av nya flerdimensionella mätvärden för utvärdering av deras verksamhet eftersom de traditionella redovisningsmodellerna sedan länge har visat sig inte vara tillämpningsbara för den moderna affärsmiljön. Detta har tillsammans med behovet av att erhålla aktuell information orsakat omfattande krav på ERP-system vilka ofta inte uppfyller de nödvändiga kraven. Denna studie undersöker hur en prestationsbedömnings-cockpit kan utvecklas för företagets försörjningsskedja för att tjäna just detta syfte.
ST-Ericsson bildades 2009 genom att sammanföra Ericsson Mobile Platforms (EMP) och ST-NXP Wireless, i ett joint venture mellan moderbolagen Ericsson och STMicroelectronics. Som ett resultat av fusionen blev ST-Ericsson en av marknadsledarna inom trådlös teknik och leverantör till fyra av de fem största mobiltelefonstillverkarna i världen.
Efter sammanslagningen skapades divisionen L3M, främst från delar av den gamla EMP-organisationen, och blev operationell 2010. EMP var ett designhus för mobila plattformar som förlitade sig på partnerföretag för att leverera hårdvara, medan de själva enbart levererade den tillhörande mjukvaran. ST-Ericsson skapades även som ett icke-producerande företag med outsourcad produktion, men hade fullt produktägarskap. För de tidigare EMP-medarbetarna och det nya L3M-teamet innebar detta en helt ny process för försörjningskedjan, med ägarskap över hårdvaran. L3M saknade delvis kapabilitet och kompetens inom supply chain managementområdet. Ett annat problem var att hålla reda på de allokerade kostnaderna i försörjningskedjan, vilket sammanslaget resulterade i ett behov av ett prestationsbedömningssystem.
Med hjälp av Business Intelligence-verktyget QlikView utvecklades en prototyp av ett prestationsbedömningssystem, kallat the Supply Chain Cockpit. Prototypen har utvecklats och undersökts med en klinisk metod för L3M försörjningskedja. Genom processkartläggning av försörjningskedjan har cockpiten utvecklats för att anpassa prestationsbedömningssystemet till divisionens strategi och mål för att möjliggöra konkurrensfördelar genom en hållbar prestanda i försörjningskedjan. Tillsammans med fördjupad kunskap om försörjningskedjan, var resultatet en prototyp av en användarvänlig, tydlig och ett visuellt prestationsbedömnings-verktyg, med möjlighet att ta fram aktuella rapporter för ledningen, med en kraftfull förmåga att dyka ner i data för vidare analys av materialet. Organisationer kan lätt drunkna i sin egen information och denna Supply Chain Cockpit visar hur data kan sammanställas och visualisera operationell prestation utan att offra upplösningen.
Table of Contents
1 Introduction ... - 1 - 1.1 Background... - 1 - 1.2 Problem Description ... - 2 - 1.3 Purpose ... - 3 - 1.4 Objectives ... - 3 - 1.5 Target Group ... - 3 - 1.6 Delimitations ... - 3 - 1.7 Report Outline ... - 4 - 2 Methodology ... - 7 - 2.1 Case Study ... - 7 - 2.2 Action Research ... - 8 - 2.3 Clinical Research ... - 8 - 2.4 Scientific Approach... - 8 -2.5 Qualitative and Quantitative Methods... - 9 -
2.6 Validity and Reliability ... - 9 -
2.7 Methodology of the Study ... - 9 -
3 Theoretical Framework ... - 13 -
3.1 Supply Chain Management ... - 13 -
3.2 Process Management ... - 14 -
3.2.1 Process Mapping ... - 15 -
3.3 Performance Measurement Systems ... - 17 -
3.3.1 Performance Measurement ... - 18 -
3.3.2 The Balanced Scorecard ... - 18 -
3.3.3 Supply Chain Performance Measurement ... - 20 -
3.3.4 Factual Approach to Decision Making ... - 21 -
3.4 SCOR-Model ... - 21 -
3.4.1 Implementing the SCOR Methodology ... - 22 -
3.5 Theoretical Summery ... - 24 -
4 Introduction to ST-Ericsson’s Supply Chain... - 25 -
4.1 Production Process ... - 25 -
4.2 Supply Chain Business Model ... - 26 -
5 Empirical Framework ... - 29 -
5.1 Review of Corporate Strategy ... - 29 -
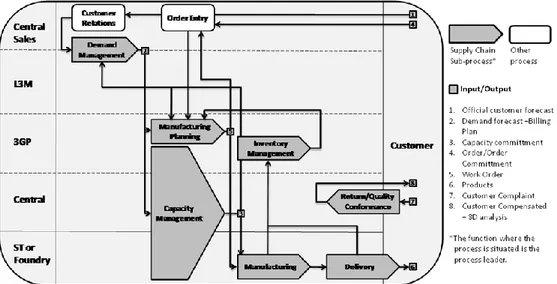
5.2 Define the Supply Chain Process ... - 30 -
5.2.1 Process Identification with SCOR ... - 31 -
5.2.2 Demand Management ... - 32 - 5.2.3 Capacity Management ... - 33 - 5.2.4 Manufacturing Planning ... - 33 - 5.2.5 Manufacturing... - 34 - 5.2.6 Inventory Management ... - 34 - 5.2.7 Delivery ... - 34 - 5.2.8 Return/Quality Conformance ... - 34 -
5.3 Performance Measurements ... - 34 -
5.3.1 Yield ... - 35 -
5.3.2 Cycle Time ... - 35 -
5.3.3 Cost of Goods Sold ... - 35 -
5.3.4 K-Factor ... - 36 -
5.3.5 Inventory Value ... - 36 -
5.3.6 Inventory Turns ... - 36 -
5.3.7 Committed Delivery Date and Requested Delivery Date ... - 36 -
5.3.8 Delivery Delinquency ... - 36 -
5.3.9 Global Late Delivery (GLD) ... - 37 -
5.3.10 Quality Complaints... - 37 -
5.4 The Development of the Supply Chain Cockpit ... - 37 -
5.4.1 Quantitative Data ... - 38 -
5.4.2 Reporting Periods & Decision Meetings ... - 38 -
6 Analysis ... - 39 -
6.1 Determine the Performance of the Existing Supply Chain ... - 39 -
6.1.1 Demand Management ... - 39 - 6.1.2 Capacity Management ... - 41 - 6.1.3 Manufacturing Planning ... - 42 - 6.1.4 Manufacturing... - 42 - 6.1.5 Inventory Management ... - 43 - 6.1.6 Delivering ... - 44 -
6.1.7 Return and Quality Conformance ... - 45 -
6.2 Establish the Supply Chain Strategy, Goals and Priorities ... - 46 -
6.2.1 Evaluation of Performance Attributes ... - 46 -
6.2.2 Supply Chain Strategy ... - 48 -
6.3 Evaluation of the Supply Chain Cockpit ... - 49 -
6.3.1 Reporting Tool ... - 50 -
6.3.2 Basis for Factual Decision Making ... - 50 -
6.3.3 Drawbacks ... - 51 -
7 Discussion ... - 53 -
8 Conclusions ... - 55 -
8.1 Result ... - 55 -
8.2 Conclusions and Recommendations ... - 56 -
8.3 Future Studies ... - 56 -
Bibliography ... - 59 - Appendix I: The Supply Chain Cockpit in QlikView ... I Appendix II: QlikView Description ... I
Glossary and Abbreviations
3GP = 3G Platforms (Division)ASIC = Application Specific Integrated Circuit ASSP= Application Specific Standard Product Back-end = Assembly, test and finish of dice BSC = Balanced Scorecard
CD = Committed Delivery Date
CTO = Central Technology & Strategic Planning Organization Die = Silicon Chip (dice in plural)
EMP = Ericsson mobile platforms ERP = Enterprise Resource Planner
ETC = 2G, EDGE, TD-SCDMA & Connectivity Solutions (Division) EWS = Electrical Wafer Sort
Fab = A production unit for semiconductor wafers Front-end = Die production from silicon wafer JIT = Just In Time
KPI = Key Performance Indicator KRI = Key Result Indicator
L3M = LTE & 3G modem solutions (Division) LTE = Long Term Evolution (4G access technology) P&L = Profit and Loss
PI = Performance Indicator
PMS = Performance Measurement System QlikView = Business Intelligence Software QlikTech = Owner and developer of Qlikview RD = Requested Delivery Date
SCOR = Supply Chain Operations Reference-model SCM = Supply Chain Management
ST-NXP = ST-NXP Wireless ST = STMicroelectronics
VMI = Vendor Managed Inventory Wafer = Silicon disc in 12’’ or 8’’ WIP = Work In Progress
1 Introduction
This chapter will provide an introduction of the study, with the company background of ST-Ericsson, a problem description together with the purpose and the objectives of the study. The target group, delimitation of the study and an outline of this report ends this chapter.
1.1 Background
ST-Ericsson is a high tech company that develops and manufactures semiconductor platform technologies for wireless products such as mobile phones and USB-dongles. ST-Ericsson was formed in February 2009 as a joint venture with 50/50 ownership between LM Ericsson and STMicroelectronics (ST). The joint venture was formed by bringing together the divisions Ericsson Mobile platform (EMP) from Ericsson and ST-NXP Wireless (ST-NXP) from ST. As a result of the merger ST-Ericsson became one of the market leaders in wireless technology and a supplier to four of the top five handset manufactures in the world. The new company had one of the largest intellectual property portfolio rights in the industry and covered all the available technologies on the markets; from 2G technology for entry phones to the cutting edge technology at that time, LTE or 4G access technology. ST-Ericsson had approximately 8000 employees worldwide. In late 2009 the brand new organization was set and most of the reconstructing and integration work was finished. Three divisions had been formed and were based mainly on the infrastructure technologies. The divisions were L3M, 3GP and ETC. L3M stands for LTE & 3G modem solutions, 3GP had mainly 3G technology and ETC had mainly 2G technology. Besides the main divisions there was also a number of supporting central functions like Sales, Finance and Operations.
The division L3M was to a great extent concentrated to the Lund site in Sweden and the Nuremberg site in Germany, which were dominated by former EMP employees. This put extra stress on the transformation to a ST-Ericsson division, since the employee perspective was almost entirely from the Ericsson side while most of the systems used came from the ST side.
One of the main differences between EMP and ST-NXP was that EMP did not have any own production or product ownership. EMP was a design house for mobile platforms which relied on partners for supplying the hardware, for example ST. EMP delivered the software which enabled the hardware to function as required for the specific application. ST-Ericsson was also made into a fabless company that outsourced its production to ST and external foundries, but still had full product ownership. For the former EMP employees and the L3M team this meant a whole new supply chain process, with real hardware ownership. Before the merger the
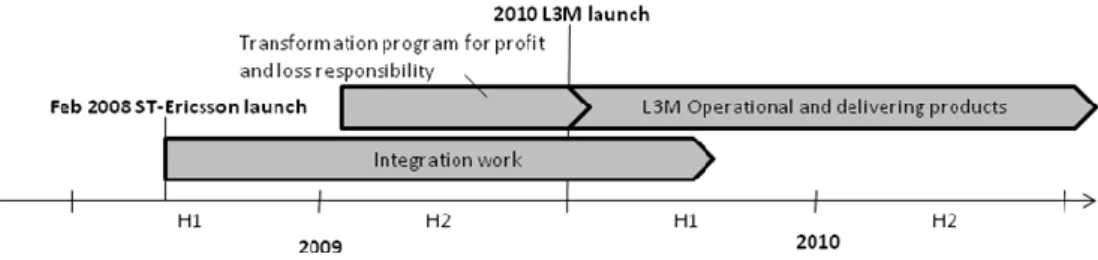
R&D Access unit L3M is based upon was more or less considered a cost center. During the reconstructing in the fall of 2009, it had been transformed to a profit and loss responsible division, resulting in new requirements for costs control. Since the L3M team had little experience in supply chain management most of the production planning was outsourced to the sister division 3GP, with its planning organization situated at the Grenoble site, in France. In January 2010 the L3M division went live and hardware components were starting to be delivered to customers, which L3M had full responsibility for. L3M’s sales were rapidly increasing and the need for a performance measurement system (PMS) for the supply chain was apparent. See figure 1 for ST-Ericsson and L3M’s time line.
Figure 1. ST-Ericsson and L3M’s Time Line
1.2 Problem Description
The semiconductor industry is considered to have one of the most complex supply chains of any industry, for many reasons, partly because of a very long lead-time and complicated production procedures. L3M partly lack capabilities and competences in this field, which need development. Another problem is keeping track of the allocated cost in the supply chain, due to production costs, capital build up and value added in the different production steps. In order for L3M to extend their competences in the supply chain process and keep track of the costs and the performance there within, a new performance measurement system would be a great tool for improvements. After the merger there was no uniform ERP-system used for the supply chain activities and none of them provided an easy to use interface with visual presentation of the different supply chain aspects.
The author was given a unique opportunity to take part in the process of bringing a new PMS and reporting package in place. The PMS was named the Supply Chain Cockpit, since the system should provide a picture of the status of the supply chain, much like a cockpit has gauges and meters to give a picture of the aircrafts flying performance. A great challenge in this project is extracting the right data from a vast ocean of information and corporate documents circulating within the company. And as a last challenge converging the information into a user-friendly, clear and visual performance measurement tool.
1.3 Purpose
The purpose of this study was to design and develop a prototype of a high-level performance measurement system that suits L3M’s supply chain needs. The prototype was then tested and evaluated and will serve as a basis for deciding if it is a satisfactory PMS for L3M. The purpose of the PMS is to serve as an analysis tool of the supply chain performance, with the ability to extract reports for upper management. The system should also enable the company for continuous improvements that in the long run can give ST-Ericsson competitive advantages in their supply chain performance.
The secondary purpose of this study was to develop insight and knowledge about L3M’s supply chain. This means, raising the competences in the new supply chain process for the employees at L3M, for which this report should serve as an internal document about L3M’s supply chain.
1.4 Objectives
The objective was to construct a performance measurement system that can be implemented right away from the prototype. The prototype should also be in line with the company’s and the division’s strategies and targets.
A secondary objective, directed to the academic society, is for this study and this report to give insight and knowledge into implementing a performance measurement system for a supply chain in a company in a post merger state. Bringing two companies together is a long, wearing and tearing process that in many cases fails. Understanding the new conditions, in this case transforming into a hardware company, and start focusing on the business instead of the integration is crucial. This study investigates how going through a supply chain strategy review can help in the transformation process.
1.5 Target Group
The target group for this dissertation is mainly the staff at ST-Ericsson and primarily those within L3M Operations. This dissertation is not only an evaluation report of a performance measurement system; it should also serve as a handbook on L3M’s supply chain.
A secondary target group is students and staffs at universities and higher educations, which are interested in the field of supply chain management, performance measurement systems, strategy formation and change management.
1.6 Delimitations
The research conducted at ST-Ericsson started out as an exploratory study, by defining and learning about the supply chain. Along the way, as new hurdles and missing links were discovered, certain aspects of the supply chain process was
excluded in the Supply Chain Cockpit while others were added. These parts are all motivated and explained in chapter 5 and 6, the empirical framework and analysis. The study was limited to the division L3M’s supply chain because of the sheer magnitude of the supply chain and the limiting timeframe during which the study was conducted. Another interesting aspect of L3M, from a research perspective, is that L3M is new to this process, which makes an interesting case in how a performance measurement system is developed for an existing and functioning supply chain.
1.7 Report Outline
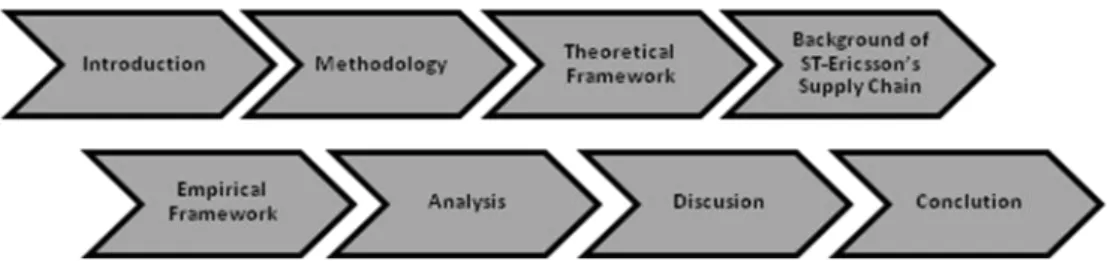
To get the complete picture of this study and an understanding of how the theories and methodologies are used for the empirics and analysis chapter (the main part of the dissertation), the report can be read cover to cover. An alternative approach, for the more well-read in the subject, is to read the introduction, continuing at the empirics for the rest of the report and looking back to the theoretical framework and methodology where referenced. The logic of the chapter divisions is described below and represented in figure 2:
Introduction – Gives the reader the needed background of ST-Ericsson, which led
to the initiating of the study. Followed by the background are a deeper problem description and the purpose and objectives of the study. The chapter ends with the target group, delimitations and this report outline.
Methodology – Presents the methodology which the study is conducted
according to, starting with a general background on methodologies and ending with the chosen ones.
Theoretical Framework – Presents the relevant theories in supply chain
management, process management, performance measurements and SCOR, which the empirics and the analysis later is based upon, together with the methodology chapter.
Introduction to ST-Ericsson’s Supply Chain – Provides an introduction to the
semiconductor production processes and supply chain business models, used by ST-Ericsson, since it is central for the empirics and the analysis.
Empirical Framework – Presents the relevant empirics gathered at ST-Ericsson
during the time of the study.
Analysis – Presents the analysis of the relevant empirics in relation to the purpose
and objectives of the study.
Discussion – Provides a discussion about whether if the purpose and objectives of
the study was met and what the implications are in an academic perspective
Figure 2. Report Outline
2 Methodology
This chapter provides a discussion of methodologies for the research conducted at ST-Ericsson, which serves as a background for the motivation of the chosen methodology.
2.1 Case Study
Case study methodologies are used when studying single cases in depth and are an empirical investigation of a contemporary phenomenon within its real life context. It is especially appropriate when the boundaries between phenomenon and context are not clearly evident (Yin, 1994). The objective of the case study is to obtain valuable and unique insights in the studied object or phenomenon, which is not obtainable by other methods (Denscombe, 2000).
A case study can be exploratory, descriptive and explanatory or a combination of the three (Yin, 1994). If the study is exploratory the aim is defining the questions and hypotheses of a subsequent study. A descriptive case study presents a complete description of a phenomenon within its context and an explanatory case study compiles data, explaining the full cause and effect relationships (Seuring, 2005). In order for a case study to serve as a critical example the studied object need to fulfill certain criteria’s; for example, that it is a unique case, a typical and representative case or a case that can provide a longitudinal study in time (Seuring, 2005).
Over the years there has been considerable criticism of the case study method, claiming it is not rigor, since it can allow the investigator to present equivocal and biased findings and conclusions. These are properties that lay in the investigators ability to execute the study and are difficult to control. It can be argued that this also is evident in other more frequently used study methods, e.g. surveys, though more prominent in case studies. Another concern is that there is no ability to generalize from a single case. In contrast to surveys, case studies cannot be generalized to a population, but like experiments it still can be generalized to a theoretical proposition. (Yin, 1994)
Case studies are an appropriate study method for analysis of a supply chain and managerial issues with highly unstructured problems, which can be dealt with in an exploratory research design. For supply chain management studies, case studies allow for identification and description of critical variables. (Seuring, 2005)
2.2 Action Research
Action research is a study method with many similarities to case studies. The study method is used when the study object is to be improved or a problem there within needs to be solved, while it is being studied. The research begins with observing a situation or phenomenon to identify and clarify problems. This can be done by a case study approach. The next step is constructing suggestions for solutions of the problem. The last step is an evaluation of the solution, by observations and analysis of it in its context. (Höst, Ragnell & Runeson, 2009) Action research is characterized by four different traits. First, action research is very practical oriented and deals with real problems and questions that arise, mainly in workplaces and in organizational contexts. Second, change is integrated with the research both as a way to deal with the problem and a way to gain greater knowledge about the phenomenon, meaning that an alteration of the studied object can result in wider knowledge about the object. Third, action research is a cyclic- or iterative process that is repeated until the solution is satisfactory. Fourth, the research process is participative, with the central people of the research. (Denscombe, 2000)
2.3 Clinical Research
Clinical research is a study method with a heritage from medicine studies, though the method is also applicable to organizational context and suitable for studies of transformation processes. Clinical research is often described as synonymous to action research, though they can be distinguished in relation to the initiator of the problem area. In clinical studies the case company makes the distinction of the problem, in action research it is the investigator who makes the distinctions. The methodology is founded on the notion that both the work and the views should actively be exchanged between the researcher and the client (or case company). (Sköld, 2007)
2.4 Scientific Approach
There is two main ways of conducting an academic study: inductive and deductive approach. The inductive approach starts with gathering empirics and from it draw generalized conclusions about the cases. With a deductive approach the study begins with a theoretical hypothesis, which serves as a base for drawing conclusions about the studied case. (Alvesson & Sköldberg, 2008)
An alternative approach is an abductive one, where empirics of a case are analyzed by a theory. Then new empirical studies are made to verify the theoretical conclusions. (Alvesson & Sköldberg, 2008)
2.5 Qualitative and Quantitative Methods
Qualitative research focuses on open, ambiguous empirics. A qualitative research has a starting point from the studied objects perspective, while quantitative research is based on the investigators perception of how the object should be characterized from a set of dimensions. There has been debate about qualitative versus quantitative methods. Though the argument now seems to have settled to a consensus that the choice of method has to be related to the research problem and the nature of the studied object. (Alvesson & Sköldberg, 2008)
2.6 Validity and Reliability
The quality of case study research is often established through test of validity and reliability. In social research these quality tests are commonly divided into construct validity, internal and external validity and finally reliability. (Yin, 1994)
Construct Validity
Construct validity is concerned to see whether the right operational measures are being used for the concepts being studied. This can be problematic in case study research, since there easily can be subjective judgments when collecting data. To avoid subjectivity the operational measures should be set in relations to the original objectives of the research. (Yin, 1994)
Internal Validity
Internal validity is concerned with the cause-and-effect relationships, and whether they are described fully, without leaving out any effecting aspects. The Internal validity test is only applicable to Explanatory cases. (Yin, 1994)
External Validity
External validity makes the case studies able to draw generalizations from findings. The difficulty of making general assumptions in a case study has been criticized and is the biggest concern about the case study method. (Yin, 1994)
Reliability
Reliability tests if another investigator that goes through all the same steps as described by the original investigator arrives at the same findings and conclusions. The goal of this test is to minimize errors and biases. (Yin, 1994)
2.7 Methodology of the Study
The chosen method for the study at ST-Ericsson was a combination of a case study and clinical research. For the understanding of all the cause-and-effect relationships in the supply chain and the organization at large, the case study approach was used. The situational context of ST-Ericsson was of high complexity and quite unique, making it suitable for a case study. The employees at the Lund site also needed better understanding and insight of the supply chain process,
both within and outside the company, which reinforces the choice of a case study approach.
However, there was also an urgent need for a performance measurement system and a reporting system for the supply chain and the development of a prototype was placed upon the author of this dissertation. Since there was expectation on a functioning prototype the research needed corrective actions throughout the timeframe of the study, which led to the choice of a clinical research for this part. ST-Ericsson offered a unique opportunity to study how a high-level performance measurement system can be developed in a time of rapid change in a post merger state. In order to seize this opportunity the clinical method needed to be adapted, meaning that a risk of biases of the researcher and limiting reliability followed. The need for this PMS-system was expressed by ST-Ericsson, hence the choice of a clinical study and not an action research, otherwise the methodology followed the basics of action research. The work with the PMS was carried out in a project group, with employees at ST-Ericsson, which adds up to a research that is practical, participative and integrated with change.
The developed system was tested as far as possible, though time was a restrictive factor. The time constraint limited the development of the system to a first prototype, which if implemented needs to be continuous improved and tested for the validation of the PMS. The research was also agile and altered along the way to fulfill the requirements of both the company and the changing environment. It would be a stretch to say that this was an iterative process, but the study went fourth and back continuously between the objectives and the updated requirements, checking their compliance.
A qualitative method was used in the case study of the company in order to capture different aspects of the supply chain. Since one of the aims of the study was to gain a greater understanding of the supply chain, a quantitative approach with a preset comprehension would limit the analysis. A qualitative analysis allowed the analysis to go in parallel with the empiric findings and the development of the PMS-system.
Though this study was qualitative the aim was that it would results in a system, which is based on a quantitative approach for the analysis of the supply chain. The qualitative method was used to develop the parameters for the quantification of the studied object.
As the choice of a qualitative method indicates, the study was also an abductive approach. The study started with a theoretical review to identify similar cases and best practices. The theoretical review was followed by empirical gatherings, to be able to draw conclusions with the theoretical background. From the first analysis, the theory was revised and another round of empiric gathered, this time with the
purpose to test the theoretical background and the conclusion from the first analysis. In this way the findings was validated in an abductive manner.
For the empirics both primary and secondary sources were gathered. The primary sources of information were mostly gathered through semi-structured interviews, workshops and observations at the Lund site of ST-Ericsson. The secondary sources were mostly company documents and reports made for various purposes in the organization. All the documents used was thoroughly investigated and checked by employees in the project group for validation of the content.
With this wide variety of both primary and secondary sources, gathered through different methods, the construct validity was ensured. In the continuous work there were control against the employees with the greatest knowledge in the organization, and the work progress was corrected and changed in accordance to their expertise to guarantee the internal validity.
The external validity was hard to obtain, but on the other hand this study was of the exploratory and descriptive kind, which do not have the same requirements on external validity as an explanatory study. Benchmarking was used to some extent to gain better external validity. There was benchmarks done against other divisions and functions within ST-Ericsson, and there was a review of benchmarks done from other sources, such as the Supply Chain Counsil (SCC). To some extent the benchmark within the organization was done by ST-Ericsson employees from the project group, which in a sense is a triangulation since the project group members benchmark their view, and in the end passes it on to the author. The author’s research findings were validated through the project group members and other knowledgeable employees within the organization.
The reliability in the study was hard to ensure in a satisfactory manner. The confidentiality issues hinder the publishing of documentations, numerical data. Even without the confidentiality the settings of the study is impossible to duplicate. With a clinical method in this unique situation the aim was that the research resulted in new valuable research findings that would not be gained otherwise.
3 Theoretical Framework
This chapter provides a theoretical framework which is used during the empirical gathering but primarily for the analysis that leads to the conclusions of the study.
3.1 Supply Chain Management
The term supply chain is used in literature to describe the network of inter and outer company relations, used in order to bring a product or service to the market. Defining the supply chain depends on where the focal point of the chain is set and the link can be visualized as below, from standpoint of what is here referred to as the organization (ISO 16949, 2002):
Supplier Organization Customer
From the theory of supply chains the term supply chain management (SCM) was introduced in the 1980’s, and gained a widespread use in the 1990’s. The term comprised several management fields, for example purchasing and supply, logistics and transportation, operation management, marketing, organizational theory, management information system and strategic management (Chen & Paulraj, 2003). A common definition of SCM is that the supply chain encompasses all activities associated with the flow and transformation of goods from raw materials stage (extraction), through to the end user; and SCM is the integration of these activities through improved supply chain relationships (Seuring, 2005). Even though the field of SCM is comprised of many fields, the term is closely related to logistics and maybe more so to logistics management. The terms are often being used synonymous. Mattsson (2007) states that logistics encompasses the problem areas of planning, developing, organizing, coordinating and controlling the material flow. The difference between the two terms is that SCM gives a comprehensive picture of the supply chain and all its links, not only from one company’s perspective. Further, the benefits for all the members of the chain are considered and the flow of services and information are included (Mattsson, 2004).
An SCM perspective on business processes usally create performance improvements through reduction in total cost and inventories by forming strategic alliances and increasing information sharing with all the channel members (Gunasekaran, Patel, & McGaughey, 2004). The fact that SCM tries to construct a relationship between actors in the supply chain to provide mutual benefits, reflects a decentralized, horisontal and non-power based structural link among the supply chain members (Chen & Paulraj, 2003). This has made the field of SCM represents one of the modern business management by recognizing that
individual business no longer compete as soley autonomous entities but rather as supply chains (Chen & Paulraj, 2003).
3.2 Process Management
Traditionally producing and distributing companies have been organized by function (Mattsson, 2004). In the modern and more dynamic environment, the functional organization has proven to have a number of flaws. In order to tackle these problems and get an organization in line with its business environment, companies have to a larger extent adapted a process view of their business. The motive behind a functional oriented organization has been that efficiency rises through specialization. But combining a number of specialized functions does not ensure efficiency for the entire company. Another principle behind functional organizations has been to divide organizations by input and resources. For example, purchasing staff as a resource are grouped together to handle the inputs to the production process. This principal is not as intuitive as the former, since the company primarily gets its revenue from the output in form of products. From this point of view, it would mean that the company rather would be organized according to the output, which is the products and material flow in the organization. (Mattsson, 2004)
A process view of the organization aims to get alignement with the customers’ needs and the product and information flow through the organization. The process approach emphasis a more comprehensive view of the company; from a need expressed by the customer, through all the activities to the satisfaction of the customer needs (Ljungberg & Larsson, 2001).
In order to describe an organization in terms of processes, a definition of a process is necessary. There are numerous ways to describe a process and many definitions have been presented. ISO 9000 (2000) defines the term process as:
“Set of interrelated or interacting activities which transforms input into output.
Note 1: Inputs to a process are generally outputs of other processes. Note 2: Process in an organization are generally planned and carried out under controlled condition to add value.”
In order to add value processes uses information and resources to transform input into output (Ljungberg & Larsson, 2001) and as the definition indicates the purpose of a process is to add value. The purpose of a process approach is to eliminate non-value adding activities, so solely those activities that do add value are being used. This might seem obvious but there are many non-value adding activities in corporations (Mattsson, 2004) and through a process approach, organizaitons can significantly cut costs and increase performance and quality, by
Teamwork is key in organizations with a process approach, since a process transcend functional barriers and even company borders. In this way a process view of the organization encompasses more activities and often of greater complexity (Ljungberg & Larsson, 2001). These aspects are especially true for the field of supply chain management. The problem of getting an integrated solution for customers and the delivering company, goes back to the functional organization, where separate companies in the supply chain can be seen as individual functions, trying to maximize their gain. With a process approach it is necessary for the organization to break through these problems to get the integrated colaboration over company lines that the supply chain concept aims to do (Mattsson, 2004).
In the process approach of an organization, the function has been transformed to competence and resource centers (Ljungberg & Larsson, 2001). Resource owners or line managers contributes with resources to the processes and a process owner has the responsiblity that the process is running smoothly (Ljungberg & Larsson, 2001). The processes should be managed as a system by creating and understanding the processes networks, their sequences and interactions (ISO 9004, 2009). The network can be described by a process map as a result of a process mapping.
3.2.1 Process Mapping
The first step towards a process approach of the organization is to map the processes within the company. Processes are specific to companies and vary depending on the type, size and the level of maturity of the organization in question. The second step is to determine all activities within each process, and adapt them to the size and the distinctive features of the organization (ISO 9004, 2009). Organizations often have been allowed to become more rampant and consequently harder to grasp. Often processes that have been developed logically have over the course of time been changed, often from an internal and functional limited perspective. With process mapping the link between the resources and the activities becomes more evident. (Ljungberg & Larsson, 2001)
Processes are normally divided into main processes, supporting processes and managing processes. The main processes are the most important processes for the organization, i.e. without any of the main processes the business stops working. The main process can also be defined as the processes that add value to the customer. The supporting processes purpose are to sustain the main processes and enable them to work properly; they do not add any value to the customer on their own, instead they are valued by their ability to support the main processes. The managing processes are managing and coordinating the main processes. Identifying the main processes is the first step to create a base for process oriented business development. (Ljungberg & Larsson, 2001)
From the three types of processes an abstraction of the organization can be acheived. The traditional organizational charts is still an artifact from the functional organization and does not give a true picture of the modern organization. The organizational chart shows more or less how the resources are divided and how the reporting path and power structure are built up. It does not show what really is performed and how collaboration works to serve the customers. The main processes show how the customers needs are fulfilled, and the companies employees roles becomes more clear and recognizable in regard to the customers’ needs. (Ljungberg & Larsson, 2001)
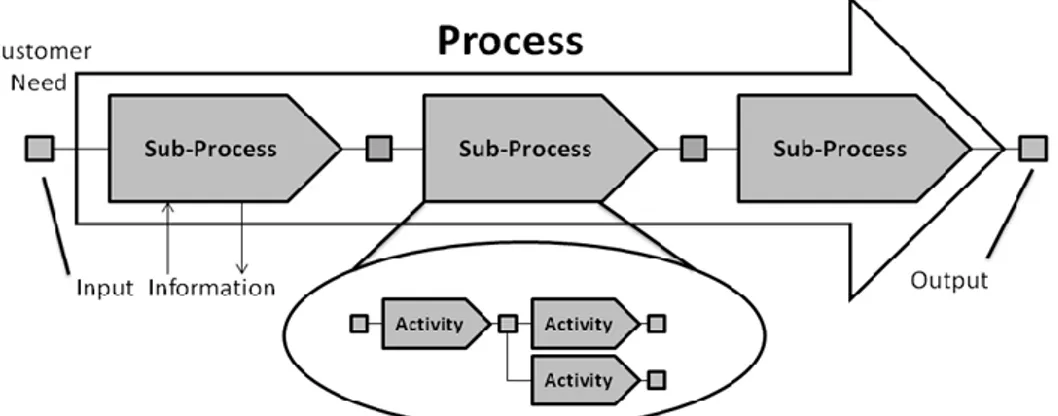
Processes are often represented as an arrow, with input that comes in and output that comes out, as shown in figure 3 below. The input and the output can be either physical producs, documents or actions from decisions taken by individuals. The activities in the process require resources and there is a continous exchange of information between the process and its environment. A process can be broken down either to activities or sub-processes, or to a part of a higher level process.
Figure 3. Process with sub-processes and activities (adaption from Ljungberg & Larsson, 2001, p 193)
There are different methodologies for conducting a process mapping.
Walk through is when the conductor of the process mapping physically follows the process flow and interviews the responsible person for each activity. (Ljungberg & Larsson, 2001)
A virtual walk through is done by gathering several representatives from the process and letting every representative explain their part of the process. (Ljungberg & Larsson, 2001)
Process design is used when there is no formal process to map, where individuals have had the ability to create his or her own path, which is often valid for smaller processes. The way to conduct this is to create a common picture of the process. (Ljungberg & Larsson, 2001)
A sub-process is often a part of a complex network of several processes. Mapping according to one of the mentioned methods can help make processes that have been kept invisible in the functional organization, visible. After the mapping the non-value adding activities can start being removed and the unnecessary snaky processes can be streamlined to meet the customers needs (Ljungberg & Larsson, 2001). In order to ensure that the processes and practices stay effective and efficient, the organization should have continuous practices that monitor, measure, analyze, review and report the performance of the processes for the sustainable effect of the process approach (ISO 9004, 2009).
3.3 Performance Measurement Systems
In the latest decades there has been a growing interest for performance measurement systems (PMS) and today it has been turned into a subset of the field of operational management. Companies have seen a growing demand for multi-dimensional measurements to evaluate their business. Traditional accounting has been criticized for encouraging short-term decision-making and its focus on external requirements makes it inapplicability to modern manufacturing techniques. (Bourn et al, 2003)
Measuring the organization does not only provide the ability to assess the performance of the organization. Deciding what to measure, how to measure and what the targets will be, are all acts which influence individuals and groups within the organization. Hence, performance measurement is an integrated part of the management planning and control systems. There is a wide range of performance measurement systems, based on multi-dimensional measures, developed and described in management literature, but the underlying basis for them can be very different. The differences lay in the procedure for how the measures are selected and also how the system is implemented. Below follows three types of procedures for a performance measurement system. (Bourn et al, 2003)
The need led procedure is a top-down approach where the customer, business and stakeholders needs are identified and used for the development of the performance measurments. The business progress is monitored against these sets of needs in the PMS. (Bourn et al, 2003)
The audit led procedure is more of a bottoms-up approach where existing performance measurements are auditied. The gathered information are used to challenge the status quo and used as a basis to improve the existing measures in a PMS. (Bourn et al, 2003)
The model led procedure uses a theoretical model of the organization for the design of the PMS. (Bourn et al, 2003)
3.3.1 Performance Measurement
Performance measurement can be defined as the process of quantifying the efficiency and effectiveness of actions taken in the organization. It is always necessary with a reference framework against which the efficiency and effectiveness can be judged and therefore a performance measurement is not relevant in isolation. In the past performance measurements have been criticized for judging performance against the wrong frame of reference. Today there is a widespread support for the belief that performance measurement and PMS should be developed from strategy. (Bourn et al, 2003)
The term key performance indicator is often used for the strategic performance measurement. The term has been widely adopted by practitioners. Parmenter (2007) states that there has been an growing missuse of the term and the meaning of it has been undermined. Permenter argues that performance measures need to be divided in three: key result indicators (KRI), performance indicators (PI) and key performance indicators (KPI).
Key Result Indicator - KRIs consists of generic measures that is aggregated from
many actions. Typical KRIs are for example customer satisfaction or return on working capital. These types of measures tells the general direction of the company, but not what is needed to do to improve the results. KRIs are not involved in the day-to-day management, however it is appropriate to present for the board. (Parmenter, 2007)
Performance Indicator - Performance indicators are what build up the KRIs and
consists of what is really being measured, but unlike the KPIs they are not key for the succes of the company. Among numerous of PIs, lays the KPIs. (Parmenter, 2007)
Key Performance Indicator - Parmenter (2007) define key performance indicators
as representing “a set of measures focusing on those aspects of the organizational performance that are the most critical for the current and future success of the organization”. Characteristics common in KPIs are that they often are non-financial measures which are measured continuously, daily or even with higher frequency. KPIs ties responsibility to induviduals or teams and should trigger corrective actions. Since the KPI’s are defined as key for the organization, improvement would have a great positive impact. (Parmenter, 2007)
3.3.2 The Balanced Scorecard
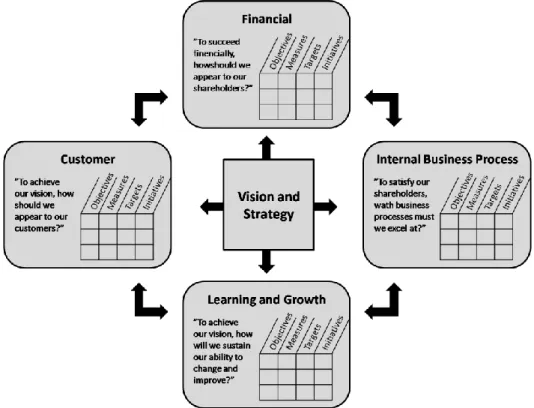
Kaplan and Norton (1996) developed a management system called the Balanced Scorecard (BSC), which is a multi-dimensional, need led performance measurement system. The BSC is designed to align assets and capabilities to the corporate strategy. The framework builds on financial measures, but it extends the traditional accounting model to include other measures to capture other
aspects of the organization’s activities. Kaplan and Norton have a view on organizational performance from four perspectives: financial, customer, internal business process and learning and growth perspective, which make up the basis of the scorecard framework, see figure 4. The objectives and measures of the scorecard are derived from an organization’s vision and strategy. With this setup the BSC clearly reveals the value drivers for long term financial and competitive advantage. (Kaplan & Norton, 1996)
Figure 4. The Balanced Scorecard Framework (adaption from Kaplan & Norton, 1996, p 9)
Financial Perspective - The balanced scorecard starts off with the financial
measures, which describes the tangible outcomes from the strategy. Traditional financial measures like return on investment and shareholder value are lag indicators that show whether the strategy is succeeding or failing. (Kaplan & Norton, 2004)
Customer Perspective - The customer perspective describes the value proposition
(Kaplan & Norton, 2004), that managers identify through targeting the customers and market segments where the company will be able to compete (Kaplan & Norton, 1996). The customer perspective measurements are often generic measures such as customer satisfaction and customer retention (Kaplan & Norton, 1996). What customers’ value is of great difference from industry to
industry and always changing over time, so consistent alignment of actions and capabilities with the customer value proposition is the core of strategic execution (Kaplan & Norton, 2004).
Internal Business Process Perspective - The internal business process refers to the
value chain of a company, which encompasses the innovation, the operations and the postsales service processes in a company. In order for the organization to create the value that the customers inquire, the few critical processes that have the greatest impact on strategy need to be identified (Kaplan & Norton, 2004). Traditional performance measurement systems have been focusing on improving existing departments and responsibility centers (Kaplan & Norton, 1996). With the BSC’s top-down approach, entirely new business processes can be revealed (Kaplan & Norton, 1996).
Learning and Growth Perspective - The learning and growth perspective identifies
the intangible assets most important to the strategy. In this perspective the human capital, the systems used or information capital and the corporate climate are all required to support the value-creating internal processes. These assets need to be compiled and aligned to the critical internal processes. (Kaplan & Norton, 1996)
The logic behind these perspectives can be drawn backwards from the financial measures. Financial targets can only be achieved through satisfied customers and the customer value proposition describes how the customers will be satisfied. The internal processes describe how the organization will create value to the customer. Intangible assets support the internal processes and provide the foundation for strategy alignment. In this way the BSC clearly can describe and visualize the cause and effect relationship of tangible and intangible resources and capabilities through to financial results. (Kaplan & Norton, 2004)
The BSC maps the strategy and forces the organization to clarify the logic of how it will create value and from whom. All processes in the organization should be managed well, but the few strategic processes must receive special attention and focus since these create the differentiation of the strategy. The art of strategy is to identify and excel at the critical few processes that are the most important to the customer value proposition. In this way the BSC framework is not only a performance measurement system, but also a strategic management tool. (Kaplan & Norton, 2004)
3.3.3 Supply Chain Performance Measurement
SCM practices have shown that efforts focused on carefully managing the supply chain can produce financial benefits for all participating firms in the supply chain. Improved performance does not come automatically, hence the importance to assess performance in SCM. (Gunasekaran, Patel & McGayghey, 2004)
Implementing a supply chain performance measurement system for the supply chain always starts off with mapping of main processes within the supply chain, to get higher granularity of the measures. The major processes can also be divided into levels, with corresponding metrics, to clarify appropriate levels of management authority and responsibility. One differentiation of levels is strategic, tactical and operational level. (Gunasekaran, Patel & McGayghey, 2004)
3.3.4 Factual Approach to Decision Making
One of the key benefits from implementing a PMS in an organization is the ability to make informed decisions, reinforced by data. Taking decisions based on analysis of data and information is called a factual approach to decision making. Applying this approach can increase ability to demonstrate the effectiveness of past decisions through reference to factual records and increase the ability to review, challenge and change opinions and decisions. Since it is hard to stay blind to raw data it will lead to correct taken decisions. (ISO 9004, 2009)
3.4 SCOR-Model
The Supply Chain Council is a consortium of close to 1000 members of companies that have developed a framework for supply chain systems, called the Supply Chain Operations Reference model (SCOR). SCOR is a process reference model for supply chain management, constructed with the basis of a need led procedure. The model spans from the supplier's supplier to the customer's customer as seen in figure 5 below.
Figure 5. SCOR span. (Supply Chain Council, 2008)
SCOR aims to take on an SCM perspective by providing a standardized language, standardized metrics, and common business practices which can be benchmarked between companies in the SCOR network. (Supply Chain Council, 2010)
The SCOR-model divides supply chain processes into five subtypes of processes: plan, source, make, deliver and return. These five processes are called the level 1 processes. Each level 1 process consist of a set of level 2 processes, for example a
sourcing process can be one of the three level 2 processes: source stocked product, source make-to-order product or source engineer-to-order product. The level 2 processes can further be broken down to a third level.
3.4.1 Implementing the SCOR Methodology (Harmon & Business
Process Trends, 2003)
To set up a supply chain based on SCOR, the Supply Chain Council has established a SCOR Project Roadmap, which can be seen as a methodology. Paul Harmon & Business Process Trends (2003) have extended this methodology in order for using companies to define the existing supply chain in line with the SCOR methodology. Paul Harmon suggests six phases of implementing the SCOR methodology:
0. Review Corporate Strategy I. Define the Supply Chain Process
II. Determine the Performance of the Existing Supply Chain III. Establish the Supply Chain Strategy, Goals and Priorities IV. Redesign the Supply Chain as Needed
V. Enable Redesign and Implement.
0. Review Corporate Strategy
This is not much of a phase as it is a commitment and a decision to undertake a supply chain strategy review to improve the existing supply chain performance. If the company is new to SCOR it is necessary to work through phase I and II.
I. Define the Supply Chain Process
The first phase is an analysis of the existing supply chain. SCOR provides a common vocabulary and a notion system for defining the major processes, starting with the level 1 processes. Once the level 1 processes are mapped, the analysis can dig deeper into the second level. When defining the supply chain process it is often sufficient to map down to the second level of processes, but if there still is further insecurities, mapping the third level for some processes can be necessary.
II. Determine the Performance of the Existing Supply Chain
Starting at phase II, when the processes are mapped, the existing supply chain can start getting measures to evaluate the existing performance.
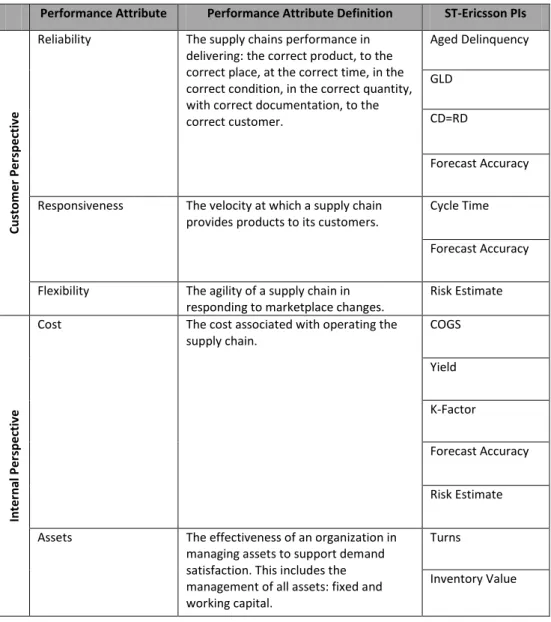
SCOR has defined five generic performance attributes and three levels of measures that can be used. These attributes is divided into an internal and a customer faced perspective, see Table 1.
Using the SCOR generic measures enables the company to benchmark the supply chain performance to the relevant industry. Once some historical data is gathered the management needs to decide how the supply chain is to be changed.
Table 1. SCOR Performance attributes (Paul Harmon & Business Process Trends, 2003, p 8)
Performance Attribute
Performance Attribute Definition Level 1 Metric
C u sto me r F ac in g
Reliability The supply chains performance in
delivering: the correct product, to the correct place, at the correct time, in the correct condition, in the correct quantity, with correct documentation, to the correct customer.
Delivery Performance Fill Rates
Perfect Order Fulfillment
Responsiveness The velocity at which a supply chain
provides products to its customers.
Order Fulfillment Lead Times
Flexibility The agility of a supply chain in responding
to marketplace changes.
Supply Chain Response Time Production Flexibility In te rn al F ac in g
Cost The cost associated with operating the
supply chain
Cost of Gods Sold Total SCM Costs
Value-Added Productivity
Assets The effectiveness of an organization in
managing assets to support demand satisfaction. This includes the management of all assets: fixed and working capital.
Cash-to-Cash Cycle Time Inventory Days of Supply Asset Turns
III. Establish the Supply Chain Strategy, Goals and Priorities
The SCOR attributes provide a good understanding of the strength and the weakness of the supply chain. From phase 0 an organizational plan and the corporate strategy are established, that now can be compared with the supply chain performance to set a supply chain strategy.
From the performance attributes SCOR suggest that the company decides where the supply chain should be superior, have advantage, parity or be below industry average. The company’s supply chain cannot be expected to be superior in every category, but it should be very good in at least one or two. The categories the company chooses to put their efforts in to becoming superior should reflect the supply chain strategy, which relates to the corporate strategy. With the
competition model presented in Table 2 the company can get a picture of the As-Is situation and what is necessary to reach the To-Be situation.
Table 2. Competition Model for the supply chain performance (Paul Harmon & Business Process Trends, 2003, p 10)
Competition Model
Performance attributes Performance versus Competition As-Is To-Be Reliability Responsiveness Flexibility Costs Assets
X Superior O Average o Parity
IV. Redesign the Supply Chain as Needed
SCOR provides a number of tools for redesigning the supply chain. By examining the sub-processes down to the third level, the company can benchmark the best practices within the processes on a detailed level.
V. Enable Redesign and Implement
The last phase is enabling and implementing the supply chain strategy, using software and human performance improving techniques. Then data must be gathered to determine if the supply chain is meeting the set targets.
3.5 Theoretical Summery
From the theory on supply chain management, process management and performance measurement, SCOR provides a framework on how to organize the supply chain according to a deliberate strategy which draws back from the customer. The balanced scorecard set the SCOR-model in an outside-in context of the whole organizations activities. The BSC explains how the separate parts of the organization comes together to provide a value proposition to the customer, expressed from the corporate vision and strategy. This is done by using a performance measurement system that measures the performance of the different perspectives. The internal perspective advocates measuring the value chain according to a process view and the supply chain is a subset of the value chain.
All theories stress the importance of measuring the performance to enable improvements and alignment with strategies. The SCOR methodology enables an
4 Introduction to ST-Ericsson’s Supply Chain
The supply chain in the semiconductor industry is known to be very complex. Therefore this chapter will provide a background to the production processes together with background on supply chain business models.
4.1 Production Process
The hardware of a mobile phone platform is composed of a set of integrated circuits, the core ones being part of the chipset. The chipset are composed of applications specific integrated circuits (ASIC) or application specific standard products (ASSP), typically split up into radio frequencer, baseband and power management devices/chips. All of these are silicon chips (or die), which are encapsulated with a protecting compound material. The production up until the silicon die is called Front-end production and encapsulating and testing the die is called Back-end production. The whole production process can be divided in four production steps, two in Front-end and two in Back-end: Diffusion, Electrical Wafer Sort (EWS), Assembly and Test & Finishing (see figure 6). All these processes can be done in different locations, and in ST-Ericsson’s case are located worldwide. This allows for several Back-end production facilities that can serve different markets.
Wafer production (or Diffusion) is production of silicon wafers. Silicon cylinders are sliced into wafers, which is a silicon disc much like an LP-disc in size. 25 wafers is one lot in production and the smallest amount to start production. Through a series of production steps the circuits is created on the surface of the wafer. Depending on the product specifications and the production technology, each wafer consists of 1000-5000 dice and every die consist of up to 1 billion transistors. Hence, the lead-time for Diffusion is very long, everything from 8-20 weeks. In the Electrical wafer sort, chips on the wafer are tested and then sawed into dice. The lead-time for EWS is a few days up to one week with transfers. In the Assembly process the dice is encapsulated and in the Test & Finish process - tested again and prepared for transport and delivery with final marking. The whole Back-end process lead-time is about 10-14 days.
The total lead-time for the hardware production is very long, depending on the type of product, process technology and the manufacturing facilities the lead-time can be up to half a year, which of the greatest part of the time is spent in the Front-end production. Every step of the production has its own identity and for every possible production route in different plant creates unique products. This means that there is not a single code defining what is sold to the customer, there
is possibly 20 codes defining products in every production step belonging to the same commercial product.
Since ST-Ericsson is fabless, it does not have its own production, which instead is handled by ST or external production foundries that ST or ST-Ericsson outsources to. ST-Ericsson naturally uses ST’s supply chain infrastructure to a great extent to take advantage of scale benefits and competences in SCM.
4.2 Supply Chain Business Model
ST-Ericsson has several different supply chain business models towards its customers. Two of the most common, which are used by L3M, is presented in figure 6.
The first model is a traditional order system, where the customer places orders and ST-Ericsson delivers to the customer in accordance with a committed delivery date (CD). Order lead-time is 4 to 16 weeks. The order lead-time can be different from customer to customer, depending on the contract.
Figure 6. Production steps and delivery according to the two supply chain business models (adaption from internal document)
The second model is a consignment model, where ST-Ericsson has a vendor managed inventory (VMI) placed at the customer. The customer takes the products from the stock at any time, which is registered automatically by
ST-Ericsson and the customer is invoiced. ST-ST-Ericsson is obligated to keep the stock between a minimum and maximum level.
Since the lead-time for production is so long ST-Ericsson has to start production based on forecasts. Generally Back-end production is started when a real order is placed. To trigger production ST-Ericsson uses internal orders, which are replaced by the real orders once they are placed.