A
BSTRACT
Title: Trading strategies with market impact constraints
– A case study at SEB
Authors: Martin Martinsson I-02
Gustaf Tegell I-02
Supervisors: Ingela Elofsson, Department of Production Management
Thomas Guhr, Department of Mathematical Physics Rudi Schäfer, Department of Mathematical Physics
Practical Supervisors: Christer Wennerberg, SEB Merchant Banking
Anders Mårtensson, SEB Merchant Banking
Research purpose: Purpose of the master thesis is to develop an algorithmic trading
model for a single asset, which is well functioning on the Scandinavian market.
Deliverables: The main focus has been towards creating an indicating model to
quantify market impact, cost of trading and model an efficient trading frontier.
Methodology: Initially we focused on research papers and literature within our
specific field trying to get a deeper knowledge in related theories. Further we had meetings with our project initiators to understand their ambitions with the project. This helped us to formulate the direction of our thesis.
After broad theoretical studies we started to evaluate different models that are used to quantify market impact and efficient trading. We understood that there is not a general model that is used to quantify these values. At this point we were able to decide on certain models to approach and which simplifications that had to be done. We decided to use the theoretic framework for a market impact model created by US researchers.
Finally we compiled all research and data into our master thesis. We also had several meetings with experienced individuals from the stock market to discuss the validity of our models that we had developed. In the end we delivered a clear theoretical framework and a model that is simple to use.
Conclusions: Based on cutting edge research in financial trading theory
combined with discussions with traders on the Scandinavian market a pre trade analysing application has been created. The application is today usable to facilitate the decision-making process when minimizing cost at a desired risk level for a large stock order. The application provides the user with cost and risk
estimates. Additional information on how to liquidate the initial portfolio and anticipated market participation is supplied to the user. The information provided by the application is realistic according to experienced professionals.
.
However manual trading can not be completely replaced. Several orders are of such kind that algorithms are not capable of executing these. Further a good trader takes much information into consideration when trading not possible to capture in algorithms. The conclusion is that traders and algorithms should work side by side to maximize profit. Standardized orders are handled by automatized trading systems allowing traders to focus on more complex orders.
Keywords: Market Impact, Pre Trade Analysis, Timing Risk, Optimal Trading
Trajectories, Trading, Expected Cost, Variance of Cost, Temporary Market Impact, Permanent Market Impact.
O
UTLINE
:
Chapter 1: The purpose of this chapter is to give the reader an objective view
of SEB’s business, organisation, market position and strategy.
Chapter 2: In this chapter we clarify the background which explains the
purpose of the master thesis.
Chapter 3: The purpose of this chapter is to give the reader an insight in the
scientific approach of this master thesis.
Chapter 4: The ambition of this chapter is to give the reader a deeper
knowledge of certain theoretical theories.
Chapter 5: The development of a useful model is described to the reader in
this chapter.
Chapter 6: The aim of this chapter is to develop and explain the application
based on model 1 and model 2.
Chapter 7: In the following chapter a result summary is presented to give the
reader an example of how to utilize the application. Further how well the research purpose is fulfilled is concluded.
Chapter 8: Our recommendations how to benefit the most from the results
found in our research are described and discussed in the following chapter. Further we make recommendation how SEB can take algorithmic trading to the next level.
P
REFACE
This master thesis has been a project at SEB Enskilda in Stockholm during the fall of 2006. The main objective of the thesis has been to develop a model that is used for algorithmic trading. It will contribute when trading large volumes of stocks as a pre trade analysis tool and a sales explanatory tool to customers.
Our time at SEB Enskilda has given us great experiences from professional work environment as well as great practice to be part of a project.
Finally, we want to thank all people that has been involved and contributed to this thesis. Our supervisors at SEB Christer Wennerberg and Anders Mårtensson for their real data input, research material and interesting discussions. Further our supervisor at Lund Institute of Technology Ingela Elofsson for her great attitude and remarkable advices. At last, our mathematical support from Lund Institute of Technology, Professor Thomas Guhr and Doctor Rudi Schäfer, who guided us through parts of the hard mathematical framework.
Stockholm January 2007,
Gustaf Tegell Martin Martinsson
C
ONTENTS
ABSTRACT... 1 PREFACE... 6 CONTENTS... 8 1.INTRODUCTION... 10 1.1 SEB in brief... 10 1.2 Vision ... 11 1.3 Organisation ... 121.4 SEB Merchant Banking... 12
2.BACKGROUND &PROBLEM DISCUSSION... 14
2.1 Background ... 14
2.2 The stock market ... 14
2.3 Algorithmic trading ... 15
2.4 Purpose ... 15
2.5 Target Group ... 15
3.METHODOLOGY... 16
3.1 Introduction ... 16
3.2 Different scientific approaches... 16
3.3 Data gathering ... 17 3.4 Data types... 18 3.5 Reliance of research ... 18 3.6 Investigation approaches ... 19 3.7 Practical approach ... 19 4.THEORETICAL BACKGROUND... 22
4.1 Pre trade analysis... 22
4.2 Market impact ... 22
4.3 Transaction costs ... 26
4.4 Optimal trading strategies ... 27
4.5 Existing market impact models ... 28
4.6 Summary of the theoretical model ... 31
5.CREATING A USEFUL MODEL... 32
5.1 Model distinction... 32
5.2 Model 1: Nonlinear Market Impact... 32
5.3 Model 2: Linear impact with optimized trading trajectories... 37
5.4 Summary of model creation ... 39
6.DEVELOPMENT OF AN USER FRIENDLY APPLICATION... 40
6.1 Application interface ... 40
6.2 A graphical interface-Model 1 ... 41
6.3 A graphical interface-Model 2 ... 42
7.RESULTS SUMMARY &CONCLUSIONS... 45
7.1 Introduction ... 46
7.2 Model 1-Non linear market impact ... 46
7.3 Model 2-Linear impact with optimized trading trajectories... 48
7.4 Conclusions ... 48
8.RECOMMENDATIONS AND DISCUSSION... 50
8.1 How SEB can use the models ... 50
8.2 Practical recommendations of implementation ... 50
8.3 Model improvements... 51 8
8.4 Academic contribution ... 52 9.BIBLIOGRAPHY... 53 Scientific Articles... 53 Literature ... 53 Electronic Sources... 53 Oral Sources ... 54 9
1.
I
NTRODUCTION
The purpose of this chapter is to give the reader an objective view of SEB’s business, organisation, market position and strategy.
1.1 SEB in brief
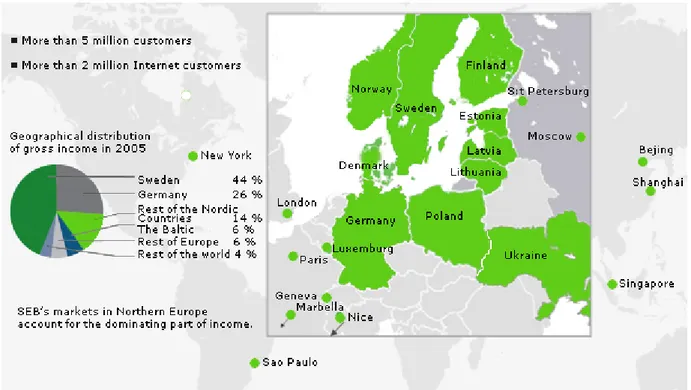
Skandinaviska Enskilda Banken (SEB) is a North-European retail and investment bank. SEB was founded 1972 through a merger between Stockholm’s Enskilda Bank (founded 1856) and Skandinaviska Banken. Their customers are institutions, corporations and private individuals. The head office is located in Stockholm although SEB is represented in 20 countries around the world with more than 20 000 employees. SEB has more than five million customers in northern Europe and in other important financial locations. They have an international business with 50 per cent of the profit generated outside Sweden. SEB has a significant position on the North European retail market with a 16 percent market share in Sweden and 30 percent market share in the Baltic countries. The bank has a great reputation in the financial sector with top rankings in areas as equity research, cash management and private banking. 2005 SEB had an operating profit of 11 223 MSEK and the SEB share is listed on the OM Stockholm Stock Exchange1.
Figure 1.1 SEB market locations and geographical distributions2
1 http://www.sebgroup.com/pow/wcp/sebgroup.asp?website=TAB1&lang=en 2 Ibid.
1.2 Vision
SEB has made many strategic moves since the merger in 1972. The competition in the financial industry has become more significant. The vision of becoming the leading North-European bank has demanded several acquisitions to strengthen the bank within life insurance and asset management. As the number of customers has increased in other European countries SEB has expanded mainly in Germany and Eastern Europe. The large expansion resulted in the 3 C-programme
(Cost efficiency, increased Customer satisfaction and Cross-servicing within the Group) which purpose is to reach full potential of the acquisitions and mergers3.
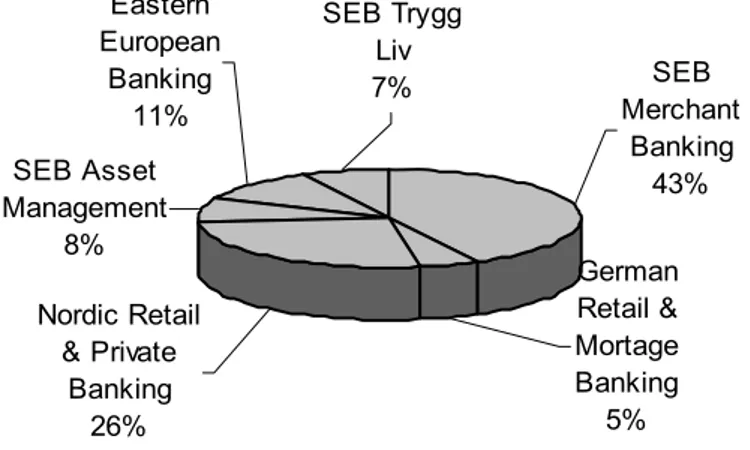
SEB Asset Management 8% Eastern European Banking 11% Nordic Retail & Private Banking 26% SEB Merchant Banking 43% German Retail & Mortage Banking 5% SEB Trygg Liv 7%
Figure 1.2 Operating profit per division 2005
Figure 1.3 Strategic development of SEB4
The business concept of SEB is to have satisfied customers and to give investors a competitive return. Further more SEB aims to be considered as a good citizen of society. By providing attractive financial solutions and by local market knowledge SEB aims to achieve these goals.
More precisely the vision of SEB is:
“SEB shall be the leading North-European bank in terms of customer satisfaction and financial performance. Motivated employees and strong cooperation within the Group “One SEB” are prerequisites for reaching the goals5.”
3 http://www.sebgroup.com/pow/wcp/sebgroup.asp?website=TAB1&lang=en 4 Ibid.
5http://www.seb.se/pow/wcp/sebgroup.asp?website=TAB1&lang=en
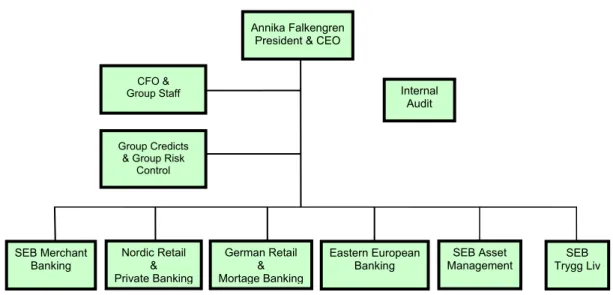
1.3 Organisation
To meet the needs of a competitive financial market the organisation of SEB has seen a dramatic transformation over the last years. The organisation is divided into six different divisions where SEB Merchant Banking is the largest division with 42% of the total operating profit. This master thesis is within the Merchant Banking division as it is in charge of all stock trades. Today Marcus Wallenberg is Chairman of the Board and Annika Falkengren is CEO for Skandinaviska Enskilda Banken6.
SEB Merchant Banking Nordic Retail & Private Banking German Retail & Mortage Banking Internal Audit Annika Falkengren
President & CEO
Group Credicts & Group Risk
Control CFO & Group Staff Eastern European Banking SEB Asset
Management Trygg LivSEB
Figur 1.4 Organisation of Skandinaviska Enskilda Banken7
1.4 SEB Merchant Banking
SEB Merchant Banking is the division that is responsible for large and medium sized corporations, financial institutions and commercial real estate clients. This division consists of two business units; SEB Merchant Banking and Enskilda Securities.
SEB Merchant Banking offers financial services. They have main responsibility for the relationship with SEB’s large and medium size customers. They trade all different kinds of financial instrument e.g. currencies, bonds, derivates, futures and stocks. Merchant Banking also has a number of advisory, venture capital custody services and other financial services that large and medium size customers demand. SEB Merchant Banking is the largest division of SEB and has reported stable and good results for several years. It has about 2 800 employees in thirteen different countries.
Enskilda Securities is SEB’s investment bank that offers corporate finance services, equity trading and equity research. They have a strong market position on the Nordic market and
6 http://www.sebgroup.com/pow/wcp/sebgroup.asp?website=TAB1&lang=en 7 Ibid.
have also had high rankings in different surveys the last years. Enskilda has about 420 employees in seven different countries.
Both business units trade large volumes of stocks that can affect market equilibrium. Therefore they have a great interest in algorithmic trading and trading strategies for large volume trading which will make their trading more efficient8.
8 http://www.sebgroup.com/pow/wcp/sebgroup.asp?website=TAB1&lang=en
2.
B
ACKGROUND
&
P
ROBLEM DISCUSSION
In this chapter we clarify the background which explains the purpose of the master thesis
2.1 Background
Skandinaviska Enskilda Banken (SEB) is today one of the largest players on the Northern European market for retail and investment banking. A key competence is to deliver competitive stock trades. Since the IT revolution the stock market has become an exceptionally efficient and fast moving market. Most stock trades executed by SEB are not large enough to affect the market. There are trades though, that are of such volume that they actually have a market impact. These trades are related to specific strategies which aim to minimize cost and risk for the trade. Traditionally brokers with great experience from the market execute these orders based on their knowledge and experience. If trading is executed during a short time period there will be a large market impact but the broker will not experience a risk that the stock moves in an unfavourable direction. On the opposite trading over a long time period results in a small market impact but a large risk of market movement. Therefore it is of great interest to SEB Merchant Banking to clarify the characteristics of large volume trades and how to execute these efficiently9.
2.2 The stock market
The Scandinavian stock market has in the past been dominated by a few large brokers. These players have had a relative comfortable market position since the relationship between customer and broker has been based on a good relationship. Further more, not many actors have had direct access to the stock market, which has enabled the broker to charge high commissions and fees. Usually the communication between customer and broker has been through telecommunication related with a time consuming order process.
Since the expansion of information technology the stock market has seen remarkable changes. Many new brokers have now gained access to the market. These players compete with lower fees and direct access to the market for the end user. The new brokers focus preliminary on small investors with standardised trades.
However, these brokers constantly develop their trading applications with the result of larger market shares. The original brokers have lost their monopoly of stock trading and today focus more and more on large and unique trades.
A market is driven by supply and demand, especially the stock market since it is distinguished by many players and an efficient technology which results in a fast moving market. Today most trades do not affect market equilibrium as the volume of these trades are not large enough. However there are trades that have an impact on the market equilibrium. Depending
9 Christer Wennerberg, SEB Merchant Banking, Stockholm 2006-09-15
on the size of the trade as well as the liquidity of the stock, the market can be temporarily or permanently affected10.
2.3 Algorithmic trading
Algorithmic trading is a tool which uses predefined strategies to facilitate the decision making for a trader. The algorithm uses a model which can be a simple or complex application depending on transaction form. The information technology revolution has developed the usage of algorithmic trading. As mentioned earlier most trades today are done manually, many of these can in the future be executed through automatic trading systems.
SEB has a great interest in building strategies for execution of trades when dealing with large volumes of stocks. The strategies are related to different risks. Therefore SEB would like to quantify the risks related to each trade. Due to the relationship between risk and cost a strategy can be defined that takes both these interests into consideration11.
2.4 Purpose
Purpose of the master thesis is to develop an algorithmic trading model for a single asset, which is well functioning on the Scandinavian market.
2.5 Target Group
The target of this master thesis is primarily two groups, professional people working in the financial industry and students studying financial mathematics:
In the financial industry it is of interest for traders at the Scandinavian Stock Market, professionals working in the business development division and for sales people in the financial industry.
Students studying financial mathematics can read this to understand the basics of market impact, costs of trading and timing risk.
10 Johan Larsson, SEB Enskilda Equities, Stockholm, 2006-12-05 11 Anders Mårtensson, SEB, Stockholm, 2006-09-05
3.
M
ETHODOLOGY
The purpose of this chapter is to give the reader an insight in the scientific approach of this master thesis.
3.1 Introduction
When doing a scientific research it is important to have a structure in the investigations. Several methods how to target the purpose of the research are available. Numerous important circumstances have to be addressed before choosing which method to use. Additionally the purpose or problems investigated in the survey are important factors for which method to use. The choice of method is very dependent on which knowledge is available12.
3.2 Different scientific approaches
3.2.1 Problem identifying
The first issue when investigating an unknown field is to explore the theoretic framework. When the big picture of the issue is understood a framework of the problem can be stipulated. The first exploration of the subject often results in a deeper research to fully describe or explaining the issues13.
Often the purpose of this investigation is to identify a problem from previous premonitions. From this investigation a hypothesis is formulated.
3.2.2 Descriptive, explanatory, diagnostic and normative studies
When the theoretic framework is well known a purpose for the study is to describe rather than understand the problem. The description of the problem varies depending on the utilization of the study. A description of past events as well as present events may be of interest. Further the reasons and relationship between occurrences may be the prime identification target14.
Besides describing the issues an additional purpose may be to explain these. The depth of the explanation study can vary. An overview of the issues is sometimes sufficient as well as an in depth analyse may be required. The purpose is to identify and analyse the factors that affect the occurrences of interest. Often these studies evaluate previous theories. Frequently this information is used to determine strategies in situations where the factors identified are in use15.
A diagnostic investigation uses occurrences to establish the driving factors behind the results. The method starts with the results and tries to find solutions to these occurrences. Often a negative outcome of a strategy results in a diagnostic investigation16.
12 Utredningsmetodik för samhällsvetare och ekonomer. Lundahl, Ulf and Skärvad, Per-Hugo, p. 7-16 13 Utredningsmetodik för samhällsvetare och ekonomer. Lundahl, Ulf and Skärvad, Per-Hugo, p. 55 14 Utredningsmetodik för samhällsvetare och ekonomer. Lundahl, Ulf and Skärvad, Per-Hugo, p. 48 15 Utredningsmetodik för samhällsvetare och ekonomer. Lundahl, Ulf and Skärvad, Per-Hugo, p. 47 16 Utredningsmetodik för samhällsvetare och ekonomer. Lundahl, Ulf and Skärvad, Per-Hugo, p. 48
A normative investigation makes statements that describe how outcome for certain actions are17. The investigation is similar to making case recommendations and what the outcome for each action is. The purpose is to be able to make a recommendation on what action to take18.
3.2.3 Our scientific approach
The approach in our thesis is a combination of describing the phenomenon of market impact and to explain this occurrence. Additionally the problem is of a diagnostic nature. All research started as diagnostic investigations to an occurrence experienced on the stock market, resulting in a framework of theory in the subject.
Traders at SEB have experienced market impact and have intuitions of why this happens. Further the project initiators at SEB have a general idea of the driving factors of the occurrence. The theory is today widely discussed but no straight forwards solutions exist. Our approach is to give a deep description and explanation of the today existing theoretical framework.
3.3 Data gathering
3.3.1 Written sources, interviews, surveys and questionnaires
Written sources are articles, books and research papers which all are examples of secondary data19.
An interview with experienced people is a central method of the qualitative study to gather primary data.
A survey20 is a way of collecting primary data that could be used to describe a current
situation. Surveys can be done market researches, voter surveys, and attitude researches. Data that is collected in a survey is of quantitative character. Parts of a population are examined and used to represent the rest of the population.
If a large number of people are asked a questionnaire is an easier approach to receive al large number of data.
3.3.2 Our approach of data gathering
Data are gathered from different sources; initially we read different research papers and books to get a better knowledge in the subject. SEB’s intranet has been used to collect information about SEB in general. Additional interviews have given us a qualitative approach to our survey.
17 http://en.wikipedia.org/wiki/Normative
18 Utredningsmetodik för samhällsvetare och ekonomer. Lundahl, Ulf and Skärvad, Per-Hugo, p. 237 19 Utredningsmetodik för samhällsvetare och ekonomer. Lundahl, Ulf and Skärvad, Per-Hugo, p. 52 20 Utredningsmetodik för samhällsvetare och ekonomer. Lundahl, Ulf and Skärvad, Per-Hugo, p. 168-182
3.4 Data types
3.4.1 Primary or secondary and quantitative or qualitative data
Data that is collected by the researchers for a specific purpose is referred as primary data21. Data that already exists and collected by other researches is secondary data.
In research there is a difference between quantitative and qualitative method. In a qualitative study the vital part is verbal whereas a quantitative study is from measurable data and is used to evaluate specific models. Qualitative data is often from a personal interview and quantitative is measures from nature22.
3.4.2 Our data types
To deduct best possible survey we have used both quantitative and qualitative data. Our quantitative survey is done based on a database from Stockholm Stock Exchange. Interviews done at SEB Enskilda are used in the qualitative study where a specific questionnaire is used to evaluate our hypothesis. The data collected from interviews and database is both sources of primary data.
3.5 Reliance of research
3.5.1 Validity, Reliability and Objectivity
The level that the researchers have been able to investigate their research problem is often referred as validity. Further the validity is a measurement of how well the intended measurement is measured. Additionally validity is said to be the correlation of the theoretic definition and the real life definition23.
Reliability refers to the precision and exactness of a measuring tool. The result of the measurement tool should give the same result regardless of whom and under which circumstances it is executed. The measurement tool should not have a random measurement deviation and should decrease the stochastic deviation24.
It is important that a scientific study is objective and personal values of the authors do not influence and affect the real data and the questions asked. The level of objectivity of the research means the involvement of the authors25.
3.5.2 Reliance of our research
Since the theoretic definition of market impact is how much the price is affected by an order and the real life measurement is directly observed the validity between theory and practice is
21 Utredningsmetodik för samhällsvetare och ekonomer. Lundahl, Ulf and Skärvad, Per-Hugo, p. 145 22 Utredningsmetodik för samhällsvetare och ekonomer. Lundahl, Ulf and Skärvad, Per-Hugo, p. 183 23 http://sv.wikipedia.org/wiki/Validitet
24 Utredningsmetodik för samhällsvetare och ekonomer. Lundahl, Ulf and Skärvad, Per-Hugo, p. 152 25 Utredningsmetodik för samhällsvetare och ekonomer. Lundahl, Ulf and Skärvad, Per-Hugo, p. 74-75
high. Our investigation results in a quantitative measurement of stock price concession thus answer the theoretical question.
A model can not fully describe real life thus our predicted market impact will deviate from experienced in the market. However the model will give the same results independent of by whom and when it utilized. Unfortunately the model can not be statistically evaluated due to lack of correct data. Our evaluating is based on discussions with experienced stock traders in order to se if the models are reasonably accurate. The purpose of SEB is not to get an exact measurement but an indication for the trade off between market impact and timing risk.
Since we do not have hands on experience from market impact orders no preconceived notions of the end results are made. Further SEB, as the end user of the results, are interested in manage market impact in the most efficient way. They are very keen to get estimates of the real costs not a refined estimate. As a result no pressure to improve the results has been made. However interviews with traders may be affected by their personal experience but should not influence the quantitative results.
3.6 Investigation approaches
3.6.1 Induction, deduction and verification approaches
An inductive approach explores the environment to create a model or theory26.
A deductive approach uses an already existing theory or model to draw certain conclusions for specific events27.
Verification is used to confirm the result of an investigation28.
3.6.2 Our investigative approach
In our master thesis we use a deductive approach. We have collected our empirical data from an already existing database. Models we use have their background in already existing theory from scientific papers and literature. From data and theory we have been able to draw certain conclusions.
3.7 Practical approach
Initially we focused on research papers and literature within our specific field trying to get a deeper knowledge in related theories. Further we had meetings with our project initiators to understand their ambitions with the project. This helped us to formulate the direction of our thesis.
26 Utredningsmetodik för samhällsvetare och ekonomer. Lundahl, Ulf and Skärvad, Per-Hugo, p. 41 27 Ibid.
28 Ibid.
After broad theoretical studies we started to evaluate different models that are used to quantify market impact and efficient trading. We understood that there is not a general model that is used to quantify these values. At this point we were able to decide on certain models to approach and which simplifications that had to be done. We decided to use the theoretic framework for a market impact model created by US researchers.
In chapter 4 the theoretical framework of efficient trading and trading strategies is stipulated. Simplifications are necessary to use the framework in real life. Since there is not enough real data available to estimate the functions as well as the constants to the Swedish market we have to rely on the research done on the US market. To use their estimates of the functions and constants we us the same values and create a model to the Swedish market.
Because of the complex mathematical framework we had several discussions with our supervisors from Lund Institute of Technology in order to create possible and well working models. A limitation in the model estimation had to be done due to lack of sufficient data. We have continuously been in contact with SEB in order to develop the project in the right direction. Additional we have had several meetings with experienced individuals from the stock market to discuss the validity of our models.
4.
T
HEORETICAL
B
ACKGROUND
The ambition of this chapter is to give the reader a deeper knowledge of certain theoretical theories.
4.1 Pre trade analysis
The last years increase in competitiveness on the financial markets has improved the algorithmic trading activity. A pre trade analysis provides investors with liquidity summaries, cost & risk estimates and trading difficulty which will give them an insight if algorithmic trading is of interest for the specific trade. Not all orders can be handled by algorithms thus requires manual execution, e.g. a stock that is very illiquid is very hard to design an appropriate algorithm for. The idea of a pre trade analyses is to give the trader as much information as possible to develop the best strategy for the trade. Depending on the purpose of the trade there are different strategies to be chosen29.
An essential factor in trading performance is to use a benchmark price. There are different benchmark prices which can be categorized into pre-, intra- and post prices. Pre trade prices are known before the time of trading and are often referred to as implementation shortfall benchmark prices. The most common are the investment decision price, previous night’s closing price, opening price and price at time of order entry. Intra day price benchmarks are decided throughout the trade, such as volume weighted average price (VWAP), high and low. The post trade benchmarks are known after the trade has been executed. The most common is the day’s closing prices30.
Different investors use the benchmark price that best is coherent with their strategy. An investor using fundamental analyses may want to use the price at decision time, e.g. the investor’s belief of the true value of the stock. An investor following the index may be interested in VWAP execution31.
When the benchmark price is chosen the next step is to find the optimal strategy for a specific trade. This is often referred to as the trader’s dilemma. When deciding the optimal strategy it is necessary to be aware of the costs and risks of the trade. After the trade is carried out it is essential to do a post trade analysis to evaluate the algorithm and traders performance. The cost of a trade is the difference between the benchmark price and the actually received price. A post trade analysis is essential to evaluate the model as well as the trader. If the actual cost largely deviates from the pre trade estimates the model or the trader needs to be questioned32.
4.2 Market impact
Price movement of a stock is affected by several variables, usually divided into macro and micro factors. The macro aspects are e.g. the business cycle, the oil price, political situations and many more. The micro factors are the factors related to the specific stock, such as specific
29 Understanding the profit and loss distribution of trading algorithms, Kissel & Malamut, page 2 30 Ibid.
31 Ibid. 32 Ibid.
company events. The price movements of the stock caused by a single trade or order are called market impact.
Due to the many factors that may cause stock movements it is hard to distinguish when market impact has occurred. Market impact affects a buyer and seller in different directions, a seller is affected from decreased prices and a buyer from increasing prices33.
Market impact of an order is often measured as the difference between the stock price at the beginning of the trade and the average received price for the order. A problem with the measurement is that all market activities are accumulated in the price movement. The measurement is actually the total trading cost comprising the stock’s natural movements, volatility as well as the market impact of all orders. To be able to use the measurement as market impact an assumption that all other activities are normal occurrences is made. Market impact is therefore fundamentally caused by supply and demand imbalance and information leakage.
4.2.1 Supply-demand imbalance
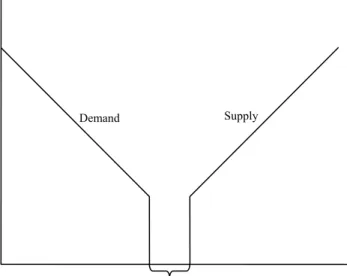
If the market is in equilibrium any additional order will result an imbalance in the supply and demand equilibrium. Market impact is somewhat driven by basic microeconomics, supply and demand theory. Every time an investor enters an order, either demanded shares or supplied shares, to the market there is change in equilibrium. If there is a difference between the bid and offered price the investor has to attract their counterparties to do the trade, through paying a premium compared to the spread causing the price to move. Figure 4.1 describes supply and demand in a stock market34.
Supply and demand imbalance – the spread Supply Demand
Figure 4.1 Supply and demand in a stock market35
33
Optimal Execution of Portfolio Transactions, Almgren, Robert and Chriss, Neil, page 8
34 Anders Mårtensson, SEB, Stockholm, 2006-09-05 35 Ibid.
4.2.2 Information leakage
Every order that is released to the market expresses information relating to the trade and the specific stock. Investors communicate information to the market concerning its current and future expectations of the stock price through their order size and characteristics of the order. Unusual behaviours often start rumour, which concerns every market participant interested in this specific stock resulting in a chain reaction in supplied and demanded quantity of the stock.
4.2.3 Temporary market impact
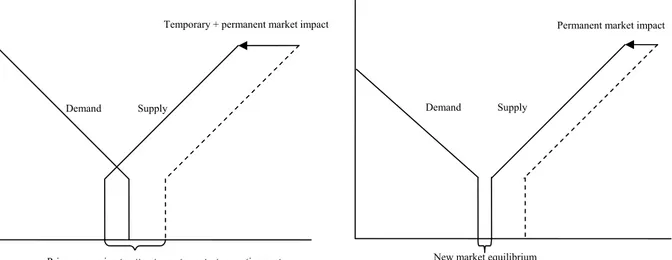
Temporary market impact occurs whenever an order is released to the market affecting the equilibrium but is not providing essential information changing the market behaviour or valuation for the specific company. A common description of market impact for a buy order is that an investor triggers a price increase and buys at a higher price followed by a price decline post the trade. Thus temporary market impact is a short lived disturbance in the market followed by a reversion back to the original balance36.
4.2.4 Permanent market impact
Permanent market impact occurs when an order leads the market to believe that future price will be different than original price. An order indicating that the stock is incorrectly priced thus changes the markets belief of the stock is referred to as a permanent market impact order. A large order may start rumours resulting in a large price change. The change often contains both permanent and temporary market impact. Temporary market impact is the part that disappears with the rumours and then there is a price stabilisation and only permanent market impact has remaining effect. At a first stage when a large trade is executed the price equilibrium is changed to attract a counterpart which is shown in figure 4.2. When the trade is finished the share price is stabilised at the new market equilibrium which also is shown in figure 4.2.37
Supply Demand
New market equilibrium
Permanent market impact
Figure 4.2 Equilibrium change due to market impact38
Temporary + permanent market impact
Price concession to attract counterpart - transaction cost Supply
Demand
38 Anders Mårtensson, SEB, Stockholm, 2006-09-05
36 Optimal Execution of Portfolio Transactions, Almgren, Robert and Chriss, Neil, page 8 37 Optimal Trading Strategies, Kissel & Glantz
4.2.5 Timing risk
Timing risk indicates th
price changes during the trade’s execution. The tim liquidity risk and estimation error surrounding the m change depending on news, business information expected. This is referred to as the price vol as liquidity. The risk of not enough available example if it is a large order that shall be execu If this volume is less than available volume Definition of timing risk:
“Timing risk is the associated uncertainty in trad liquidity risk. Price volatility affects the price appr the market impact estimate39.”
.2.6 Liquidity
e uncertainty of the trading cost estimate as there is a risk that the ing risk consists of price volatility, arket impact. The expected price can or rumours that change the price from the atility. Volume available in the market is known volume is referred to as liquidity risk. For ted there has to be a certain volume available. there will be an imbalance in the market.
ing cost estimates due to price volatility and eciation estimate and liquidity risk affects
4
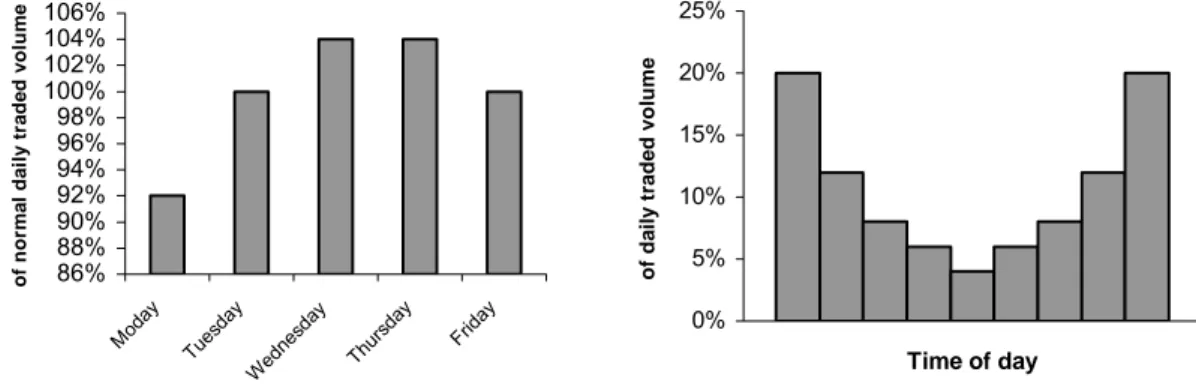
Liquidity is a term that refers to the volume of stocks that are available on the market. A stock that has a high liquidity is easier to trade as there is a larger volume accessible. Liquidity is changed every time there is an order executed, withdrawn or an order is entered to the market. Therefore liquidity is changed throughout the day and is different from day to day.
86% 88% 90% 92% 94% y y of norm a l da 96% 98% 100% 102% 104% 106% t ra de d v olum e 0% 20% 25% lu m e Moda Tuesda Wed nesd ay Thur sday Friday ily 5% 10% f d a ily t rad 15% Time of day o ed vo t available olume changes over time during the day. The volume available is the most during post opening and pre closing. That is the first hour and the volume available decreases until an hour after lunch and then volume available starts to increase and has its maximum the last hour pre close.
Figure 4.3 Weekly and intra day volume profiles
As shown in figure 4.3 liquidity changes from day to day but there is also an intraday volume rofile i.e. the volume that is on the market during a specific time. That means tha
p v
39 Optimal Trading Strategies, Kissel & Glantz, page 118
4.3 Transaction costs
Portfolio managers always aim for the highest possible return. Transaction costs are often underestimated as an important factor for a high return but are often the difference between a first-rate fund and an average fund. Transaction costs in equity markets are defined as costs incurred while implementing an investment decision40, se figure 4.2. These costs are related to all necessary actions performed during a trade. This includes the price concession needed to attract a counterpart to the trade. Portfolio managers claim that transaction costs are around 1% but can be as much as 2 to 3% for large orders in difficult market conditions or illiquid
stocks41. Many portfolio ncident that can not be
voided. However transaction costs can be the difference between a high return and an
rtfolio managers more aware of these costs. Thus US portfolio managers have e lowest average transaction costs. This is also due to the very liquid US stock market.
managers claim that it is an impossible i a
unsuccessful portfolio.
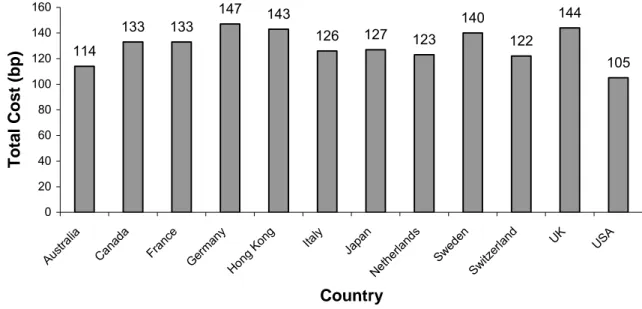
4.3.1 Transaction costs in global markets
Average transaction costs in global markets are 130bp42 which is equivalent to an average loss of 1.3% for every investment. Top researchers in this field are located in the US which has made US po th 114 133 133 126 127 123 122 105 0 20 40 60 80 100 120 140 lia ada Tot al Cost ( b p) 147 143 140 144 stra an Fran ce man y Kong Ita ly Japa n Nether lands Swed en Switzer land UK USA 160 Au C Ger Hon g Country
Figure 4.4 Transaction costs in Global Markets43
40 Optimal Trading Strategies, Kissel & Glantz, page 3 41 Optimal Trading Strategies, Kissel & Glantz, page 3 42 Optimal Trading Strategies, Kissel & Glantz, page 4 43 Optimal Trading Strategies, Kissel & Glantz, page 5
4.3.2 The investment cycle - reasons for transaction costs
The investment cycle can be divided into four stages: asset allocation, portfolio construction, execution services and portfolio attribution.
1. Asset allocation is the stage when the portfolio manager decides which investment classes, i.e. stocks, derivates, real estate and commodities, to invest in. Already at this stage transaction costs have to be considered to be able to reach expected return.
2. Portfolio construction is closely related to prior investment phase. Throughout this investment phase exact instruments to purchase or sell in each asset class are determined. If stocks are part of the portfolio instruments, the manager has to take transaction costs into consideration as there are differences in liquidity between large, mid and small capitalization stocks and therefore future result will not be as expected.
3. Execution services are the implementation of the investment cycle, also referred to as the trading phase. This is the key phase for low transaction costs. During this
phase trading into different levels of
transaction costs.
4. Portfolio attribution is to measure fund performance and determine reasons for missing expected return. This phase can also be referred as post-trade analysis. In the post trade analysis the trading performance can be evaluated. The results are
Investors p trading stra Often the t timing risk and volum aggressive passive tra always a “ two stages “Trading t to higher r This can algorithm. started alre the highes
towards op uncertainty. Almgren and Chriss are two
of the leading researchers in this field today. Their research approach is a risk-aversion parameter that specifies the investors’ level of risk. An investor with a specified level of risk
behaviour is decided which will return
very useful for future trading strategies.
4.4 Optimal trading strategies
articipating on the financial market seek an execution for their trades via optimal tegies. An optimal trading strategy has the lowest cost for the related level of risk. erm “trader’s dilemma” is used to describe the balance between market impact and . This since a trader knows that market impact is a decreasing function with time e while the timing risk increases with time and volume. For instance when trading ly the trader will cause a large market impact and have a low timing risk. To ding will incur a high timing risk and a low market impact. Therefore there is dilemma” for the trader to determine an optimal strategy somewhere between these and is often declared as:
oo aggressively will lead to higher impact cost but trading too passively will lead isk and may result in even more costly trades44.”
seem like a trivial procedure but is a complicated mathematical optimisation The first person to develop research in this subject was Harry Markowotiz who ady in 1952 with mean-variance optimization which concludes the portfolio with t expected return for a specified level of risk. The last years focus has been more
imisation to minimize price impact under t
44 Optimal Trading Strategies, Kissel & Glantz, page 18 27
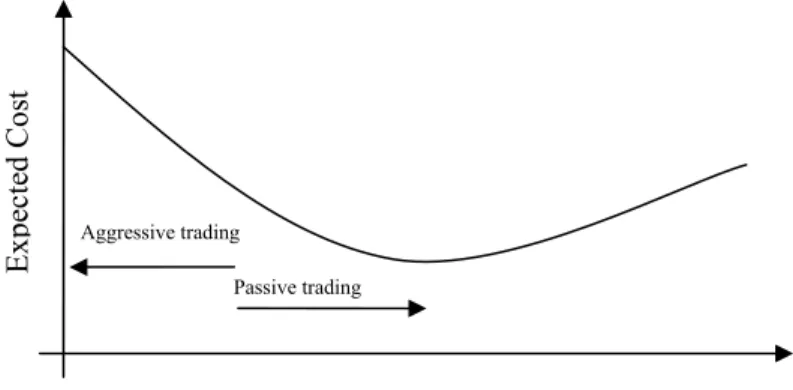
has a certain trading path that should be followed to optimise the trading cost at a specific vel of risk.
Figure 4.5 Efficient trading frontier
Market im
it affects the perform al Trading
mpact is and
what factors 4) describe in depth
the mo (2002) tries to forecast
price movem Unfo
analysing tools thus these m trading costs exist. 4.5.1 Trading Strategies le Ex pec te d C ost Passive trading Aggressive trading Timing Risk
The trading frontier is a function of strategies that contain the lowest cost for a specified quantity of risk. The frontier is solved by optimizing the algorithm for all different risk levels. Figure 4.5 is a trading frontier where the least expected cost occurs at the minimum point. However this point is related to a high risk. All strategies beyond the minimum point are inefficient since there they are dominated by strategies with the same expected cost but a lower risk.
4.5 Existing market impact models
pact is a topic extensively discussed. Several researchers discuss the issue and how ance of a fund, discussed by Kissell and Glantz in Optim
Strategies for a good overview. Several working papers discuss what market i influence the size and shape of the impact. Bikker et al (200 st important variables and the significance of these. Breen et al
ents based on public data and the information available in order books. rtunately this information is not reliable since many actors hide their orders thus not showing their intended actions. There are several corporations focusing on developing these models. However their core business is to manufacture and sell useful
odels are not available to the public.
As a result no straight forward model to quantify market impact and the expected
The modern foundation in the field was developed by Almgren and Chriss (2000). They create the efficient trading frontier which incorporates both cost and risk of trading. Our models will be based on their foundation and the expansions done by Almgren (2001) and also extended by Almgren, Thum, Hauptmann and Li (2005). The theory described in chapter 4.5.1 - 4.5.3 is a compilation of their work.
Initially we hold X shares of an asset, in this thesis the asset is considered to be stocks,
hich is to be fu idated at the end of a time frame.
w lly liqu X is positive if we initially hold an
asset which is going to be sold and X is negative if we are going to buy X units of the asset.
In the thesis we only consider a single asset and not a portfolio of different assets.
Shares holding at time t is denoted by x t
( )
, withx( )
0 =X and x T( )
= . If we ignore serial 0 correlation in the asset price increments the optimal strategy may be determined prior to trading. As Almgren and Chriss (2000) argue there are only marginal improvements in the optimal trading strategy by incorporating correlation thus we ignore this price movement characteristic and are therefore able to create static strategies45.The discrete model is created on the following statements. The time frame of the trade is divided into uniformed trading intervals,τ with N =T/τ intervals thus tk =kτ for
0,...,
k = N . The holding of stocks is denoted x which corresponds to time tk k, with x0 = X and 0xN = . The sales realised between time tk−1 and t are k nk = xk−1− . This corresponds xk
to the sale velocity vk =nk /τ shares per unit time.
1 1 , 0,..., k N k j j j j k x X n n k N = = + = −
∑
=∑
= Equation 1e make no assumptions of the rate of trading within each interval expect that the volume nk
interval.
.5.2 Price Dynamics
W
is traded until the next time
4
We denote the market value of the asset by S thus the initial value of the portfolio isk XS . 0 The price dynamics is characterised by forces regardless of our trading, these are the volatility and the drift of the asset. However the impact of our trading has an effect on the price. The
permanent impact contributes to the price dynam anges in the market
equilibrium due to our trade. The price is assumed to follow an arithmetic random walk: ics because of the ch
( )
1/ 2 1/ 2 1 0 1 k k k k j j j S S στ ξ τg S στ ξ τ g v τ − = = + − ⎜ ⎟= + − ⎝ ⎠∑
∑
Equa 2The random variabl
1 k j= tion es k n ⎛ ⎞ j
ξ are independent random variables with zero mean and unit variance
σ is the absolute volatility and is the permanent impact function as a function of the rate of trading during a trading interval. The permanent impa function is assumed to be linear thus it will not affect the optimal trading strategy, which is also empirically determined
by Almgren 2005. The drift is neglected i due to the relative short time horizon of
e trades.
( )
g v ct n this thesis th45 Static strategies are determined in advance of trading
However the temporary impact affects the price of each trade in each interval resulting in a temporary drop in the average price per share. The price per share received at each interval is
1 1,.. k k n S S h τ ., k N − ⎛ ⎞ = − ⎜ ⎟ % ⎝ ⎠ = Equation 3
Where h
( )
υ represent the temporary impact function. The interpretation of the function is at in order to trade υτ shares in τth we must accept a price concession.
4.5.3 Cost of trading
The revenue of all trades or equivalent the total cash received is often referred to as the capture. This is the sum of all units we sell in each time interval multiplied by the price per
hare,S~k s in each interval:
( )
( )
1 2 0 1 1 1 1 N N N N k k k k k k k k k k k k n S XS στ1 xξ τ x g υ τ υ h υ − = = = = = + − −∑
%∑
∑
∑
Equation 4 0XS represents the initial market value of the portfolio, each additional term represent effects
price drop caused by selling a piece of the position. The temporary impact represents the value loss acting only on the units of asset we are selling in the period.
The total cost of implementing a trade, also referred to as implementation shortfall, is the difference of the initial market value of the asset and the capture
on the revenue due to the different price movement factors. The first term represents the volatility effect, the second the permanent ma ket impact representing the value loss due tor
: k th
0 k
Implementation shortfall= XS −
∑
n S%hortfall is a random variable because of the uncertainty of price ovements. In pre-trade analyses,
Equation 5
The implementation s
0
t = , we use the expected shortfall and the variance
1
( )
E x m
of the shortfall V x
( )
to optimize the trade. The results are dependent of the number of asset held at each time, x1,...,xn− .(
)
( )
( )
(
)
1 1 1 1 2 2 1 1 1 ,..., ,...,xN N N N k k k k k k N k k E x x x g v v h v V x x τ τ σ τ − = = = =∑
+∑
Equation 6 − =∑
30business today. inancial actors always seek to decrease their costs through efficient trading especially large
onclusion is that there is not standard model for the market. In chapter 5 and 6 we develop the theory into practical usable models.
4.6 Summary of the theoretical model
Reducing risks and costs are essential economic targets for a modern F
orders as they have a market impact which will increase the cost of the trade. Different researchers within this field use different formulas. Therefore a c
a
5.
C
REATING A USEFUL MODEL
The development of a useful model is described to the reader in this chapter.
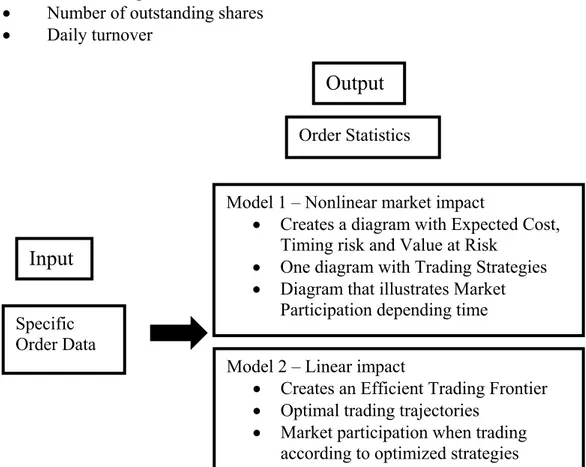
5.1 Model distinction
As a result of no standard models we decide to create two separate models. The idea is that the models should capture different characteristics thus serve as good complements. Most empiric research indicates that market impact is a non linear function46. When optimizing trading strategies with market impact constraints using non linear function result in a not analytical solvable equation system. We chose not to use a numeric optimizing tool but instead create a non linear impact model without optimized strategies and one linear impact model with optimized trading. When using linear impact it is possible to analytical optimize the trading.
The model using non linear impact should result in more accurate pre trade estimates since it is statistically evaluated on the US market. The trading recommended is constant normalized with the intra day volume profile. If 10 % of the daily traded volume is traded between 09.00 and 09.30, 10% of our order will be traded in this time period.
Further we create a model with optimized trading trajectories. In this model we make the simplification of linear impact functions. The model present more complex trading strategies on expense of using empiric rejected impact functions.
5.2 Model 1: Nonlinear Market Impact
This model is based on research done by Almgren et al (2005).
5.2.1 Definitions
The appearances of market impact functions have been widely discussed. Most empiric research indicates that they are power laws. In this model the impact is described by two functions. The permanent impact, I, reflects the information release. The realized impact, J, is the cost actually spent on the trade.
46 Optimal Execution with Nonlinear Impact Functions and Trading-Enhanced Risk Almgren, Robert
0 0
0 0
0 is the market price at beginning of order is the market price after the trade is executed
is the average price on the trade
post post S S I S S S J S S S S − = − = % % Equation 7
The post trade price should reflect the permanent price change and is measured one time step after the completion of the trade. Earlier measured times will include the temporary time lagging effects.
The impact can be of either sign since the volatility of the stock plays a significant part of the costs. The expected impacts are however considered to be unfavourable thus when executing a buy order the stock price increases and the opposite for a sell order.
The ambition is to describe the impact functions and the cost by a few input variables.
1
0 0
0
, order size
, fraction of daily traded volume between and , fraction of daily traded volume between and
n j j
n n
post post n post
X x T t T t τ τ τ τ = = = − = −
∑
t t Equation 8In the model a constant rate of execution is assumed, . However a constant rate defined by dividing the order size by the number of execution periods would not give satisfying results due to the intra day volume profile. Thus all the calculations are done with respect to volume time,
v
τ . The volume time represents the fraction of a daily number of shares that has been traded at time . At market opening t τ equals zero and at closing τ equals one. The volume profile can be measured by several different methods, as discussed in previous chapter. We use a moving average to calculate the specific profiles. The rate of trading is therefore constant in volume time, v = X T.
Additional stock unique variables need to be taken into account. ,
,
V daily traded volume
daily volatility
σ
The volatility, as well as the total daily volume traded, can be estimated through several different methods. However it is important to use a method that captures changes since they have a great influence on the results. We use a moving average for the traded volume and estimate the volatility from the previous thirty days.
In the model the size of the order is measured as the fraction of the order size and the daily traded volume X V . The traded volume during the time we execute the order is also of
significant importance. Since T is a fraction of daily traded volume between and we
simple multiply T with . The intuition is that the trader’s additional participation of daily
traded volume should affect the motion of the stock.
0
t tn
V
5.2.2 Assumptions in the model
The permanent impact is assumed to be independent of trading time and trading trajectory thus only reflecting the information released to the market by the order. The temporary impact reflects the supply and demand imbalance and the price concession needed to attract counterparties. Therefore the impact is very dependent on trading rate at the specific execution time. The total impact comprises both the temporary and the permanent impact. The stock is assumed to follow an arithmetic Brownian motion. We assume that trading one stock does not affect others stocks and that the impact functions behave similar over the trading period. Further the motion of the stock is affected by the permanent impact, which is an increasing function of trading rate.
0 0
0
0 is
( )
( ) the drift ter of the stock thus driven by the permanent impact ( )
is a function driven by a Brownian motion ( )
dS S g d S dB S g d g S dB B m random = υ τ + σ υ τ υ σ τ Equation 9
The expression is integrated in volume time for 0≤ ≤ and τ T υ= X T/ resulting in the permanent impact
( )
, where 0,1 post X I Tg T N T σ ξ ξ ⎛ ⎞ = ⎜ ⎟+ ∼ ⎝ ⎠ Equation 10If g( )υ is a linear function then the accumulated drift at time τ is proportional to the number of shares executed, X Tτ , and the total permanent impact is proportional to total order size
X independent of execution time (τ = → ∗T T X T = X ).
Temporary impact affects the price received during the trade. Where the impact is scaled by the starting price of the stock.
0 ( ) ( ) X S S S h T τ = τ + ⎛⎜ ⎞⎟ ⎝ ⎠ % Equation 11
Temporary market impact is very influenced by the number of shares that the trader executes in current time period.
Using constant liquidation and time average of the execution price results in an expression for the temporary market impact
( )
4 3 , where 0,1 independent of 2 12 2 post post post T T I X T T J h N T σ T χ T ξ χ ⎛ ⎛ ⎞ − ⎞ ⎛ ⎞ ⎜ ⎟ − = ⎜ ⎟+ ⎜⎜ − ⎟⎟ − ∼ ⎜ ⎟ ⎝ ⎠ ⎝ ⎝ ⎠ ⎠ ξ Equation 12 2I reflects the permanent impact’s effect on the price due to traded stocks in previous time periods. The error term arises because of the Brownian motion in the stock price process.
5.2.3 Estimating the impact functions
The form of the impact functions have been widely debated and investigated. A common fact is that they are power law functions. Researches have shown that the temporary impact function most likely is a concave function i.e. exponent less than one. Lillo et al (2003) suggested by empiric research that the function has the exponent of a square root. The permanent function is preferred to be linear since this implies that the impact is independent of trading time. The general appearances of the functions are
( )
( )
where the sign of and are the same as for , negative for a sale order and positive for a buy order
b g v v h v v g h v α γ η = ± = ± Equation 13
It is possible to estimate these functions and variables for individual stocks and separate buy from sell orders. However to create a common model we make no such distinctions.
The impact functions will vary over time since the properties of the stock changes. To capture the effect of an order size, it is defined as the number of shares relative the flow of shares during the trading time. Impact functions are expressions of the dimensionless amount X VT , where V is the average number of traded shares per day. The intuition is that trading at a day with low turnover creates a larger impact than on a day with large turnover.
Further the impact functions are scaled with the stock volatility to measure the impacts as a fraction of the normal daily motion of the price instead of a percentage.
To adjust the model to stocks with different liquidity an additional function is added to the permanent impact.
where is the total number of shares outstanding L V δ Θ ⎛ ⎞ = ⎜ ⎟⎝ ⎠ Θ Equation 14
The measurement represents the inverse turnover and has been used in earlier empiric studies. With these modifications the impact functions are
Θ V 2
where noise is the error due to the volatility X I T noise VT I X J noise VT α β δ γσ ησ ⎛ ⎞ = ⎜ ⎟ + 〈 ⎝ ⎠ − = + 〈 〉 〉 Equation 15
Almgren et al (2005) estimated the variables in this model on the US stock exchange. They used a sample of 29000 orders done on very liquid stocks. The results are
0.314 0.142 1 3 5 1 4 γ η α β δ = = = = =
The results are in the 95 percent confidence intervals. One result is that the linear impact function can not be rejected which is of an enormous practical aid. The exponent of the temporary impact function results in a concave function. The intuition is that the bigger the trade is the less additional cost per share is experienced. The positive value of δ indicates that the more traded shares per day the less costs are experienced.
The resulting formulas for the expected cost and the variance of the cost are
( )
1 4 3 5 2 Θ V 2 1 3 X I V I X J VT V J T γσ ησ σ ⎛ ⎞ = ⎜ ⎟ ⎝ ⎠ = + = Equation 16The cost received on the order is and J I is the price motion from pre until post trade. The
results will vary between different stocks and the most significant variable is the volatility of the stock.
5.3 Model 2: Linear impact with optimized trading trajectories
The aim of this model is to execute a portfolio from a given starting composition to a specified final composition. It seeks to minimize the costs of trading, with a penalty for the uncertainty of the cost, a penalty that estimates an uncertainty cost over time. Depending on the trader’s tolerance for risk there are different strategies for trading. A person with a low level of risk will always try to execute an order as fast as possible but to a high expected cost. In contradiction a person with a high level of risk will execute an order during a long time at a low expected cost but with a high uncertainty in final revenue.
In chapter 4 the definition of trading strategies, price dynamics and cost of trading are explained. These are utilized and developed in chapter 5.3.1 - 5.3.3.
5.3.1 Temporary Market Impact
Temporary market impact refers to temporary imbalance in supply and demand caused by our trading which leads to temporary price movements away from equilibrium. For example if a trader decides to sell a certain number of units between times nk tk−1 and . The order is sliced into smaller pieces to locate optimal points of liquidity. If the total number of units is large, the execution price may steadily decrease during a time period. If this effect is short lived and liquidity returns after each time period it is temporary market impact. The temporary impact function
k
t
( )
h v is the temporary drop caused by trading at an average rate during one timer interval. Given the actual price per share received on sale k is:
v 1 k k k n S S h τ − ⎛ ⎞ = − ⎜ ⎟ ⎝ ⎠ % Equation 17
As h v
( )
only is temporary impact it will not affect the next market price.5.3.2 Linear Impact Functions
In this model temporary and permanent functions are assumed to be linear which does the computing of optimal trading trajectories significantly easier than with non linear impact functions.
Linear permanent impact g v
( )
= , with the constant γv γ has units of (SEK/share)/share. Each unit that we sell will depress the price per share by γ , regardless of the time we take to sell nthe units. The permanent impact term of the estimated cost function develops to:
(
)
(
2 2(
)
2)
2 -1 -1 -1 1 1 1 1 1 1 - - - - -2 2 N N N N k k k k k k k k k k k k k k k n 2 1 1 2 N k k x g x n x x x x x x x X n τ γ γ γ γ γ τ = = = = ⎛ ⎞ = = = = ⎜ ⎟ ⎝ ⎠∑
∑
∑
∑
=∑
Equation 18 375.3.3 The Efficient Frontier of Optimal Execution
As stated earlier a trader will always seek to minimize the expectation of shortfall for a given level of variance of shortfall. A trading strategy is efficient or optimal if there is no strategy that has lower variance for the same or lower level of expected variance. With the unconstrained optimization problem
( )
( )
(
)
min
x E x +λV x
It is possible to sketch an efficient frontier for λ> and it is strictly convex and has unique 0 solution. The parameter λis measure of risk aversion. A person with a high value of lambda is a person with a low level of risk and will execute an order faster than a person with a lower lambda. A person with a low level risk has a higher expected cost and a lower variance than a person with a higher level of risk, as it executes faster and therefore has larger impact on the price.
With and from chapter 3 it is possible to find a unique global minimum from the
combination of . By setting its partial derivatives to zero we can find
out global minimum.
( )
E x V x( )
( ) ( )
( )
U x =E x +λV x -1 1 2 2 - 2 2 - j j j j j x x x U x x δ τ λσ η δ τ + + ⎧ ⎫ = ⎨ ⎬ ⎩ % ⎭ Equation 19For j=1,....,N −1. Then δ δU xj = 0 which equals
(
)
2 -1 1 2 1 - 2 j j j j x x x κ x τ + + = % With 2 2 2 1-2 λσ λσ κ η η γτ η = = ⎛ ⎞ ⎜ ⎟ ⎝ ⎠ % %From these equations we can get a trading trajectory of the form:
(
)
(
)
( )
sinh 0,...., sinh j j T t x X j T κ κ − = = N Equation 20And nj the sum of sold shares: